









Hot Stock Snapshot: Archer Daniels Midland ($ADM)
Archer-Daniels-Midland ($ADM) is one of the world’s largest agricultural processing and nutrition companies, occupying a critical position in the global food supply chain. The company purchases, transports, stores, processes, and distributes agricultural commodities including corn, soybeans, wheat, and oilseeds before converting them into products used in food manufacturing, animal nutrition, renewable fuels, industrial ingredients, and specialty nutrition. Its business is organized around three primary operating segments: Ag Services & Oilseeds, Carbohydrate Solutions, and Nutrition. This diversified operating model allows ADM to participate throughout the agricultural value chain rather than relying on a single commodity or end market.
ADM earns its revenue by creating value through processing, logistics, merchandising, and ingredient manufacturing rather than simply buying and selling grain. Its vast transportation network, storage infrastructure, crushing facilities, ethanol plants, and food ingredient operations provide significant scale advantages that few competitors can replicate. Customers include many of the world’s largest food manufacturers, beverage companies, livestock producers, renewable fuel companies, and industrial processors. The company’s global footprint also enables it to capitalize on regional supply and demand imbalances while maintaining long-standing commercial relationships across more than 170 countries. ([StockAnalysis][1])
Like most agricultural businesses, ADM operates in a cyclical industry where earnings are influenced by crop production, processing margins, biofuel demand, global trade flows, and commodity prices. Management has been working to lessen that cyclicality by expanding higher-margin nutrition products and value-added ingredients while improving operational efficiency. Recent policy support for renewable fuels has also strengthened the outlook for portions of its processing business, particularly soybean oil demand. ([Reuters][2])
For traders, the most compelling aspect of ADM today is not the business itself but the disconnect between its business cycle and its stock performance. The company is emerging from a period of declining earnings, yet the stock has become one of the strongest performers within its peer group. Leadership often begins before fundamentals fully recover, making ADM a stock worthy of close monitoring.
Revenue and Earnings Analysis
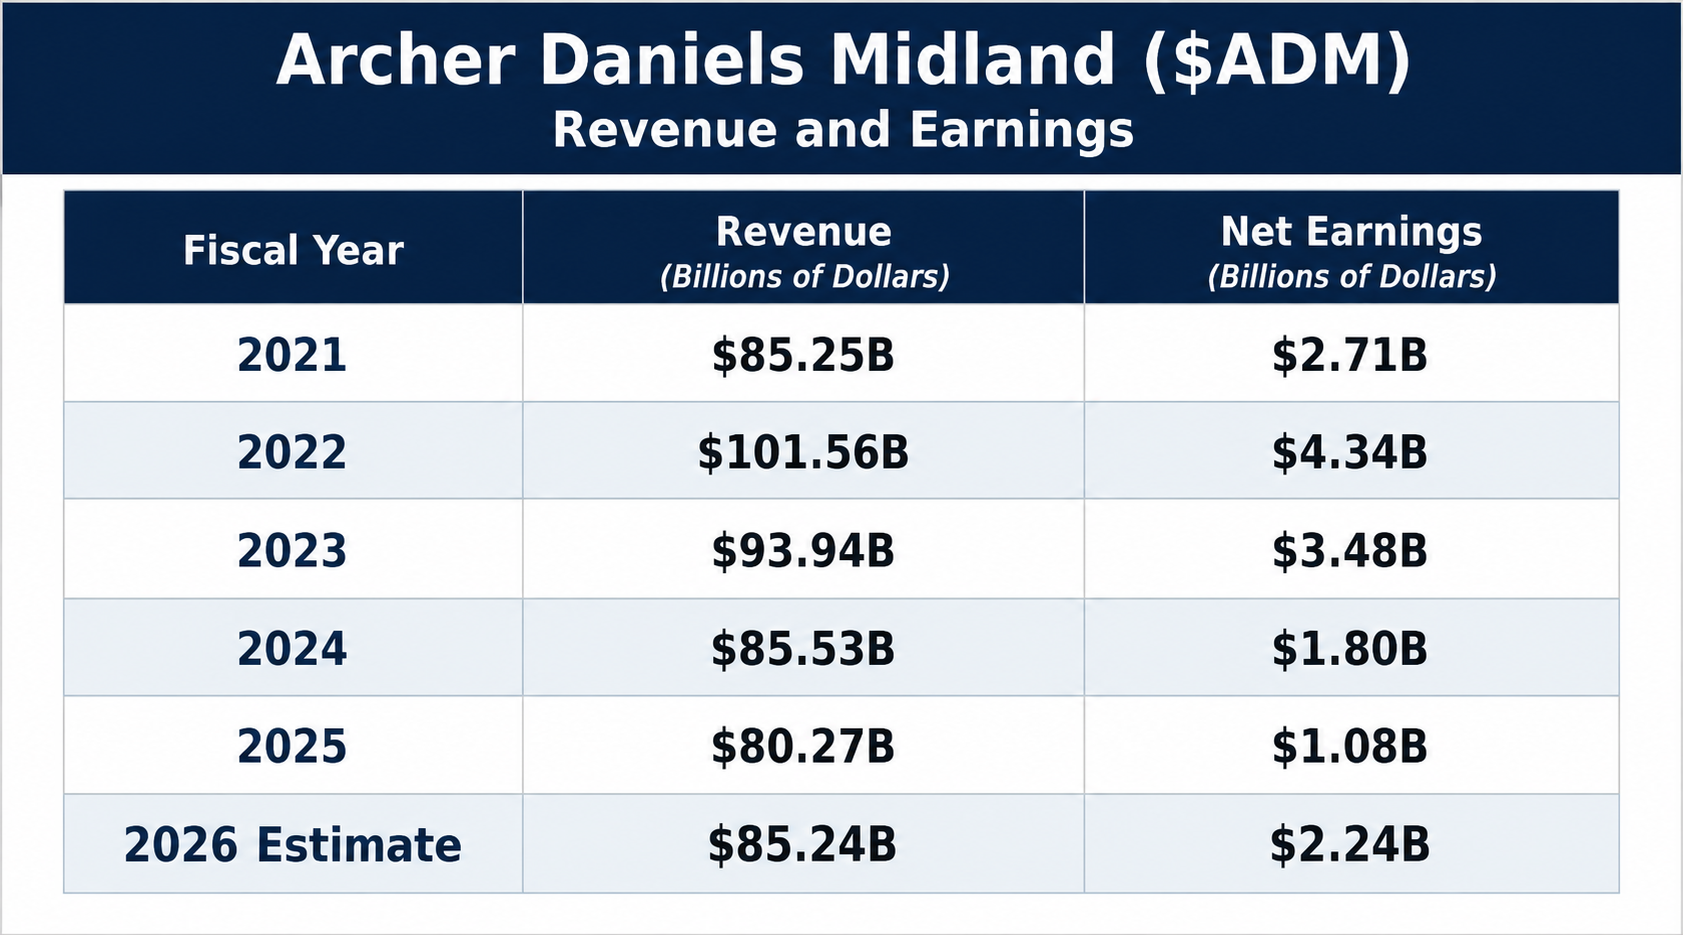
There was a time when Wall Street looked at a company that earned four billion dollars and said, “Nice job.” Now it looks at a company that earns two billion dollars and says, “What’s wrong with you?” ADM’s revenue has cooled from the agricultural gold rush of 2022, and earnings have followed it back down to Earth with all the grace of a grain elevator dropped from low orbit. But here’s the part the crowd often misses: Wall Street isn’t paid to admire the rearview mirror. The consensus expects earnings to begin recovering in 2026, even as revenue stabilizes, suggesting management is squeezing more profit out of every dollar of business rather than simply praying for another commodity boom. Traders should pay attention because stocks have an annoying habit of sniffing out better days long before the financial headlines do.
ADM’s financials tell the story of a business that benefited enormously from the exceptional agricultural environment of 2022 before returning toward more normalized profitability. Revenue has moderated for three consecutive years while earnings have declined more sharply as processing margins compressed. Wall Street now expects revenue growth to resume in 2026 along with a meaningful rebound in net income as biofuel demand improves and operating conditions normalize. The key question for investors is not whether ADM can repeat its 2022 results, but whether management can successfully transition the company toward steadier, higher-quality earnings through Nutrition, value-added processing, and continued operational improvements.
52-Week High / Low Boundaries
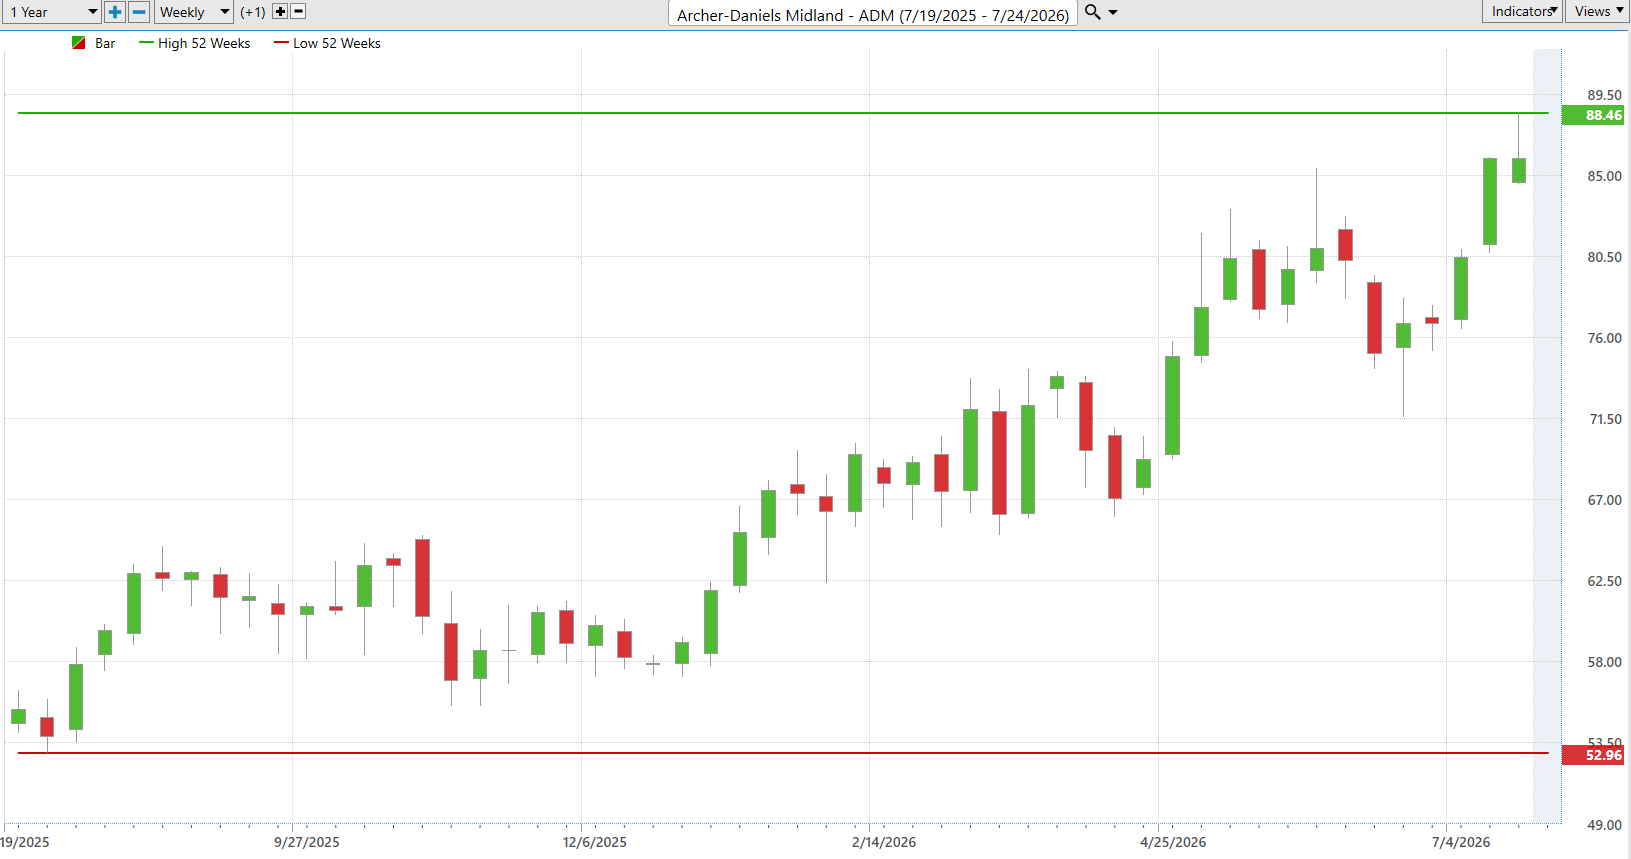
The attached 52-week chart shows ADM trading near the upper end of its annual range. With a 52-week high of $88.46 and a low of $52.96, the stock has recovered dramatically from last year’s weakness and now sits close to new annual highs. Psychologically, this is an important development because shareholders who purchased throughout most of the past year are now sitting on gains rather than losses. Stocks approaching their annual highs often experience less overhead selling pressure than stocks attempting to recover from prolonged declines. That does not guarantee higher prices, but it does indicate that buyers have maintained control of the longer-term trend.
Best Case / Worst Case Scenario
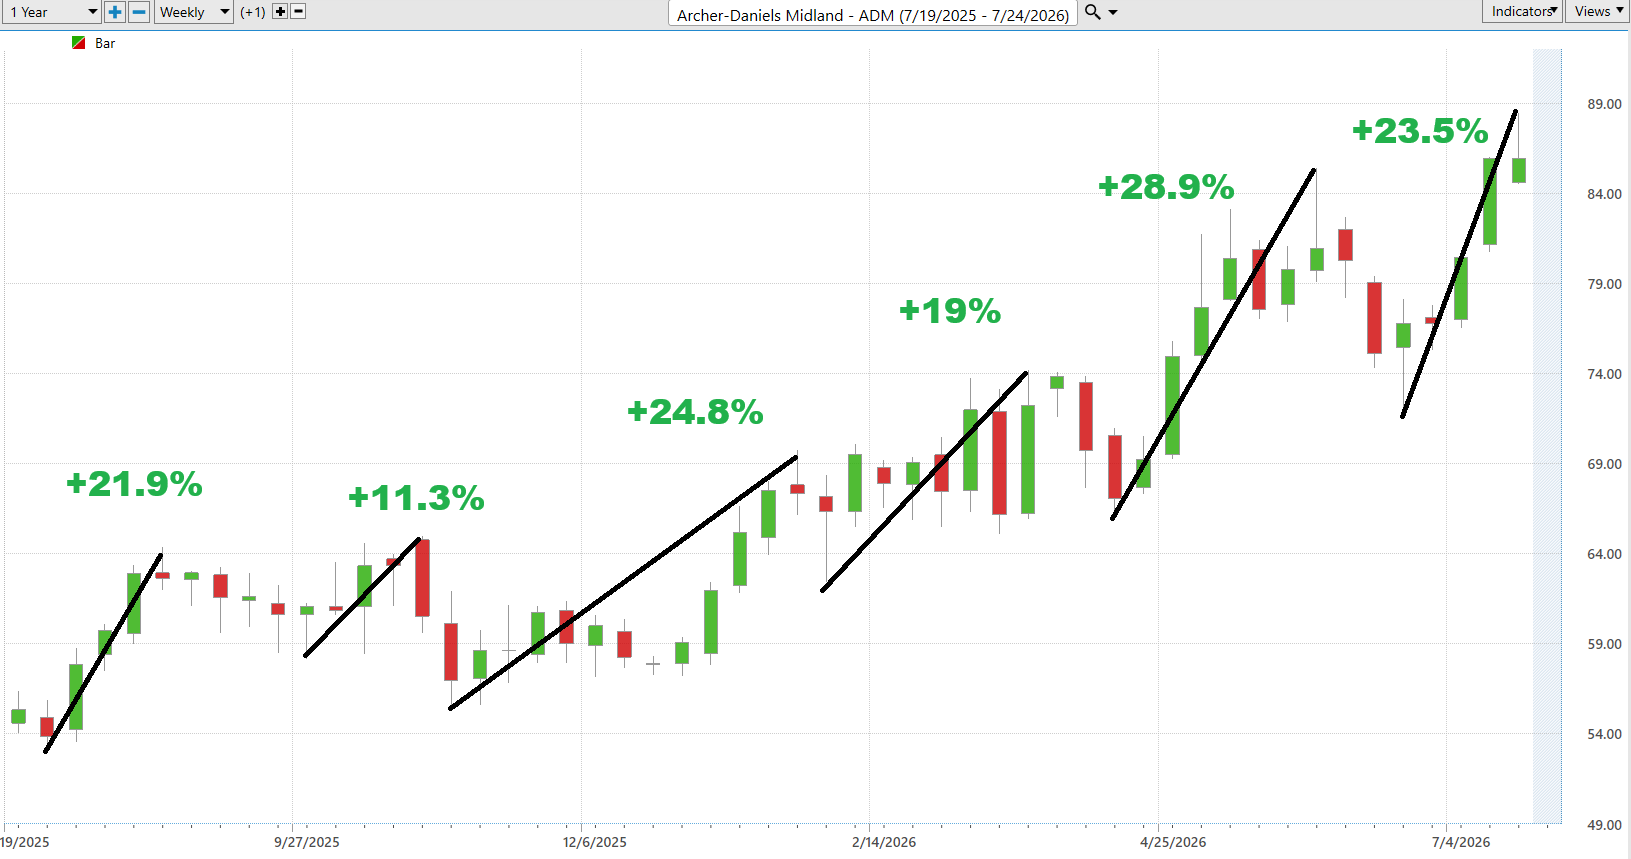
The historical volatility profile provides useful perspective on risk. The largest advances over the past year have generally ranged from approximately 11% to nearly 29%, demonstrating that once momentum develops, ADM has historically been capable of producing substantial trending moves.
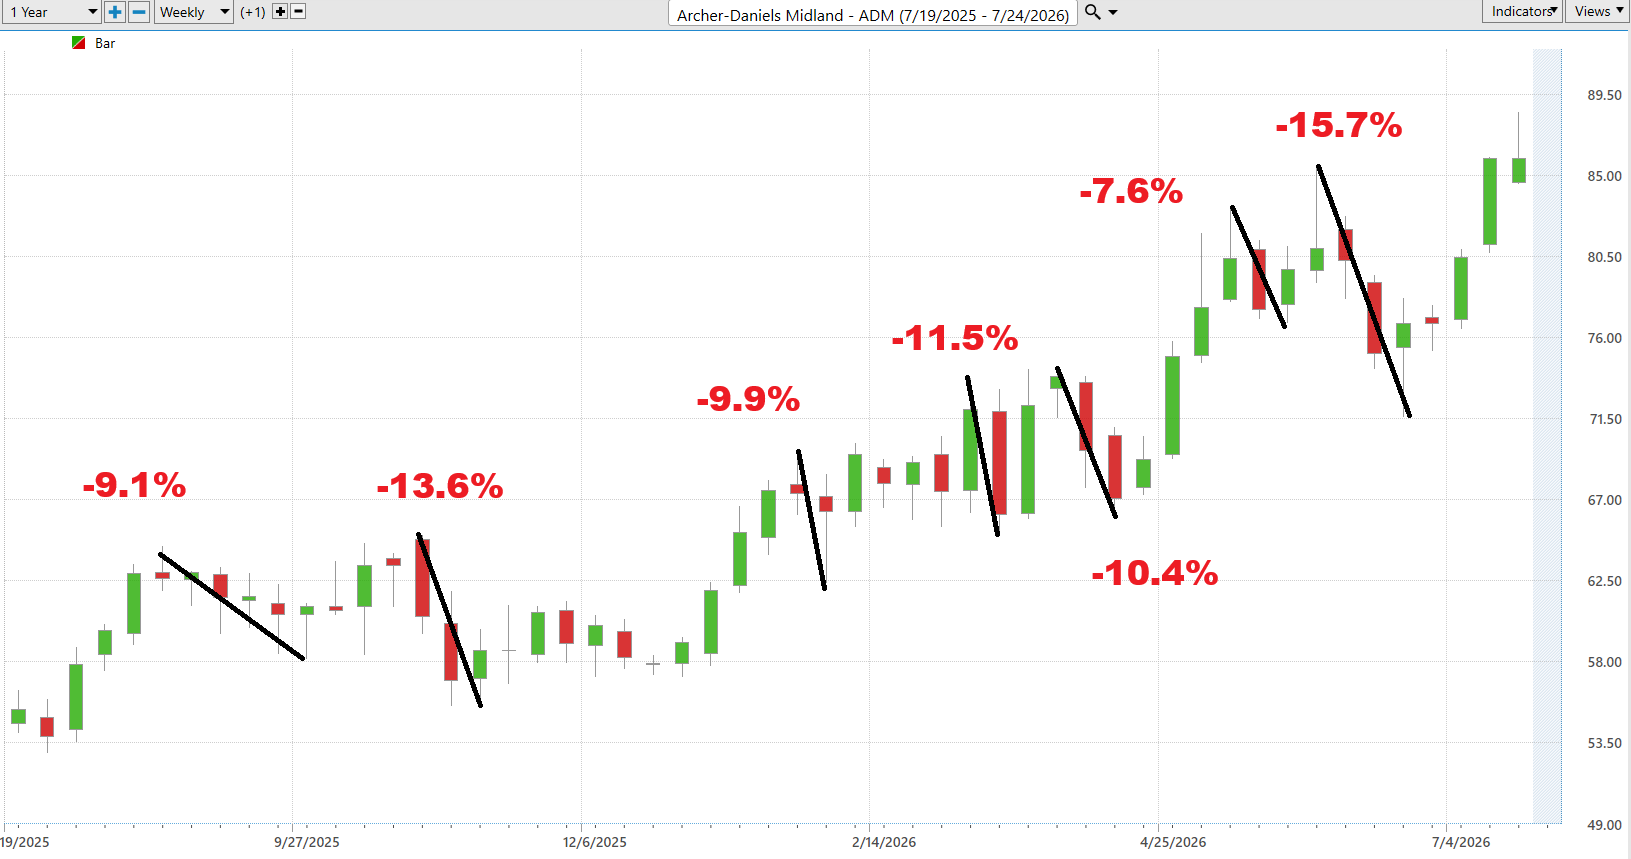
Historical declines have generally fallen within a range of roughly 8% to 16%, reflecting meaningful but relatively orderly corrections. The base case remains continued constructive price action provided buyers continue defending pullbacks and the longer-term trend remains intact. As always, these historical moves illustrate probabilities rather than predictions.
Comparison Metrics
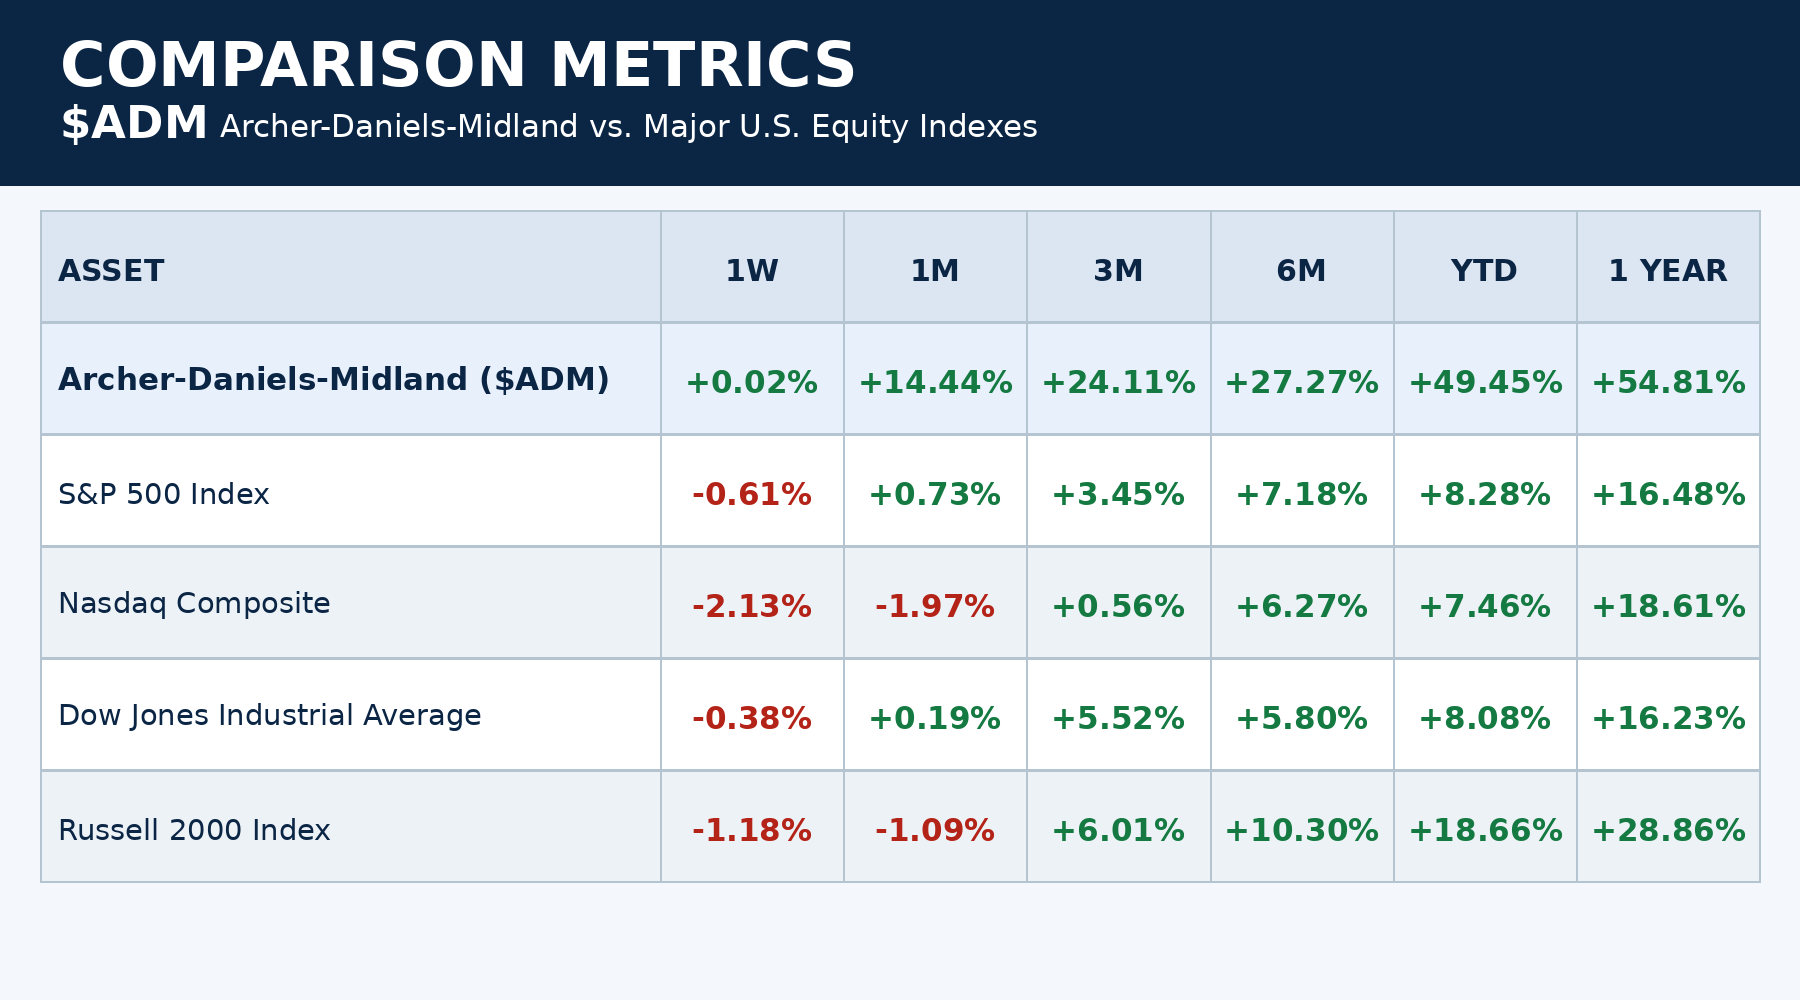 ADM’s strongest characteristic today is its relative strength. The Comparison Metrics graphic shows the stock outperforming the S&P 500 across the one-month, three-month, six-month, year-to-date, and one-year periods. It has also exceeded the performance of the Nasdaq Composite, Dow Jones Industrial Average, and Russell 2000 over those same intermediate and longer-term time frames. That broad-based outperformance suggests sustained market leadership rather than a short-lived rally. For traders, leadership matters because the strongest stocks often continue attracting capital until objective evidence indicates that trend has changed.
Predictive Blue Line
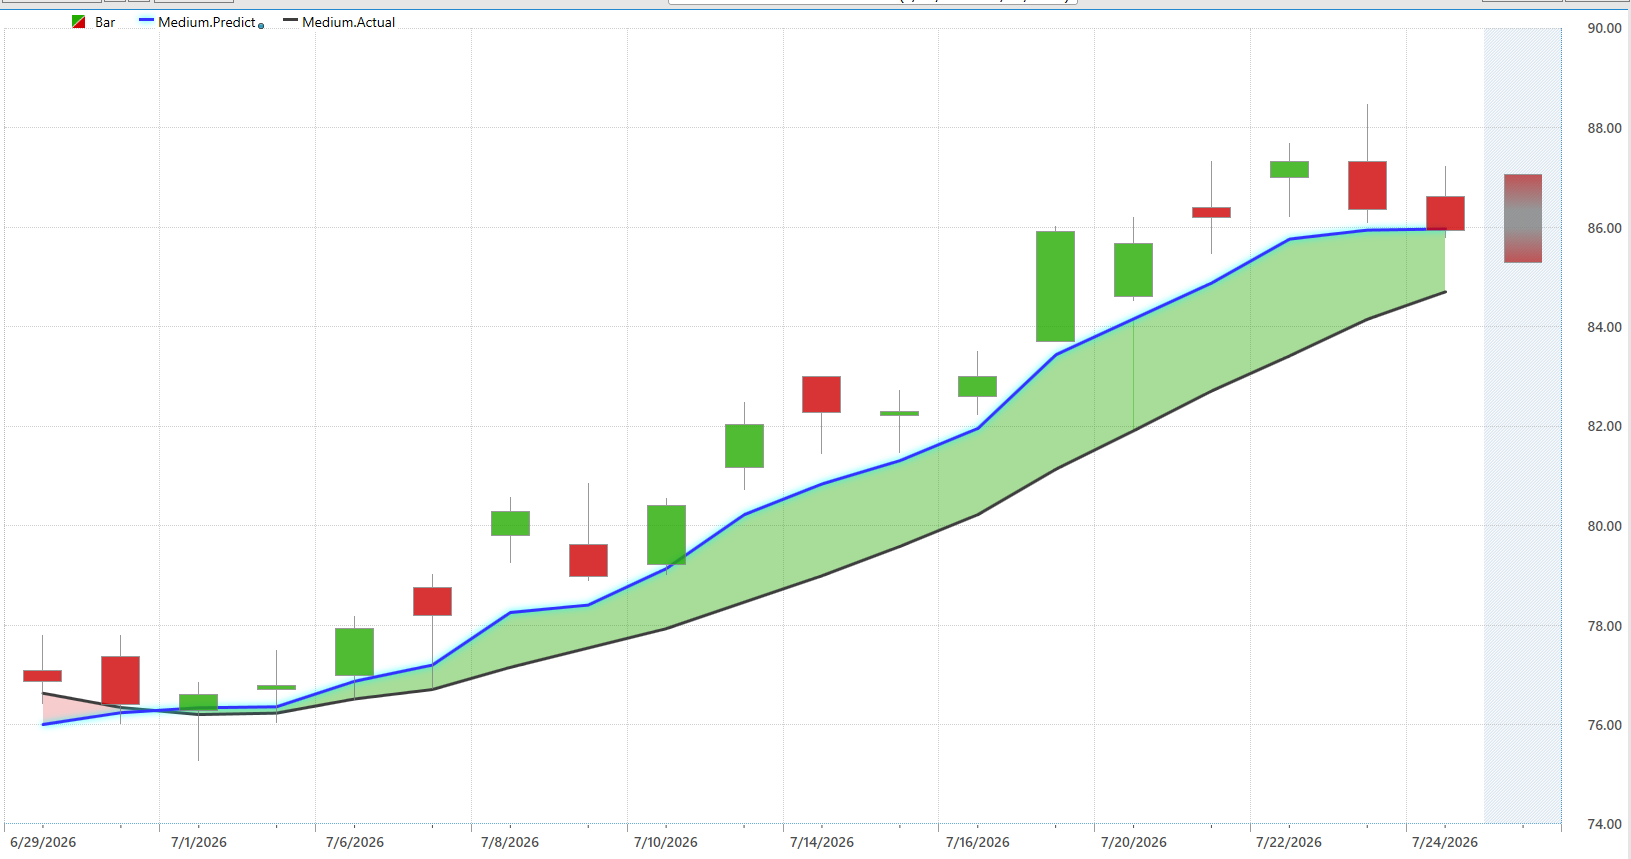
The Predictive Blue Line continues trending above the simple 10 day moving average while maintaining a positive slope. Although the forecast has flattened slightly during the most recent trading sessions, the overall trend remains constructive. Traders should monitor whether the Predictive Blue Line resumes making higher highs or begins rolling over toward the actual moving average, as that relationship can provide an early indication that momentum is changing.
Neural Index
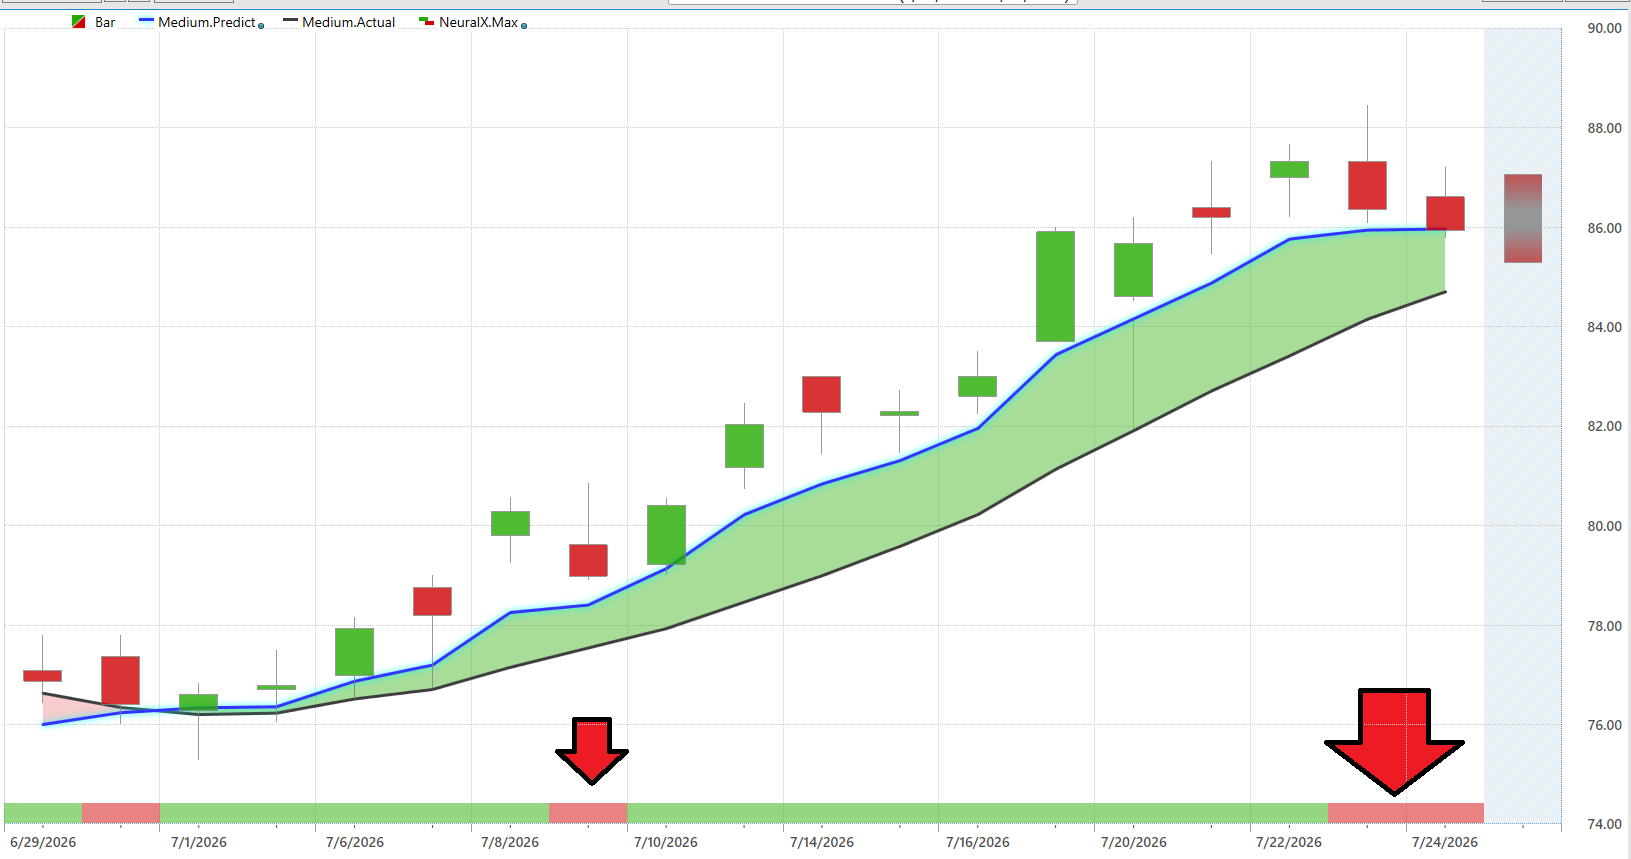
The Neural Index continues to support the prevailing uptrend, although recent fluctuations suggest some short-term hesitation following a strong advance. When viewed alongside the Predictive Blue Line, the indicators remain generally aligned with the existing trend rather than signaling a confirmed reversal. Traders should continue monitoring both indicators together, recognizing that confirmation is typically more meaningful than either signal viewed in isolation.
Daily Range Forecast
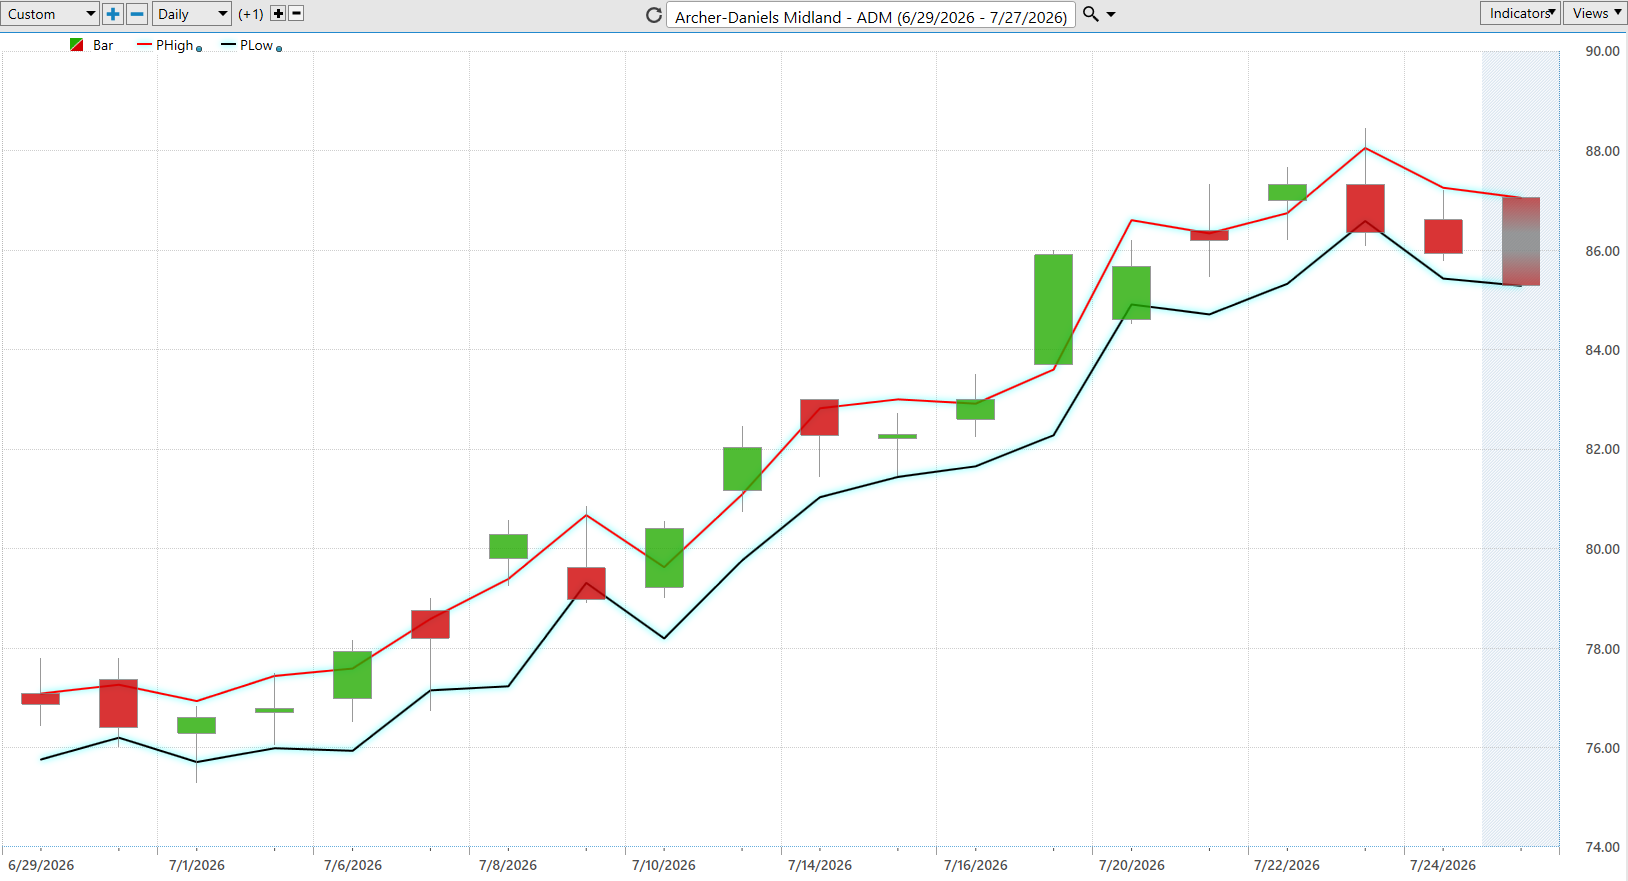
The Daily Range Forecast for ADM suggests that momentum remains constructive, but the character of the move is beginning to change. Throughout most of the past month, both the predicted highs and predicted lows have advanced steadily, creating a series of higher trading ranges that reflected persistent buying pressure. Over the past several sessions, however, the forecast has begun to flatten. Predicted highs are no longer accelerating higher, while predicted lows remain well above earlier levels, indicating that buyers continue to control the broader trend even as upside momentum moderates. For traders, this is often the point where discipline becomes more valuable than enthusiasm. A trend that pauses after a strong advance is not necessarily weakening, but it is asking participants to distinguish between healthy consolidation and genuine deterioration.
The opportunity now lies in watching how price behaves within that forecasted range. If ADM continues respecting the rising projected lows while challenging the upper boundary of the forecast, it would suggest institutions remain willing to accumulate shares on modest weakness rather than chase prices indiscriminately. On the other hand, a decisive break below the projected daily range would represent the first objective sign that the balance of supply and demand may be shifting. Successful traders rarely predict the next move; they observe how price responds to well-defined boundaries and let the market reveal its intentions. Right now, the Daily Range Forecast still favors the bulls, but it also reminds us that the strongest trends are sustained by disciplined risk management, not optimism alone.
Our Suggestion
Management continues executing a strategy focused on improving the quality of ADM’s earnings by expanding higher-margin Nutrition operations while strengthening its traditional agricultural processing businesses. Recent improvements in the renewable fuels landscape have also provided a more supportive operating environment, and management has indicated that improving oilseed margins and biofuel demand should contribute to a stronger earnings recovery going forward.
From a trader’s perspective, the technical evidence is currently more compelling than the recent earnings history. The stock has established sustained relative strength, the Predictive Blue Line remains constructive, the Neural Index continues supporting the prevailing trend, and shares are trading near their 52-week high. Those observations suggest buyers continue controlling the longer-term trend. The next earnings report will be an important test of whether improving fundamentals begin catching up with the stock’s technical leadership. Until objective evidence changes, ADM deserves a place on an active trader’s watchlist because strong stocks have a tendency to remain strong longer than many market participants expect.
Ready to learn more about forecasting stocks and options days before anyone else with up to 87.4% proven accuracy? Attend a FREE LIVE CLASS.
It’s not magic.
It’s machine learning.
THERE IS A SUBSTANTIAL RISK OF LOSS ASSOCIATED WITH TRADING. ONLY RISK CAPITAL SHOULD BE USED TO TRADE. TRADING STOCKS, FUTURES, OPTIONS, FOREX, AND ETFs IS NOT SUITABLE FOR EVERYONE.IMPORTANT NOTICE!
DISCLAIMER: STOCKS, FUTURES, OPTIONS, ETFs AND CURRENCY TRADING ALL HAVE LARGE POTENTIAL REWARDS, BUT THEY ALSO HAVE LARGE POTENTIAL RISK. YOU MUST BE AWARE OF THE RISKS AND BE WILLING TO ACCEPT THEM IN ORDER TO INVEST IN THESE MARKETS. DON’T TRADE WITH MONEY YOU CAN’T AFFORD TO LOSE. THIS ARTICLE AND WEBSITE IS NEITHER A SOLICITATION NOR AN OFFER TO BUY/SELL FUTURES, OPTIONS, STOCKS, OR CURRENCIES. NO REPRESENTATION IS BEING MADE THAT ANY ACCOUNT WILL OR IS LIKELY TO ACHIEVE PROFITS OR LOSSES SIMILAR TO THOSE DISCUSSED ON THIS ARTICLE OR WEBSITE. THE PAST PERFORMANCE OF ANY TRADING SYSTEM OR METHODOLOGY IS NOT NECESSARILY INDICATIVE OF FUTURE RESULTS. CFTC RULE 4.41 – HYPOTHETICAL OR SIMULATED PERFORMANCE RESULTS HAVE CERTAIN LIMITATIONS. UNLIKE AN ACTUAL PERFORMANCE RECORD, SIMULATED RESULTS DO NOT REPRESENT ACTUAL TRADING. ALSO, SINCE THE TRADES HAVE NOT BEEN EXECUTED, THE RESULTS MAY HAVE UNDER-OR-OVER COMPENSATED FOR THE IMPACT, IF ANY, OF CERTAIN MARKET FACTORS, SUCH AS LACK OF LIQUIDITY. SIMULATED TRADING PROGRAMS IN GENERAL ARE ALSO SUBJECT TO THE FACT THAT THEY ARE DESIGNED WITH THE BENEFIT OF HINDSIGHT. NO REPRESENTATION IS BEING MADE THAT ANY ACCOUNT WILL OR IS LIKELY TO ACHIEVE PROFIT OR LOSSES SIMILAR TO THOSE SHOWN.


