




This week’s AI stock spotlight is Advanced Micro Devices, Inc. ($AMD).
AMD was founded in 1969 by a small group of former Fairchild Semiconductor engineers led by Jerry Sanders, and it spent most of its first four decades as the scrappy second source in x86 processors, living permanently in the shadow of Intel. That framing no longer describes the company. Headquartered in Santa Clara, California and led by Chief Executive Officer Lisa T. Su, AMD today employs roughly 31,000 people and designs the compute engines at the center of the artificial intelligence buildout. The company reports in three segments: Data Center, which sells EPYC server processors and Instinct AI accelerators; Client and Gaming, which sells Ryzen desktop and notebook processors, Radeon graphics and semi-custom console silicon; and Embedded, which carries the Xilinx adaptive computing franchise into industrial, automotive, aerospace, networking and test markets.
Its competitors are the largest names in silicon. Nvidia dominates AI accelerators. Intel remains the incumbent in server and client CPUs. Broadcom, Marvell, Qualcomm and Arm compete for adjacent custom and networking silicon. AMD’s differentiation is that it is the only company shipping leadership x86 server CPUs, high-end AI GPUs, programmable logic and data center networking silicon from one roadmap, and it has now assembled those pieces into a complete rack-scale system rather than selling parts for someone else to integrate. That distinction matters, and it is the heart of this week’s story.
On September 21, 2026, AMD closed at $615.52 and crossed $1 trillion in market capitalization for the first time, finishing the session with a market value of $1.006 trillion. The stock gained 9.9% that day and set a record high of $616.69, capping a rally that has nearly tripled the shares in 2026. AMD is now the fourth United States chipmaker to reach the trillion-dollar mark. That is why the stock is relevant this week: a company that the market treated as a perpetual runner-up has been repriced as a genuine second supplier of AI compute at scale, and it happened fast enough that the fundamental case and the price have to be examined side by side rather than in sequence.
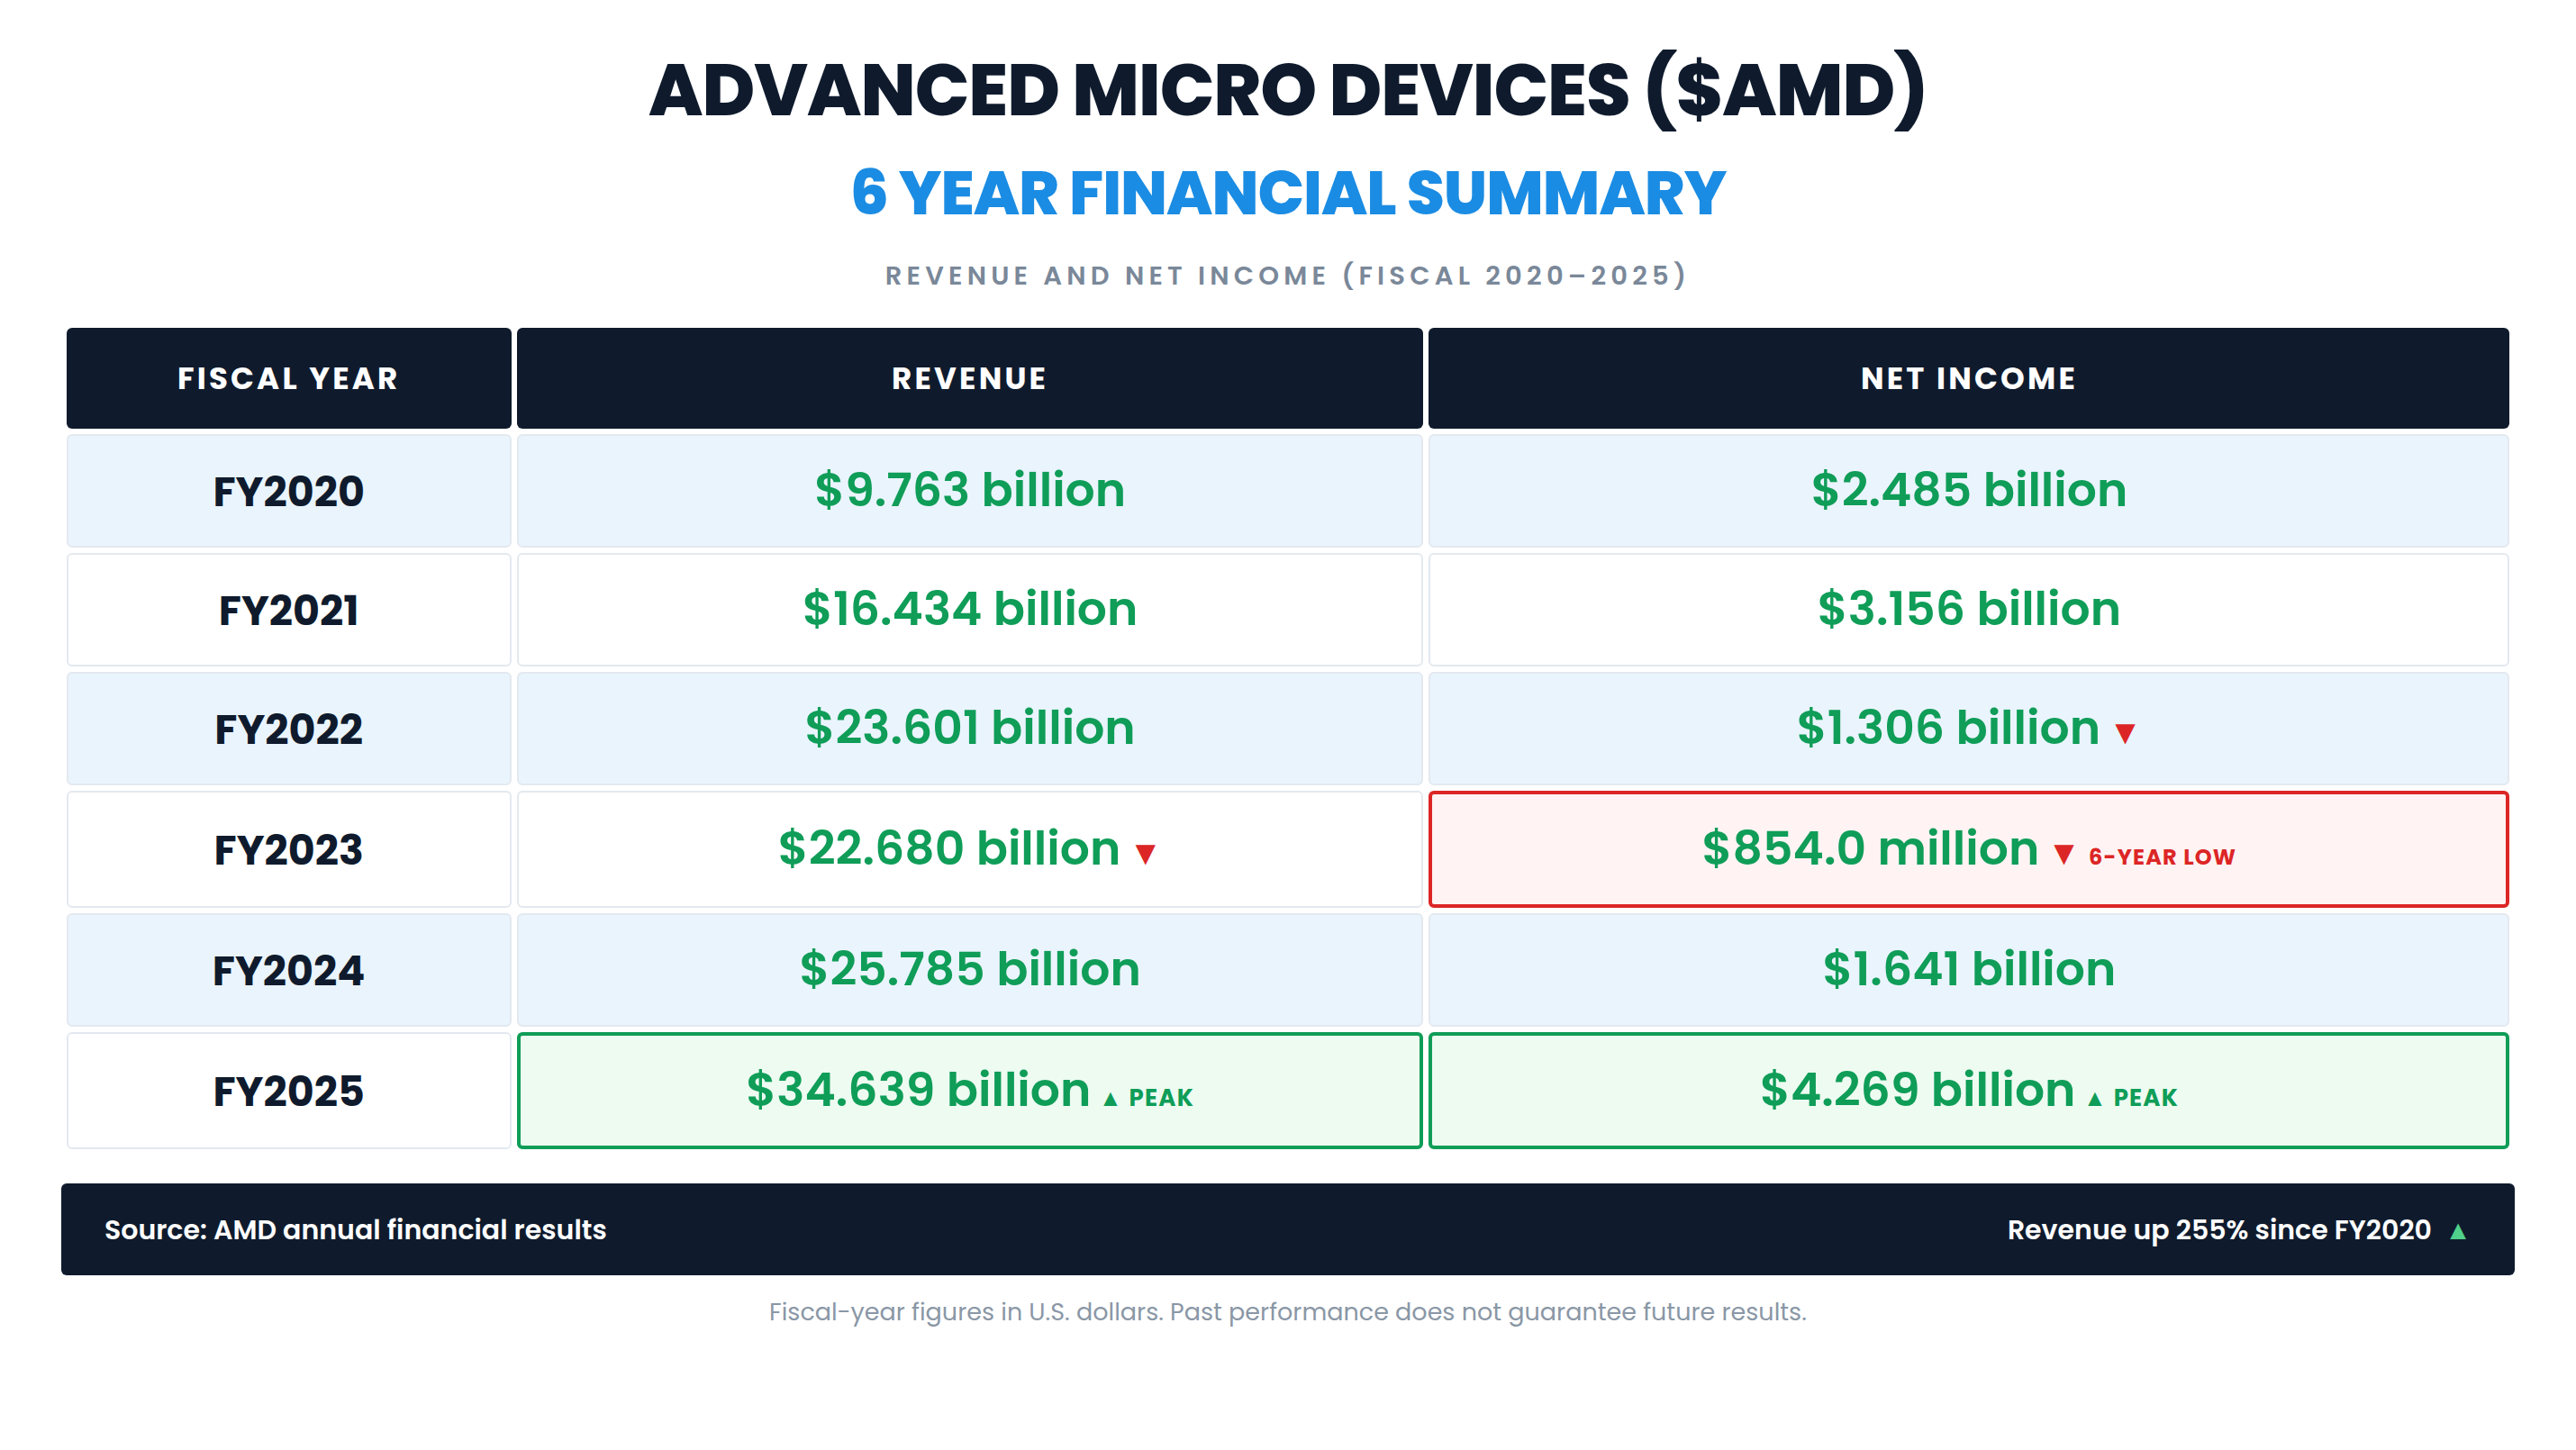
The six-year record shows a revenue arc that almost never stalls and a profitability arc that does. Revenue climbed from $9.763 billion in fiscal 2020 to $16.434 billion in fiscal 2021, $23.601 billion in fiscal 2022, $22.680 billion in fiscal 2023, $25.785 billion in fiscal 2024 and $34.639 billion in fiscal 2025. That is growth of 255% across the period. Net income traveled a rougher road: $2.485 billion in 2020, $3.156 billion in 2021, then a collapse to $1.306 billion in 2022 and $854 million in 2023, before recovering to $1.641 billion in 2024 and $4.269 billion in 2025. Diluted earnings per share tell the same story more bluntly, moving from $2.06 in 2020 to $2.57 in 2021, down to $0.84 and then $0.53, and back up to $1.00 and $2.65.
The profit trough was not an operating failure. It was the cost of transformation. AMD closed the Xilinx acquisition in 2022, which added large amortization of acquired intangibles that crushed reported earnings while revenue kept climbing. At the same time the PC market went through a brutal post-pandemic inventory correction, and gaming console volumes rolled over. So the company was absorbing a mega-deal’s accounting drag at the exact moment two of its consumer-facing end markets contracted. Gross margin, which is the cleanest read on mix, still improved through the period, from 45% in fiscal 2020 to 50% in fiscal 2025. Operating profit followed the same V shape, from $1.369 billion in 2020 to a low of $401 million in 2023 and back to $3.694 billion in 2025.
Here is the number the annual table hides. Fiscal 2025 revenue of $34.639 billion looks like a strong year, and it was. But the second quarter of fiscal 2026 alone, the three months ended June 27, 2026, produced revenue of $11.536 billion. Annualize the most recent quarter and AMD is running at roughly $46 billion, and management has guided the following quarter higher still. The annual table describes a company growing well. The quarterly run rate describes a company whose revenue base has changed shape inside the last four quarters.
The second quarter of 2026, reported on August 4, 2026, is the pivot point. Revenue of $11.536 billion rose 50.1% from $7.685 billion a year earlier. GAAP gross margin was 54%, GAAP operating income was $1.990 billion and GAAP diluted earnings per share were $1.38, up 156% year over year. On a non-GAAP basis, gross margin was 56%, operating income was a record $3.094 billion at a 27% operating margin, net income was $2.760 billion and diluted earnings per share were $1.66. Adjusted EBITDA reached $3.315 billion, a 28.7% margin. Operating cash flow was $2.366 billion against capital expenditures of $808 million, leaving free cash flow of $1.558 billion. Research and development spending was $2.528 billion in the quarter, which is the price of staying on an annual accelerator cadence. Cash and equivalents stood at $13.111 billion, and the company repurchased $207 million of stock. AMD pays no regular dividend and declared no special dividend, so all shareholder return in the period came through buybacks.
The operational driver is not subtle. Data Center revenue was $6.718 billion, up 107% from $3.240 billion a year earlier, and it produced $2.103 billion of segment operating income. Data Center is now 58% of total revenue, up from 42% a year ago. Client and Gaming contributed $3.841 billion, up about 6%, with strength in Ryzen client offset by continued weakness in gaming. Embedded returned to growth at $977 million, up 19%. It is worth noting that the year-ago quarter carried $800 million of inventory and related charges tied to United States export controls on the Instinct MI308 accelerator, which flatters the year-over-year margin comparison. Adjusted for that, comparable non-GAAP gross margin was up more than 200 basis points, driven by Data Center mix.
What the quarter proves is that AMD can convert AI accelerator demand into real margin, not just headline revenue. A 27% non-GAAP operating margin on $11.5 billion of revenue, in a quarter where the highest-value product family was still ramping, is evidence of operating leverage rather than a promise of it. What the quarter does not prove is durability at the new scale. Almost every dollar of incremental Data Center revenue traces back to a small number of very large customers whose own capital spending plans can change, and the flagship products behind the 2027 revenue case were shipping in production volume for the first time in the quarter just ended.
Traders are really asking two questions now. First, does the MI450 and Helios ramp land on schedule and at the gross margins management has described, or does a complex first-generation rack-scale system slip? Second, at 158 times trailing earnings and a trillion-dollar market value, how much of the 2027 and 2028 outcome is already embedded in the price?
The bullish evidence is specific rather than atmospheric. At its Advancing AI event on July 22 and 23, 2026, AMD launched the Instinct MI400 series, including the MI455X for large-scale training and inference and the MI430X for high performance computing and sovereign AI, alongside sixth-generation EPYC “Venice” server CPUs built on TSMC’s 2-nanometer process and the Helios rack-scale platform that connects 72 GPUs in a single scale-up domain with 260 terabytes per second of scale-up bandwidth. Management said in September 2026 that MI450 production shipments began in the third quarter. The customer list attached to that roadmap is unusually concrete: OpenAI agreed in October 2025 to deploy 6 gigawatts of AMD GPUs across multiple generations, with the first gigawatt of MI450 capacity beginning in the second half of 2026; Anthropic agreed to deploy up to 2 gigawatts of MI450 series GPUs in Helios racks with the first gigawatt starting in the first half of 2027; Meta signed for up to 6 gigawatts; Microsoft will deploy Helios on Azure for frontier model inference; Oracle is standing up a 50,000-GPU Helios supercluster; and Hewlett Packard Enterprise said in September 2026 that it will supply Helios trays.
Guidance reflects that pipeline. For the third quarter of 2026 AMD guided to revenue of approximately $13.0 billion plus or minus $300 million, which is roughly 41% year-over-year growth and about 13% sequential growth at the midpoint, with non-GAAP gross margin near 56%, operating expenses around $3.65 billion, a 13% tax rate and a diluted share count of about 1.66 billion. Management expects server CPU revenue to grow more than 80% year over year in the second half of 2026 and more than 70% in 2027, and expects Data Center segment revenue to more than double in 2027. At its Financial Analyst Day in November 2025 the company set a long-term model of greater than 35% revenue compound annual growth, 55% to 58% gross margin, 35% operating margin, roughly 25% free cash flow margin and more than $20 of non-GAAP earnings per share. Lisa Su has since said AMD is tracking materially ahead of that model and expects to significantly exceed the $20 earnings target within its strategic timeframe. Reports in mid-September 2026 that AMD intends to raise prices on select GPUs and CPUs by roughly 10% add a margin lever that was not in the original plan.
That is also where the market could be wrong. The main risk case has three legs. The first is customer concentration and circularity. The OpenAI agreement included a warrant for up to 160 million AMD shares at one cent per share, vesting in tranches tied to deployment milestones, AMD share-price hurdles and OpenAI’s own technical and commercial milestones, exercisable through 2030. That structure aligns incentives, and it also means a very large customer’s purchasing decisions and AMD’s equity value are linked. If AI infrastructure spending decelerates, several of these gigawatt commitments are multi-year intentions rather than firm, ratable orders. The second leg is execution. Helios is AMD’s first full rack-scale system. Rack-scale integration is where liquid cooling, networking, firmware and software all have to work together at once, and the largest deployments are scheduled to ramp from late 2026 through 2027. A one-quarter slip in a product that carries the 2027 revenue case would hit the stock harder than the revenue shortfall alone would justify. The third leg is valuation and sentiment. At $615.52 the stock trades at 158.29 times trailing earnings on trailing earnings per share of $5.76. That multiple only makes arithmetic sense against 2027 and 2028 estimates, which means the stock is priced on execution that has not happened yet. Insiders sold more than $105 million of stock over the last quarter, including sales by President Forrest Norrod on September 15, 2026 and by director Nora Denzel in late May and early June 2026, much of it through scheduled plans, but worth noting at these levels. Export controls remain a live variable: the $800 million MI308 charge a year ago is a reminder that policy can remove a revenue line in a single announcement. Huawei is also emerging as an AI accelerator competitor in markets AMD cannot fully serve.
The near-term catalyst calendar is dense. Third-quarter 2026 results are scheduled for November 3, 2026 at 5:00 p.m. Eastern Time, and that report is the first full quarter with MI450 production shipments in it. Between now and then, traders should watch for Helios shipment confirmations to Microsoft and Oracle, any formal confirmation of the reported 10% price increase, the start of OpenAI Helios operations that the company has pointed toward October 2026, and monthly Taiwan supply-chain data that tends to foreshadow accelerator shipment timing. Any further sell-side target revisions matter more than usual here, because the consensus average target currently sits below the market price.
This setup suits momentum and swing traders who size positions for a stock that has just moved more than 24% in a single week and 9.9% in a single session. It does not suit traders who need a valuation floor to lean on, because there is no defensible floor near current prices, only a growth trajectory. Anyone carrying this position needs a predetermined exit, because a stock capable of a 635% advance is also the same stock that fell 63% between 2024 and 2025.
The early-warning signal to watch is the Data Center gross margin commentary on the November call. AMD’s entire re-rating rests on the idea that AI accelerators at scale are margin-accretive. If management begins describing Helios ramp costs as a temporary margin headwind, or if non-GAAP gross margin guidance drifts below the 56% level, the market will reprice the long-term model before it reprices the revenue line. That single sentence in a guidance paragraph would matter more than a revenue beat.
So the picture heading into this week is a company whose fundamentals have genuinely inflected and a share price that has already rewarded that inflection generously. The trend says stay interested. The volatility says stay alert. With that in mind, here is what the professional analyst community currently expects.
Wall Street Analysts Annual Forecasts
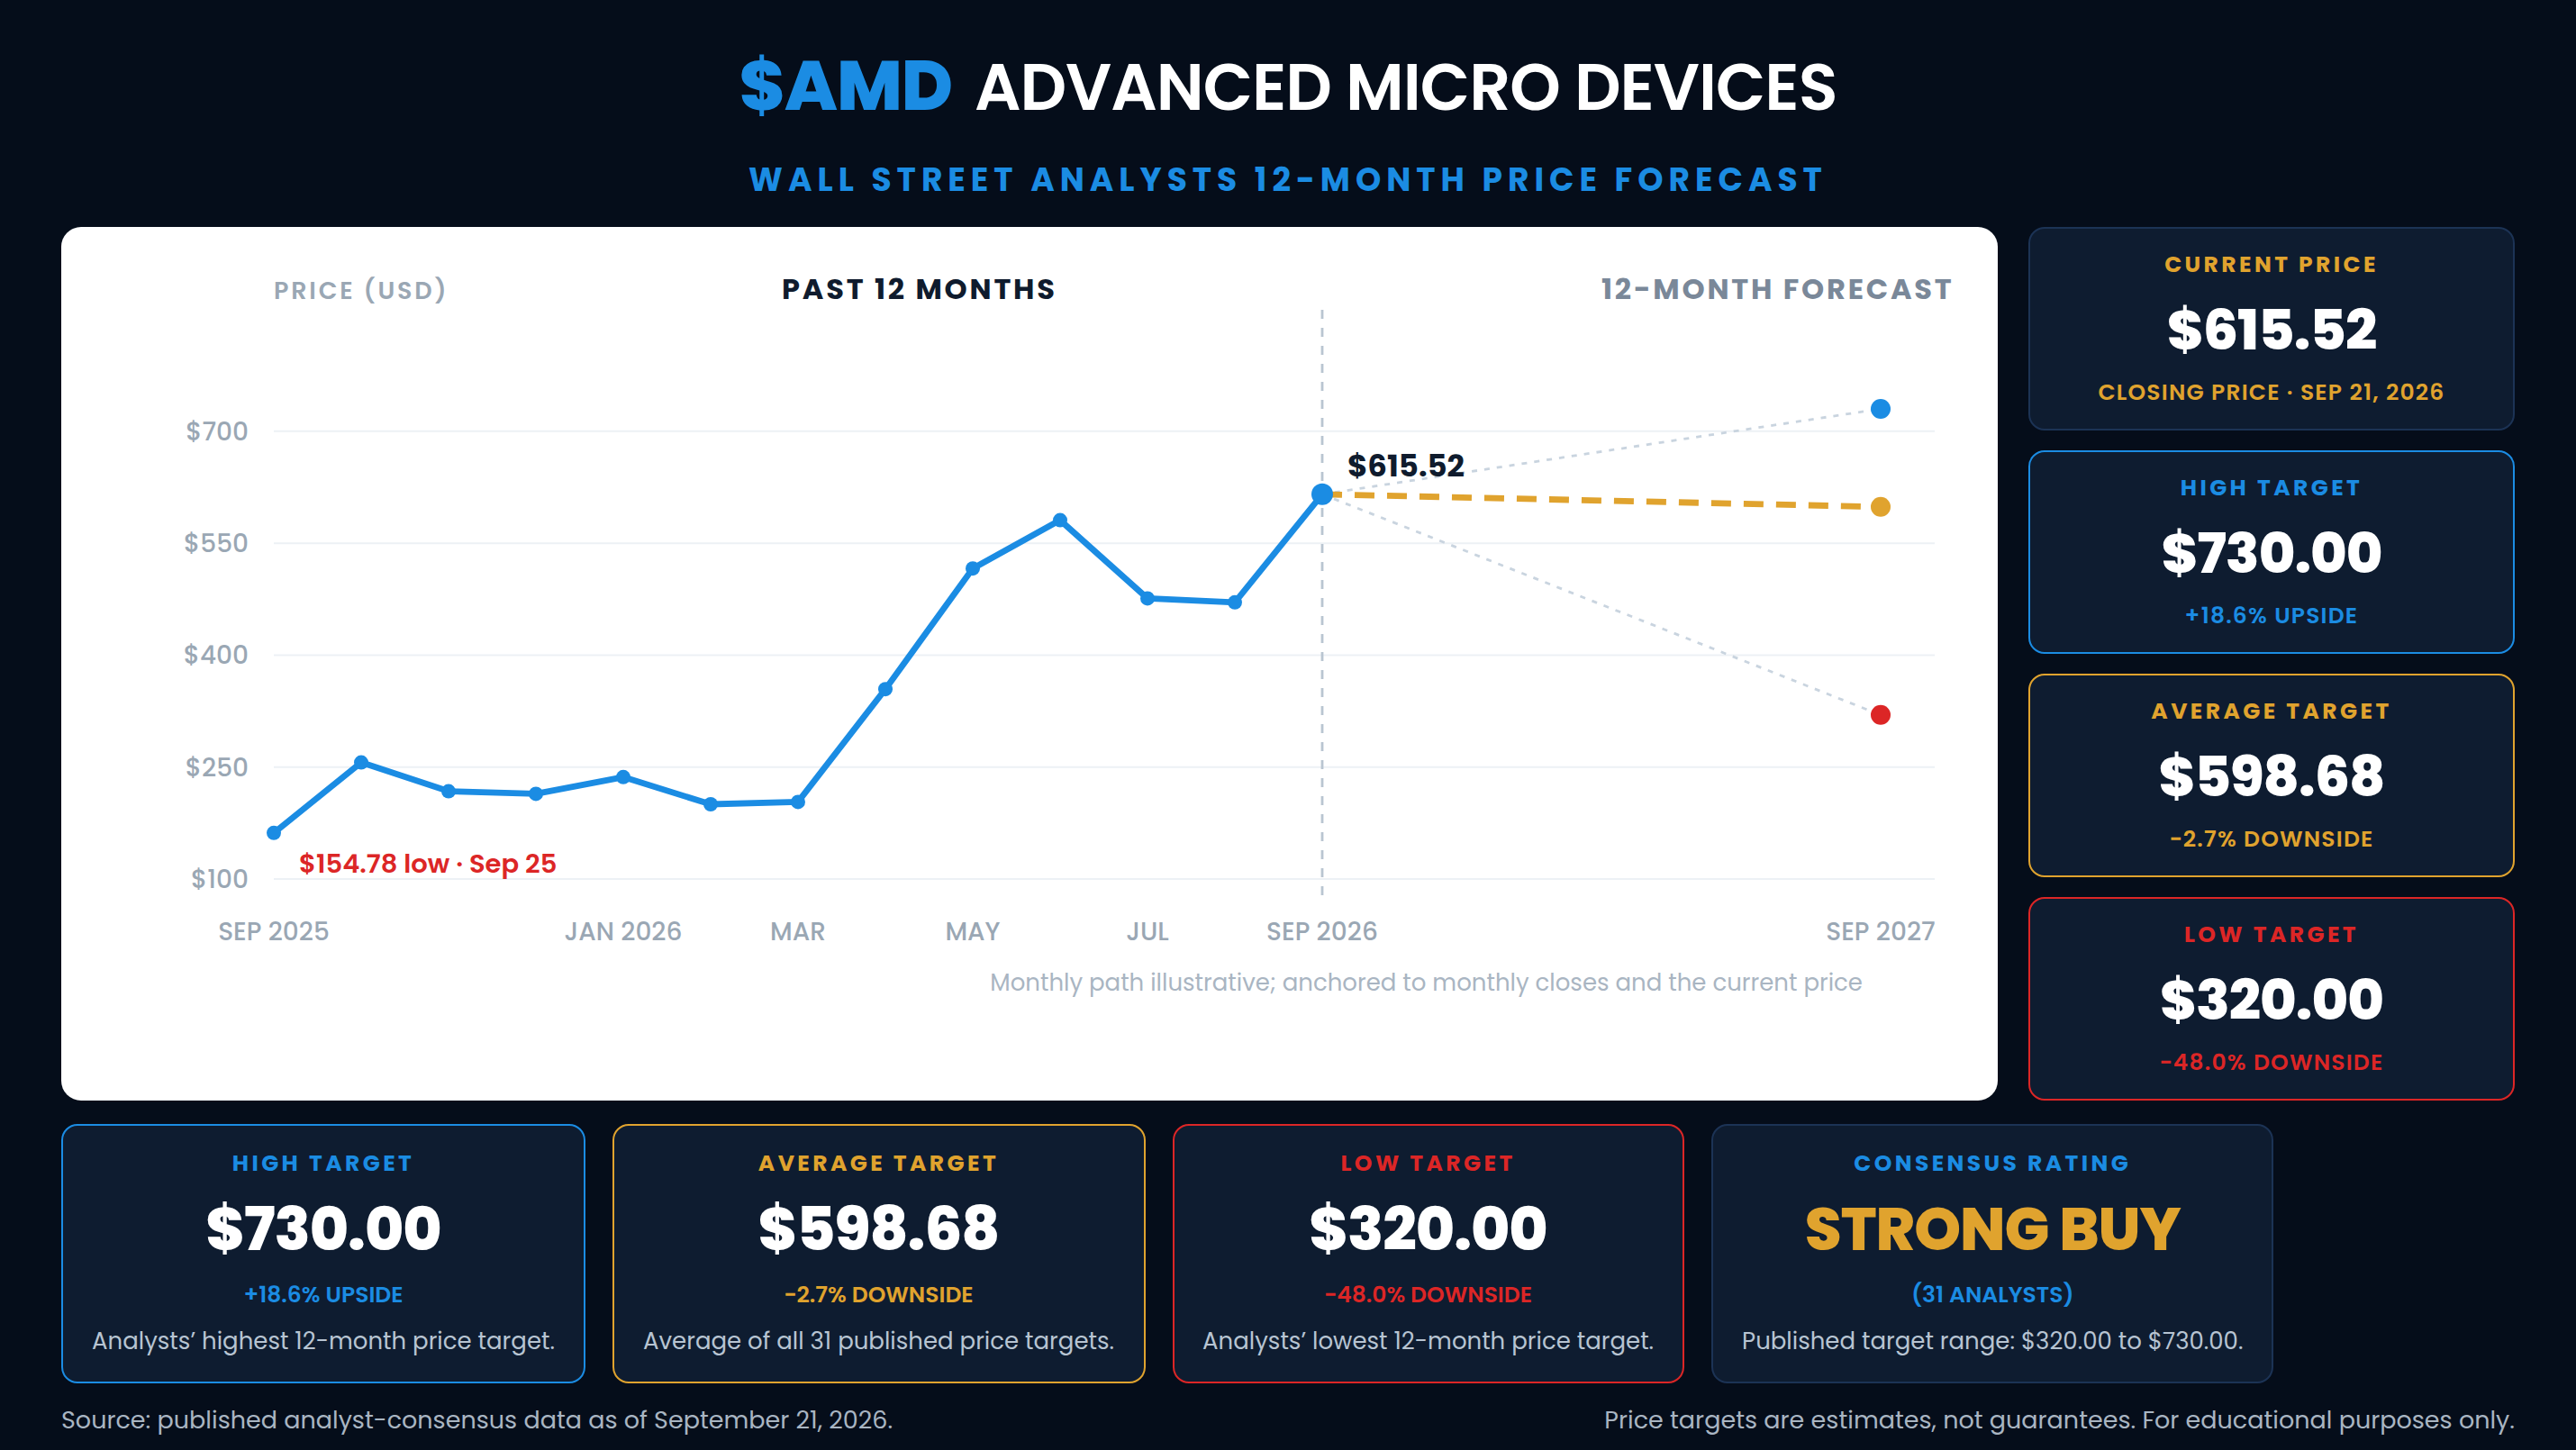
Thirty-one analysts currently cover Advanced Micro Devices, and the consensus rating is Strong Buy, with 26 bullish ratings, 5 neutral ratings and no bearish ratings. The average 12-month price target is $598.68, the median target is $625.00, the high target is $730.00 and the low target is $320.00.
Measured against the September 21, 2026 close of $615.52, the average target implies a 2.74% decline. The median target implies a 1.54% gain. The high target implies a 18.60% gain. The low target implies a 48.01% decline. The spread between the high and low target is $410.00, which is 66.61% of the current share price.
Read that carefully, because it’s unusual. The consensus rating is the most bullish category available, and yet the average price target sits below the market price. That combination happens when a stock advances faster than analysts revise their models. The revision trail makes it obvious: Raymond James upgraded AMD to Strong Buy on August 25, 2026 and raised its target to $641 from $565, Rosenblatt moved to $700 on August 6, 2026, Argus Research went to $625 from $450 on the same day, Goldman Sachs moved to $640 from $450 on July 6, 2026, and Stifel went to $635 from $450 on July 10, 2026. As recently as May 2026, targets in the $455 to $478 range were being published as bullish. Northland Capital Markets is still carrying a $320 target with a Market Perform rating. The average is a blend of models updated at wildly different points in a fast-moving story.
The practical takeaway for a trader is that the published consensus provides no cushion at these levels, and a meaningful portion of the analyst community has not yet incorporated the September move. Price targets are estimates of what a security might be worth over a twelve-month horizon under a set of assumptions. They are not guarantees, and the $410 spread between the highest and lowest target is an honest measure of how wide the range of credible outcomes is for this business right now.
52-Week High and Low Boundaries Analysis
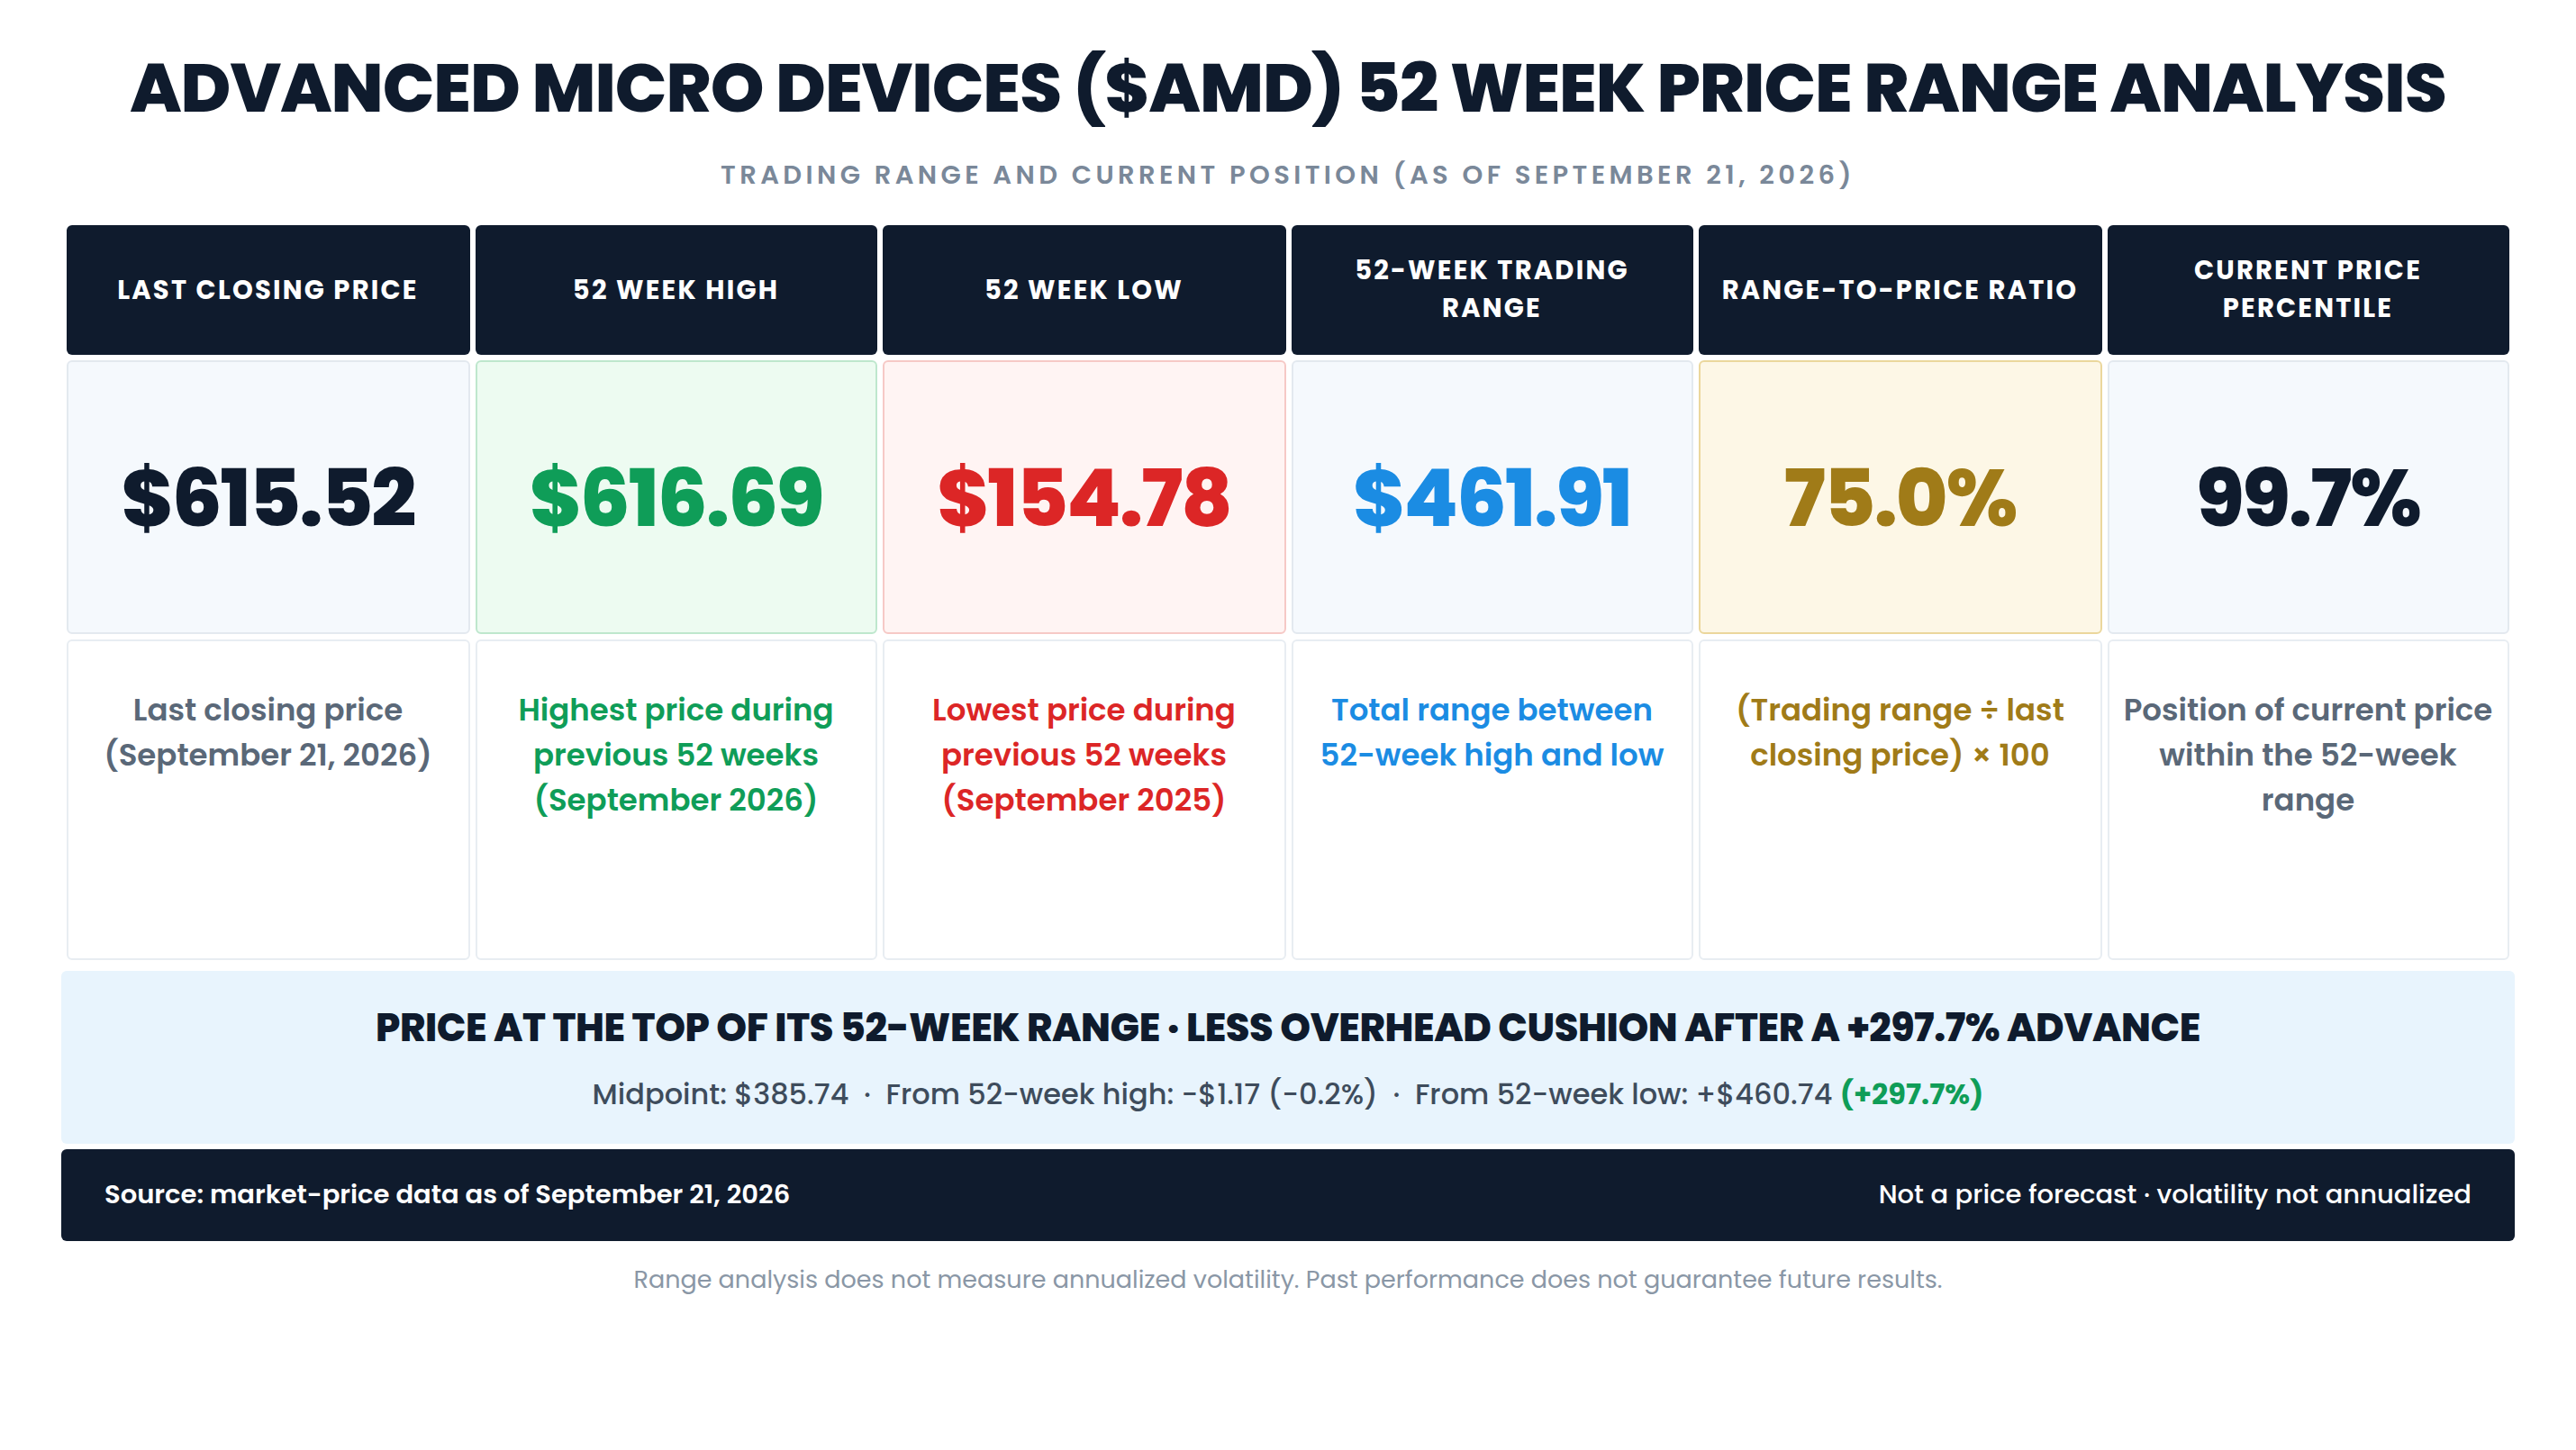
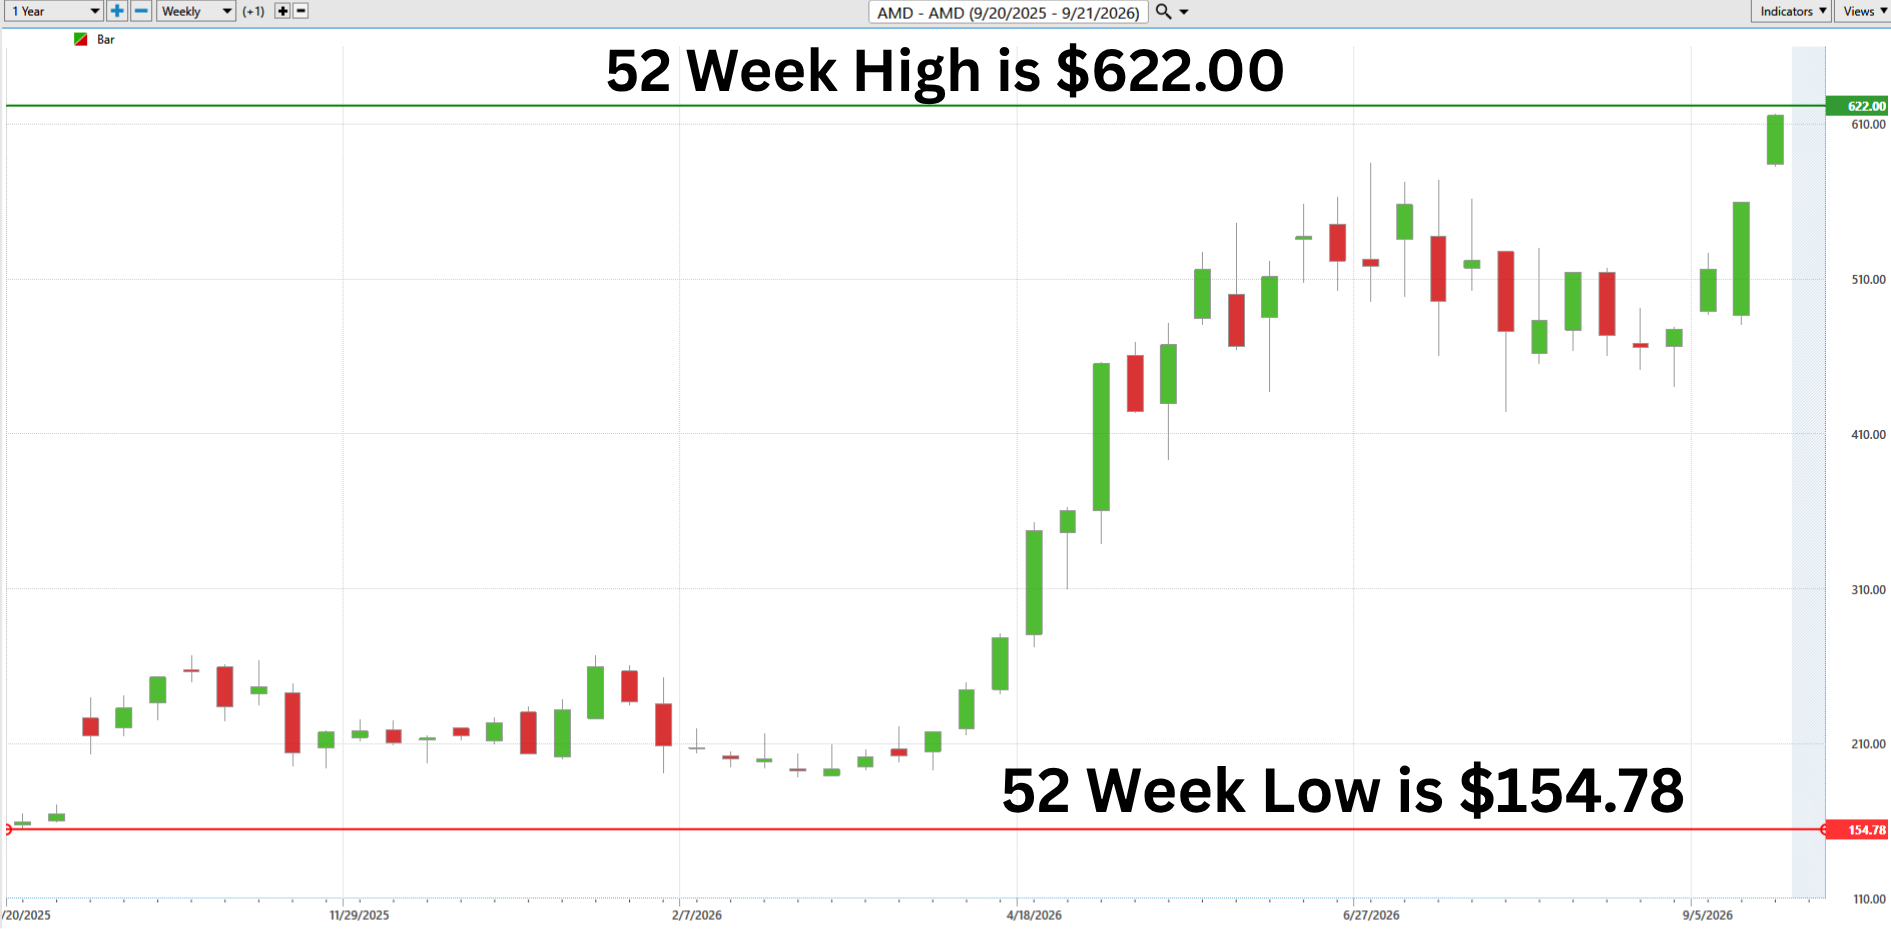
AMD’s 52-week low is $154.78, set on September 25, 2025. Its 52-week high is $616.69, set on September 21, 2026, the same session in which the stock closed at $615.52.
The arithmetic of that range is worth stating precisely. The 52-week range is $461.91 wide. Against the current price of $615.52, that range equals 75.04% of the share price, which is an extraordinary figure for a trillion-dollar company and tells you immediately that AMD trades with the volatility profile of a mid-cap growth name rather than a mega-cap. The current price sits at the 99.75th percentile of the 52-week range. The midpoint of the range is $385.74, and the stock is trading 59.57% above that midpoint. The distance from the close to the 52-week high is 0.19%.
There is no overhead resistance from the last twelve months, because there is no prior price above here. That is the cleanest technical condition a trend trader can ask for, and it is simultaneously the most dangerous one for a late entrant. When a stock is at the very top of its range, every holder is profitable, which removes the supply that normally comes from trapped buyers wanting to break even. It also means the first sustained decline has no recent shelf of prior trading to catch it. The nearest structural reference points below the market are the $537 area where the stock traded in June 2026 and the $473 level from late August 2026.
Position sizing is the honest response to a 75% range-to-price ratio. A stock that has traveled $461.91 in twelve months can retrace a hundred dollars without invalidating anything about the underlying business. Traders who size as though AMD moves like a typical trillion-dollar company will be forced out of good positions by ordinary noise.
Best-Case/Worst-Case Analysis
The best-case study begins at the April 4, 2025 low of $83.67, struck during the tariff-driven market decline and at the depth of skepticism about AMD’s AI accelerator prospects. From there to the September 21, 2026 close of $615.52, the stock advanced 635.65% in roughly seventeen months.
The recent best-case move is nearly as striking. From the March 6, 2026 low of $191.25 to the September 21, 2026 close of $615.52, AMD gained 221.84% in a little over six months. Compressing the window further, the stock rose 24.75% in the single week ending September 21, 2026.
The worst-case study is the mirror image, and it is recent enough that no one should treat it as ancient history. From the March 8, 2024 high of $227.30 to the April 4, 2025 low of $83.67, AMD declined 63.19% over approximately thirteen months. The cause was a combination of factors that had nothing to do with the company going bankrupt and everything to do with expectations: AMD’s early AI accelerator revenue came in below the numbers embedded in the 2024 price, Nvidia’s competitive lead widened in the market’s estimation, the MI308 export restriction removed a China revenue line, and the broad 2025 correction in high-multiple technology took the rest. An earlier episode was worse. From the November 2021 high of $158.10 to the October 2022 low of $55.71, the stock fell 64.76% as the PC market corrected and Xilinx amortization compressed reported earnings.
Historical gains are not forecasts. Historical losses are not predictions. What these figures establish is the stock’s demonstrated capacity for movement in both directions: two separate drawdowns of more than 60% inside five years, and a 635% advance inside seventeen months. That is the real distribution a trader is underwriting, and it is the reason position sizing and a written exit plan matter more here than any opinion about the AI cycle.
The bull case stays alive as long as three conditions hold. Data Center revenue keeps compounding at triple-digit or high double-digit year-over-year rates. Non-GAAP gross margin holds at or above the 56% level management guided for the third quarter. And the MI450 and Helios deployments with OpenAI, Anthropic, Meta, Microsoft and Oracle move from announced capacity to recognized revenue on the stated timeline.
The thesis weakens on specific, observable changes of character. A Data Center sequential growth deceleration into the single digits would break the core narrative. Gross margin guidance drifting below 56% would signal that scale is costing more than expected. A publicly disclosed slip in Helios shipment timing, a customer reducing or restructuring a gigawatt commitment, or a new export control affecting the MI400 family would each attack the 2027 revenue base directly. Technically, a failure to hold the June 2026 shelf near $537 after making a new high, or a sharp expansion in daily range on declining prices, would mark the change of character that matters more than any single headline.
Relative Strength Comparison
Relative strength measures whether a stock is leading or lagging the broad market. All figures below are calculated through the close on September 21, 2026 using the same cut-off date for every instrument.
This is not a one-catalyst outperformance, and it is not a short-lived momentum burst either. AMD has beaten all four benchmarks over every single measurement window, from one week to one year, and the margin of victory is not close in any of them. Over the past year the stock returned roughly eighteen times the S&P 500. That pattern defines a multi-period market leader rather than a recent inflection.
The internal structure of the table is where the useful detail lives. Notice that the three-month outperformance is the narrowest of the five periods, at 14.54% against 3.52% for the S&P 500. Then look at the past month and the latest week, where AMD gained 30.06% and 24.75% while the Dow and the Russell 2000 were negative. What that sequence describes is a stock that consolidated through the early summer and then accelerated violently in September, with the great majority of the monthly gain concentrated in the final week. Leadership is real, but the most recent leg is steep and narrow, and the divergence from the Russell 2000 and the Dow shows the money is rotating into a specific theme rather than into equities broadly.
Outperformance is not permanence. A stock that outruns its benchmark by 269 percentage points over twelve months has also built in an expectation of continued outperformance, and that expectation is exactly what a disappointing quarter removes. Leadership tells you where the money is going today. It does not tell you how long the money stays.
VantagePoint AI Predictive Blue Line
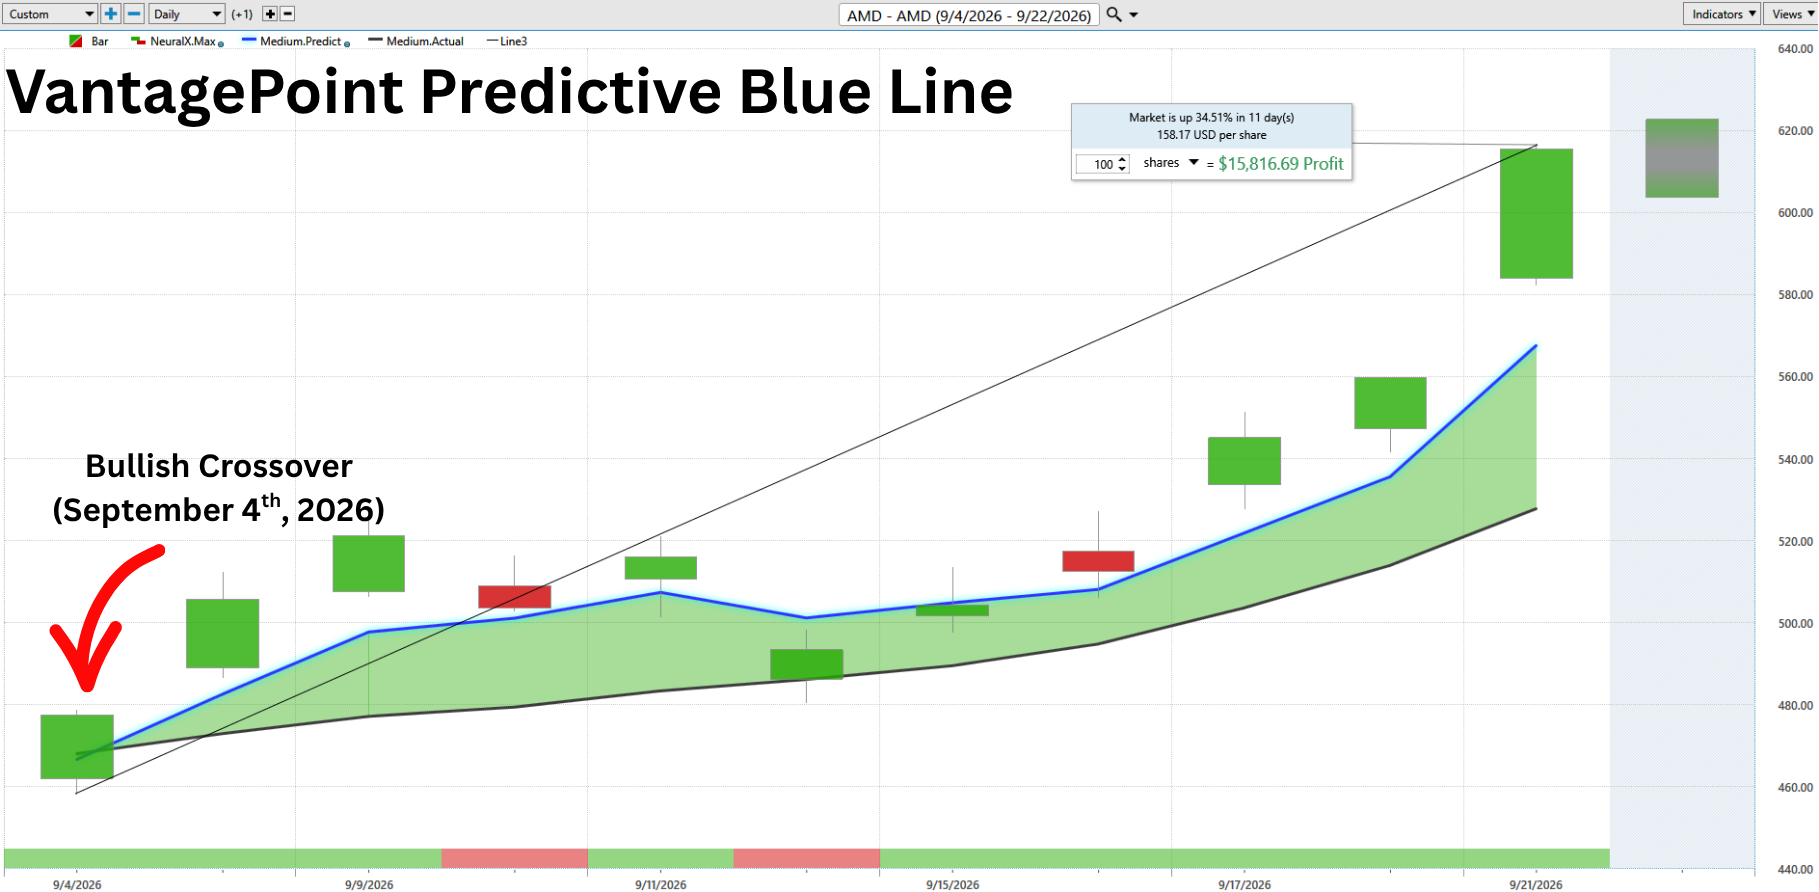
The Predictive Blue Line is the core of the VantagePoint platform. It is not a lagging moving average drawn from past prices. It is generated by neural networks that process intermarket data from dozens of related global markets to forecast the direction of the short-term trend and the value zone where a trader should look to establish a position. When the Predictive Blue Line crosses above the black actual simple moving average, VantagePoint is forecasting a bullish shift in trend direction. When it crosses below, it is forecasting bearish trend direction. The slope of the blue line quantifies the strength of the forecast, and pullbacks to the blue line mark the value zone in an uptrend.
The chart above covers September 4 through September 22, 2026 on a daily basis, and the reading is unambiguous. The Predictive Blue Line sits above the black actual moving average for the entire period shown, and the space between them is shaded green from the first bar to the last. There is no bearish crossover anywhere in the window. The blue line’s slope is positive throughout and steepens into the final two sessions, which is the platform’s way of saying the forecast is not merely up but accelerating.
The platform’s own measurement on this chart shows the market up 34.51% in 11 days, worth $158.17 per share, which on a 100-share position equals $15,816.69.
What gives the alert its credibility is how the two pullbacks inside the window behaved. On September 10 the stock closed at $503.60 after closing at $521.10 the prior session, and on September 14 it closed at $493.41 after $516.13. Both were genuine down days, and both pulled price back toward the lower portion of the band near the black actual line. On neither occasion did the Predictive Blue Line roll over. It flattened, held above the black line, and then turned higher. That is the textbook value-zone behavior VantagePoint users look for: the forecast holds its direction while price comes back to a better entry.
What followed was five consecutive higher closes, from $504.20 on September 15 to $615.52 on September 21, a gain of 22.08% in five sessions. The trend interpretation from this indicator remains bullish, and it stays bullish until the blue line crosses back below the black actual moving average. That is the condition to watch, not a price level and not a headline.
VantagePoint AI Neural Index
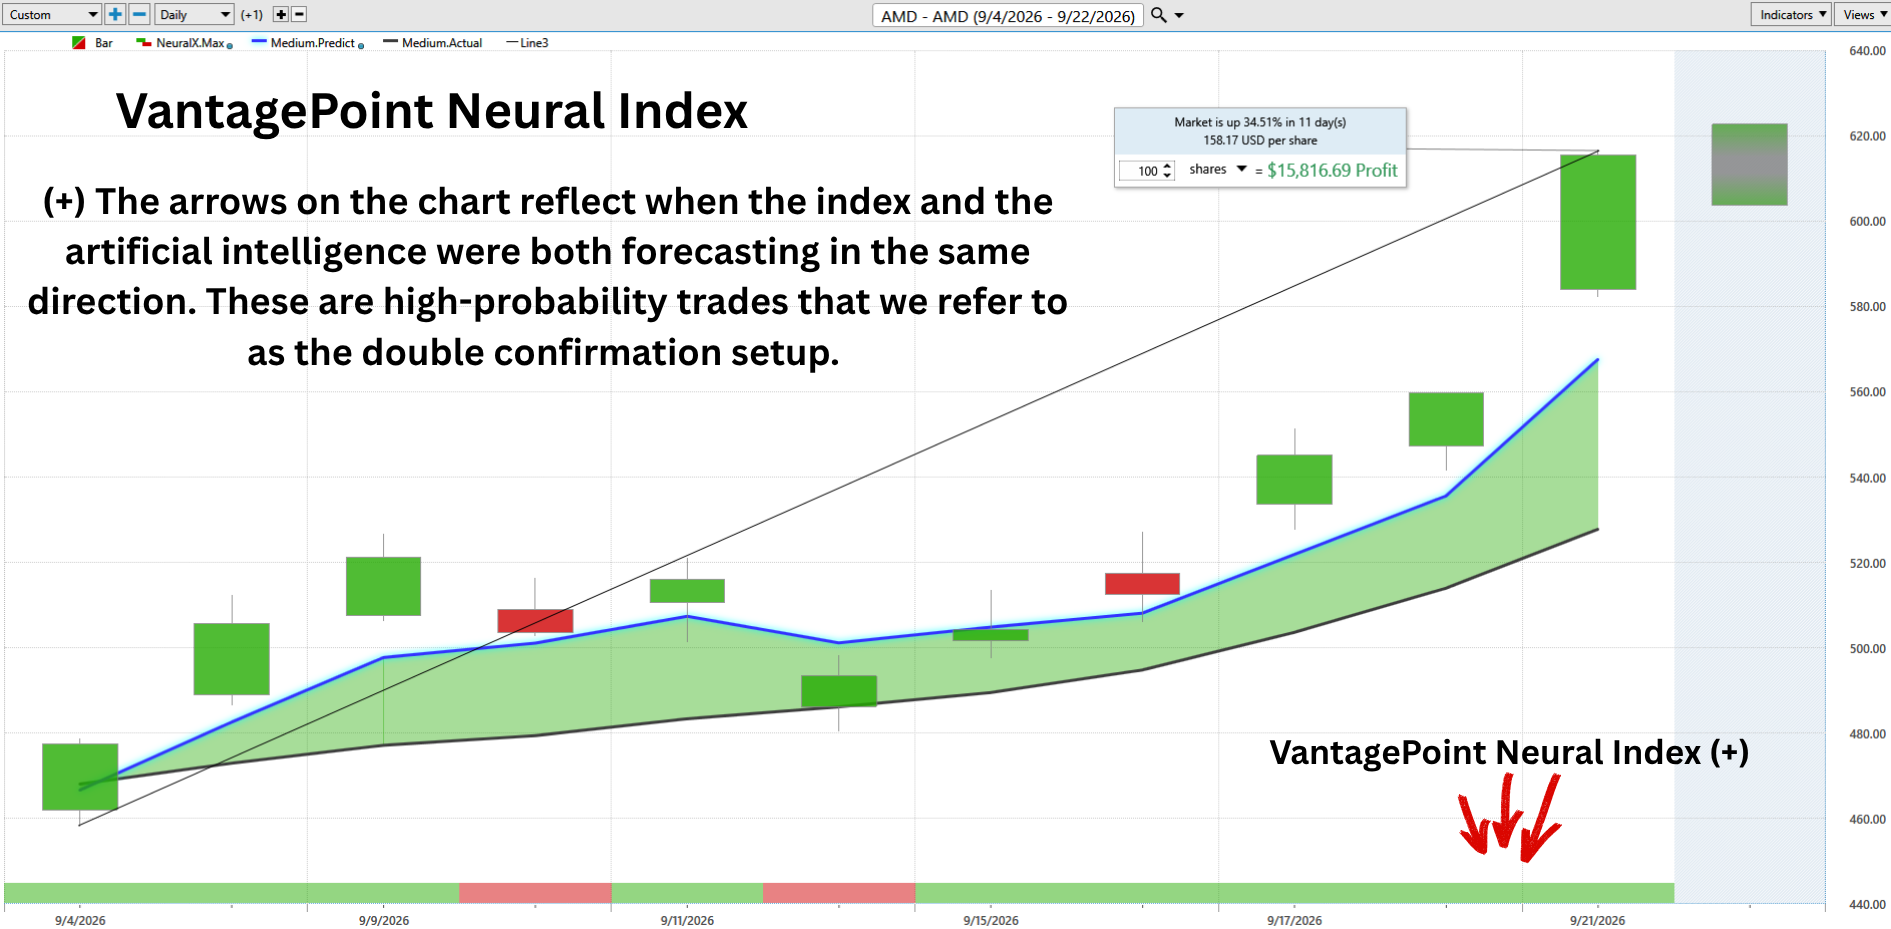
The VantagePoint Neural Index is a short-term strength and weakness indicator with a 48-hour forecast horizon. It aggregates the output of the platform’s neural networks into a single reading. A green reading forecasts short-term strength, a yellow reading signals caution and advises traders to wait, and a red reading signals high caution and short-term weakness. Traders use the Neural Index as a filter on the trend forecast: when the Predictive Blue Line is rising and the Neural Index is green, the two are in agreement, and when they conflict the correct response is patience rather than a position.
The Neural Index strip runs along the bottom of the Predictive Blue Line chart above. Beginning September 4, 2026 and running through September 21, 2026, the platform posted 11 daily readings: 9 green, 2 red high-caution, and no yellow caution readings at all.
Both red readings did exactly what the indicator is designed to do. The first appeared on September 10, and that session closed at $503.60 against the prior close of $521.10. The second appeared on September 14, and that session closed at $493.41 against the prior close of $516.13. Two high-caution signals, two down days. Neither one turned into a trend reversal, which is the point of a 48-hour forecast horizon: the Neural Index was flagging near-term weakness inside an intact uptrend, not calling the top.
The current green streak began on September 15 and has now produced 5 consecutive green readings, through September 21. Over the full 11-session window the stock moved from a close of $477.57 on September 4 to $615.52 on September 21, a gain of 28.89%.
The present configuration has the Predictive Blue Line rising above the black actual moving average and the Neural Index green. The two indicators agree, and agreement is the condition traders wait for. The caution is equally clear: a green streak of this length in a stock that has just gained 24.75% in a week means the easy part of the signal is behind the market, and the first yellow or red reading after a run like this deserves more respect than the two that came earlier in the month.
VantagePoint AI Daily Range Forecast
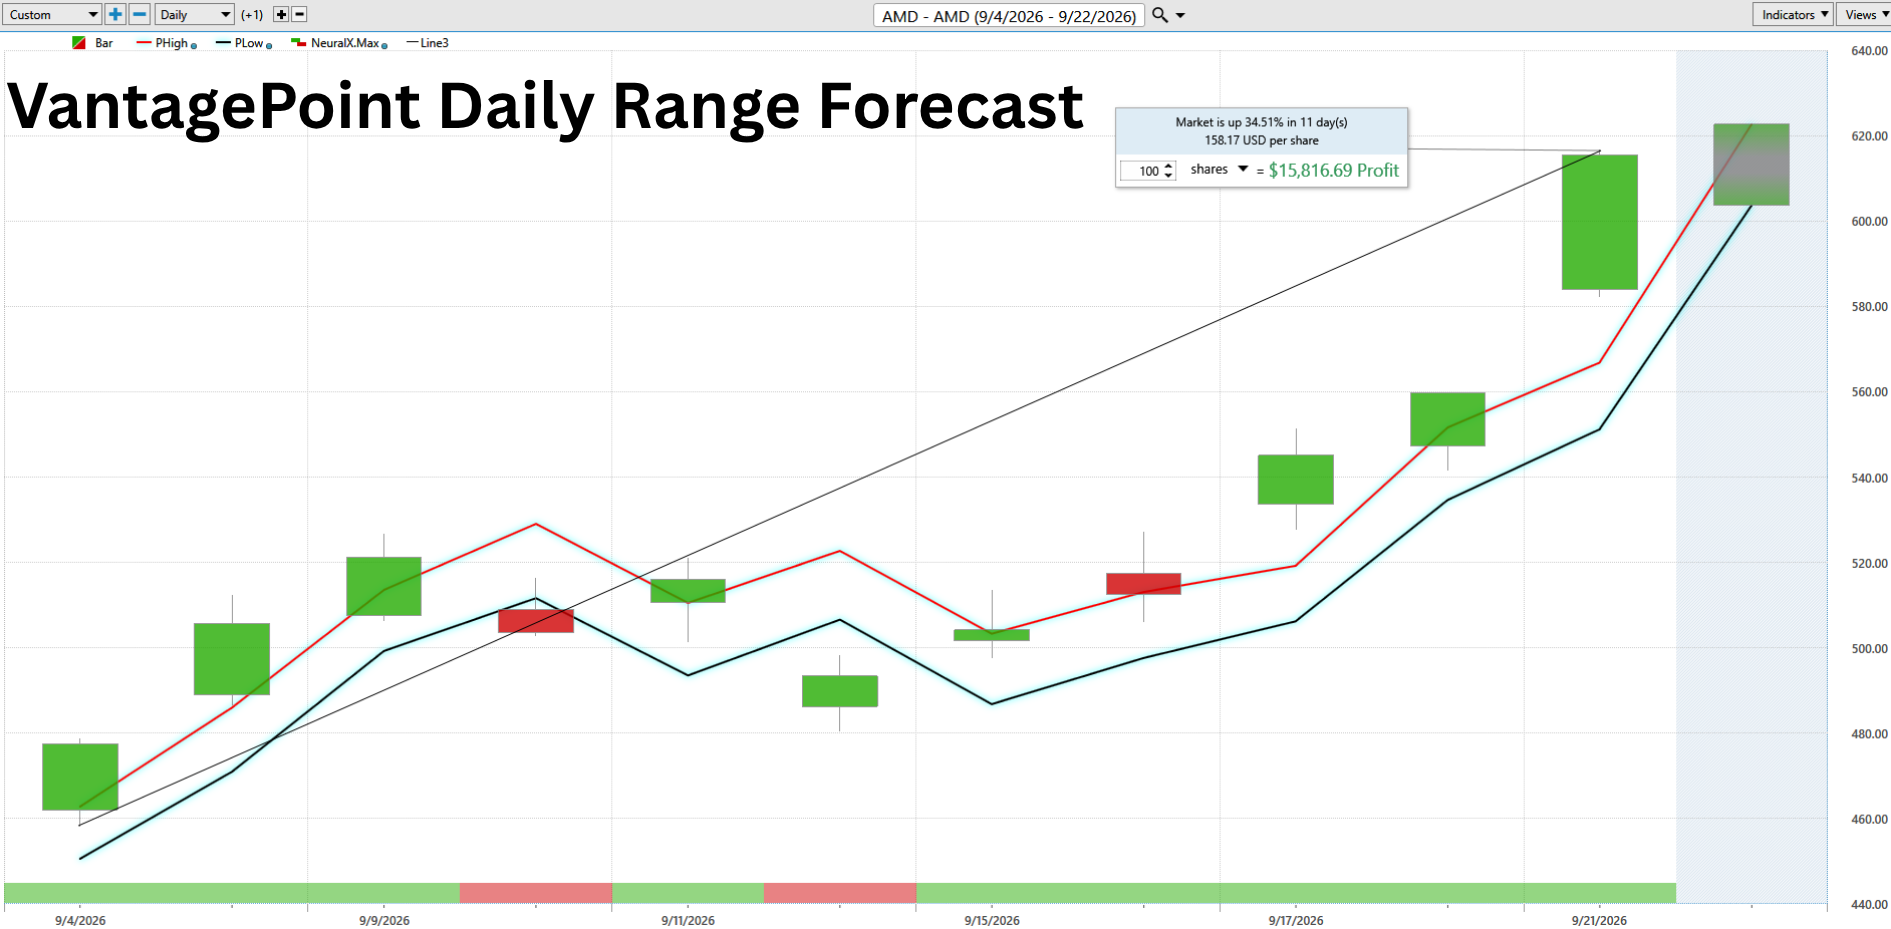
The VantagePoint Daily Range Forecast is the execution tool. Each trading day, before the open, it projects the expected high and low boundaries for the session, giving traders defined levels for entries, exits and stop placement rather than reactive decisions made intraday. Paired with the average daily, weekly and monthly range percentages, it allows a trader to size positions to the instrument’s actual volatility. For a stock with a 52-week range equal to 75.04% of its share price, that discipline is not optional.
The chart above plots the predicted high boundary in red and the predicted low boundary in dark blue across September 4 through September 22, 2026. Both boundaries are rising, and both are rising more steeply at the right edge of the chart than anywhere else in the window. Into the current session the plotted band reads near $608 on the upper boundary and near $598 on the lower boundary, which is the steepest single-session advance in the boundaries across the entire period shown.
The execution lesson is in how price interacted with those lines. From September 8 through September 18 the daily bars tracked the band closely, with session highs turning back near the predicted high and session lows finding support near the predicted low. That is the environment the Daily Range Forecast is built for, where a trader can place entries near the lower boundary and take profits near the upper one.
Then came September 21. The stock opened at $583.88, above the entire prior session’s range, and closed at $615.52 after touching $616.69. The predicted high boundary for that session sat near $566. Price did not merely test the upper boundary, it opened above it and never came back. That is the signature of a range-expansion event rather than a normal trending day, and it is the most important execution detail in this report: on days like that the forecast band is not a profit target, it is evidence that something has changed in the demand for the stock.
The realized volatility over these 11 sessions backs that up. The average daily range, measured as each session’s high minus its low against that session’s close, ran 4.01%. For a trillion-dollar company that is an enormous figure, and it is why the range discipline matters here. A trader sizing an AMD position as though a 1% daily move is normal will be stopped out by an ordinary Tuesday. Both boundaries rising is a bullish configuration, but rising boundaries also widen the band, and a wider band means a stop placed at yesterday’s distance is now too close.
Intermarket Analysis
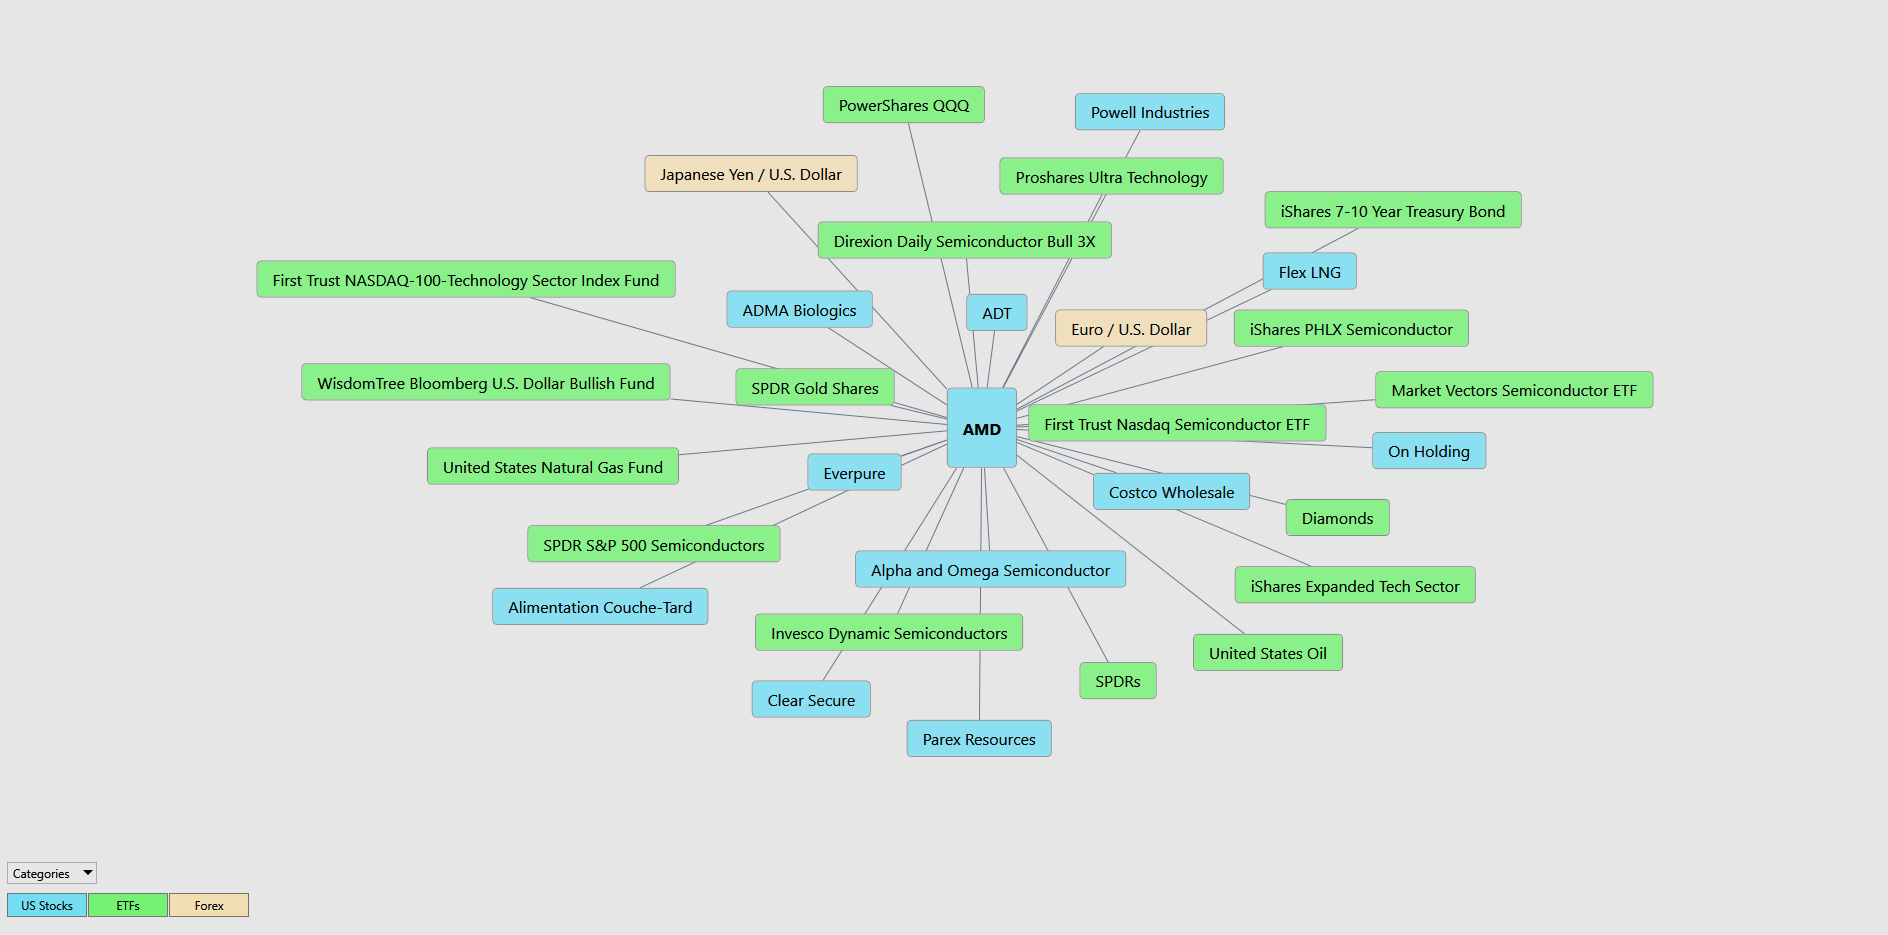
The intermarket map for AMD displays three categories of related markets.
The US stock relationships shown are Powell Industries, ADMA Biologics, ADT, Flex LNG, On Holding, Costco Wholesale, Alpha and Omega Semiconductor, Everpure, Clear Secure, Parex Resources and Alimentation Couche-Tard.
The exchange-traded fund relationships shown are PowerShares QQQ, ProShares Ultra Technology, Direxion Daily Semiconductor Bull 3X, First Trust NASDAQ-100 Technology Sector Index Fund, iShares PHLX Semiconductor, Market Vectors Semiconductor ETF, First Trust Nasdaq Semiconductor ETF, SPDR S&P 500 Semiconductors, Invesco Dynamic Semiconductors, iShares Expanded Tech Sector, SPDRs, Diamonds, iShares 7-10 Year Treasury Bond, WisdomTree Bloomberg U.S. Dollar Bullish Fund, SPDR Gold Shares, United States Oil and United States Natural Gas Fund.
The forex relationships shown are the Japanese Yen versus the U.S. Dollar and the Euro versus the U.S. Dollar.
Read as an ecosystem, this map explains what is actually driving the stock. The heaviest concentration by far is semiconductor exposure, with six separate chip-sector funds plus a triple-leveraged semiconductor vehicle among the strongest relationships. That tells a trader something uncomfortable and useful at the same time: a large share of AMD’s daily movement is sector beta rather than company-specific news. When the Philadelphia semiconductor complex moves, AMD moves more, which is precisely what happened during the three-session chip rebound in mid-September.
The broad technology and index funds, including PowerShares QQQ, ProShares Ultra Technology and the NASDAQ-100 technology fund, add the second layer: AMD is also a proxy for large-cap technology risk appetite generally. Commodity exposure enters through SPDR Gold Shares, United States Oil and the United States Natural Gas Fund, which is less about AMD’s inputs than about the energy cost and inflation backdrop that AI data centers now sit inside. The iShares 7-10 Year Treasury Bond fund is the fixed-income relationship, and it is the one to respect most. AMD’s valuation is a long-duration asset, so the discount rate applied to earnings several years out matters, and intermediate Treasury yields set that rate. The two currency relationships, yen and euro against the dollar, together with the dollar bullish fund, capture the Asian manufacturing supply chain and the global dollar liquidity conditions that semiconductor demand depends on. No cryptocurrency relationships appear on the map.
The practical conclusion is that a trader watching only AMD headlines is watching the smaller half of the story. The semiconductor complex and intermediate Treasury yields will tell you more about tomorrow’s session than any single company announcement.
 Our Suggestion
AMD has done something rare. It has converted a long-running narrative about being the credible alternative in AI compute into reported financial results. Revenue of $11.536 billion in the second quarter of 2026, up 50.1% year over year, with Data Center revenue up 107% to $6.718 billion, a record 27% non-GAAP operating margin and guidance for approximately $13.0 billion in the third quarter is telling a convincing story about a business that has already changed. The customer roster attached to the MI450 and Helios roadmap, spanning OpenAI, Anthropic, Meta, Microsoft and Oracle, gives the 2027 revenue case more visibility than AMD has ever had at this point in a product cycle, and management now says it is tracking materially ahead of the long-term model it published less than a year ago.
The market has noticed. The stock is up 285.21% over the past year and 187.41% year to date, it closed at the 99.75th percentile of its 52-week range, it trades at 158.29 times trailing earnings, and its market capitalization crossed $1 trillion for the first time on September 21, 2026. The consensus average price target of $598.68 sits 2.74% below the market price, which means the published sell-side view is currently a step behind the tape rather than ahead of it. Momentum is not safety. A stock that gained 24.75% in one week can give a meaningful portion of that back just as quickly, and AMD has twice fallen more than 60% in the past five years.
The VantagePoint AI indicators are aligned with the trend rather than fighting it. The Predictive Blue Line has held above the black actual moving average through the entire period studied, its slope is positive and steepening, and the two pullbacks on September 10 and September 14 produced value-zone behavior rather than a reversal. The Neural Index has posted 9 green readings against 2 red across 11 sessions, with 5 consecutive green readings since September 15. The Daily Range Forecast has both boundaries rising. Our interpretation remains bullish, and the primary trend stays bullish until the indicators say otherwise. What the indicators cannot do is make a 4.01% average daily range smaller, or put a floor under a stock trading at the very top of its 52-week range.
The biggest risk is that the story is wearing a convincing disguise. Everything about the fundamental case is verifiable and improving, which makes it easy to stop asking what price already reflects. The upside opportunity is substantial but contingent, and the contingency is specific: Helios has to ship on time, at the guided gross margin, to customers whose own spending plans hold. That is the trade in one sentence: AMD is a confirmed AI infrastructure leader trading at a price that requires flawless execution through 2027, which makes it a trend to respect with a plan and a stop rather than a valuation to buy and forget.
For traders, the framework is straightforward. Treat the trend as intact until the indicators say otherwise. Let the VantagePoint Predictive Blue Line and Neural Index define the direction and timing rather than the headlines. Use the Daily Range Forecast to help you place your entries, exits and stops at levels that respect how far this stock actually travels in a session.
The November 3, 2026 earnings report is the next real test. Everything between now and then is positioning.
Practice great money management on every trade, and use the VantagePoint AI Daily Range Forecast to identify short-term trading opportunities while keeping risk firmly under control.
It’s not magic.
It’s machine learning.
Disclaimer: THERE IS A HIGH DEGREE OF RISK INVOLVED IN TRADING. IT IS NOT PRUDENT OR ADVISABLE TO MAKE TRADING DECISIONS THAT ARE BEYOND YOUR FINANCIAL MEANS OR INVOLVE TRADING CAPITAL THAT YOU ARE NOT WILLING AND CAPABLE OF LOSING.
EXAMPLES ARE SUCCESS STORIES AND ATYPICAL. PAST RESULTS DO NOT GUARANTEE FUTURE PERFORMANCE.
VANTAGEPOINT’S MARKETING CAMPAIGNS, OF ANY KIND, DO NOT CONSTITUTE TRADING ADVICE OR AN ENDORSEMENT OR RECOMMENDATION BY VANTAGEPOINT AI OR ANY ASSOCIATED AFFILIATES OF ANY TRADING METHODS, PROGRAMS, SYSTEMS OR ROUTINES. VANTAGEPOINT’S PERSONNEL ARE NOT LICENSED BROKERS OR ADVISORS AND DO NOT OFFER TRADING ADVICE.