





Hot Stock Snapshot: Ross Stores ($ROST)
Ross Stores is one of those companies Wall Street loves to ignore until the stock makes another new high. It began in 1982 with a simple idea: buy quality merchandise that other retailers couldn’t sell and offer it at prices shoppers couldn’t resist. That straightforward strategy grew into one of America’s largest off-price retail chains, operating nearly 2,300 stores and employing more than 110,000 people. Today, Ross is more than a discount retailer. It is one of the best gauges of consumer behavior in America because when shoppers become more careful with their money, Ross often becomes busier. That is one reason traders pay close attention to the stock.
Ross makes money the old-fashioned way. It buys excess inventory from manufacturers and retailers that ordered too much or guessed wrong about what customers wanted. Then it sells those same name-brand products at prices well below traditional department stores. Ross Dress for Less generates most of the company’s revenue, while dd’s DISCOUNTS serves even more value-conscious shoppers. Headquarters remain in Dublin, California, under CEO Jim Conroy. Its biggest competitors are TJX, Burlington, Walmart, and discount departments inside larger retailers.
Every trip to Ross feels like a treasure hunt. One visit might uncover a pair of Nike shoes, the next a designer jacket or kitchen gadget selling for half the usual price. That constantly changing inventory is not a weakness. It is the product. Amazon can deliver almost anything tomorrow, but it cannot recreate the excitement of finding something unexpected today. That experience keeps customers returning because every visit feels different.
Wall Street often calls Ross a discount retailer, but that misses the point. Ross is not selling cheap merchandise. It is selling value. Customers believe they are getting far more than they paid for, and that feeling creates loyalty. Even shoppers with higher incomes have been visiting more frequently because saving money never goes out of style.
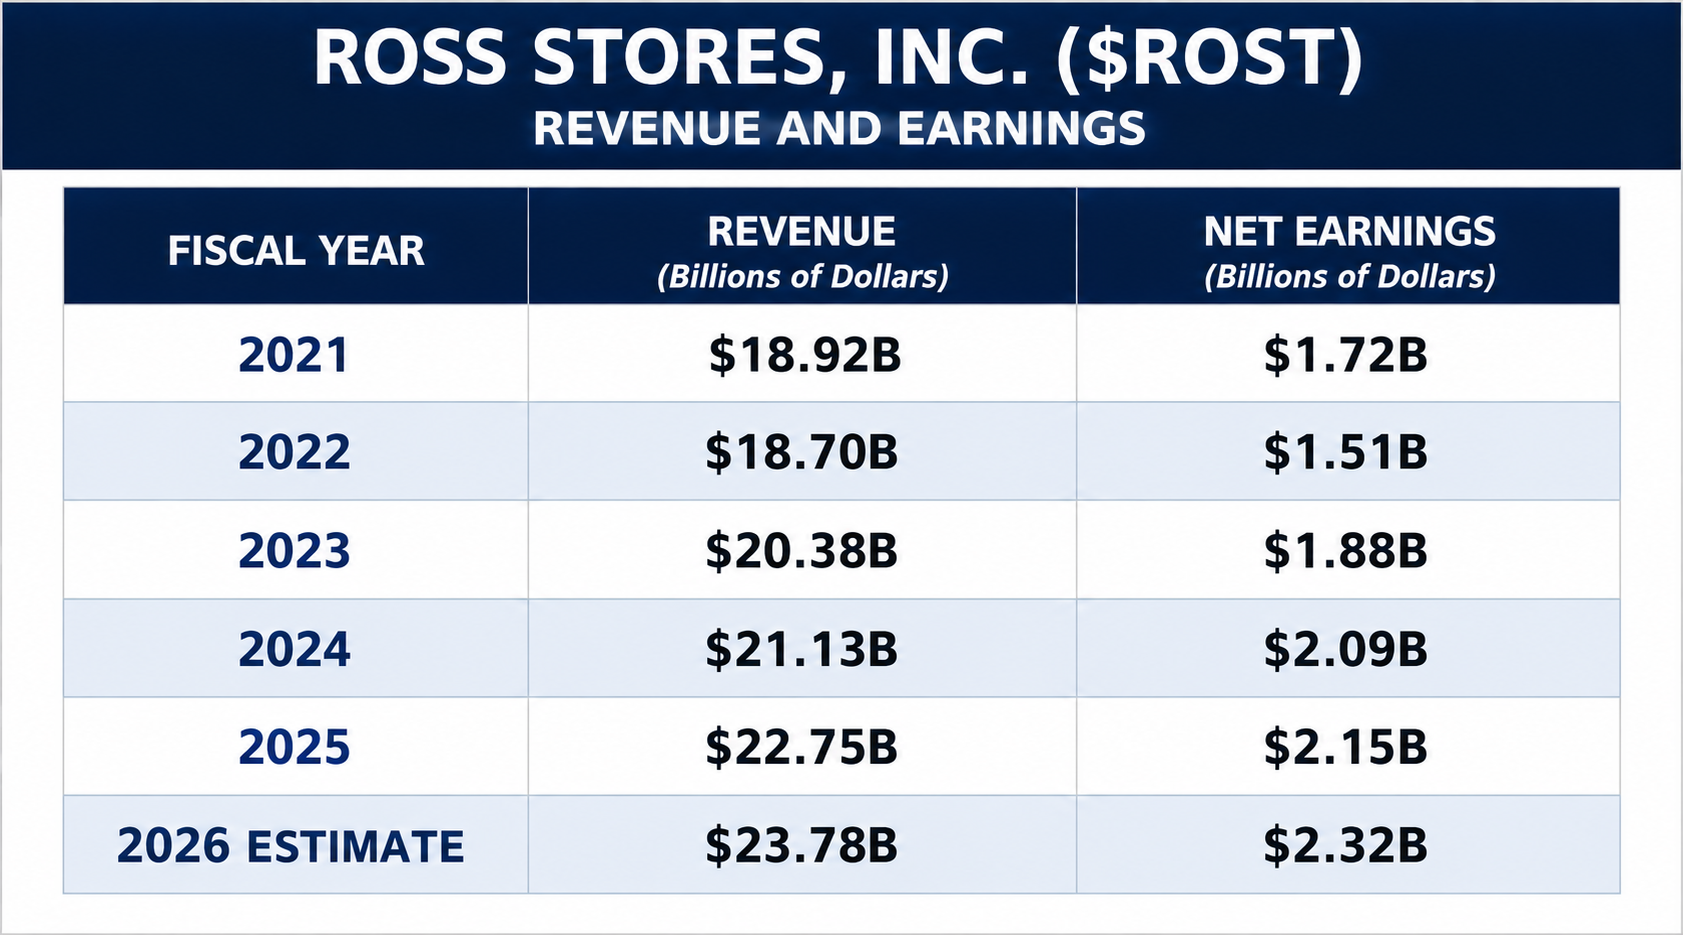
Financially, Ross continues to separate itself from much of retail. Revenue has climbed from approximately $18.9 billion in fiscal 2021 to roughly $22.8 billion in fiscal 2025, while net earnings increased from approximately $1.7 billion to $2.2 billion. Cash generation remains strong, debt is modest, and the business requires relatively little capital because suppliers effectively help finance much of the inventory cycle. Many traders assume discount retailers earn thin profits. Ross proves the opposite. Careful buying creates healthy margins, strong cash flow, and a remarkably resilient business.
Revenue and Earnings Analysis
The biggest question traders are asking is whether this remarkable growth can continue. Ross recently reported a stunning 17% increase in comparable store sales, dramatically outperforming TJX and Burlington, which each grew about 6% during the same period. More impressive, the biggest driver was not higher prices. More people walked into the stores, and they bought more items once they got there. When both customer traffic and average purchases rise together, traders pay attention because that usually signals genuine demand rather than temporary inflation.
The other question is valuation. Ross has become a wonderful business, but wonderful businesses do not automatically become wonderful investments. The stock has rallied because nearly every important operating metric improved at the same time. Revenue accelerated. Customer traffic surged. Average basket size increased. Operating margins expanded. Earnings exceeded expectations. Management raised guidance. That combination is exactly what institutional investors want to see. The challenge is that Wall Street now expects excellence every quarter. Good results may no longer be good enough.
The past several months have reinforced Ross’s leadership position. Management raised full-year guidance after reporting outstanding quarterly results, and analysts responded by lifting earnings estimates and price targets. Yet many analysts continue to describe Ross as merely benefiting from cautious consumers. That explanation is incomplete. Ross is also taking market share because management is simply executing better than many competitors.
One of the great ironies of retail is that Ross often becomes stronger when other retailers make mistakes. When department stores overestimate demand or manufacturers produce too much inventory, someone has to buy the leftovers. Ross happily volunteers. Retail chaos creates buying opportunities for Ross, allowing it to stock desirable brands at attractive prices while competitors struggle with markdowns.
The opportunity is clear. If customer traffic continues growing, margins remain healthy, and management keeps opening profitable stores, earnings estimates will likely continue moving higher. The biggest upside surprise would be another year of exceptional comparable sales growth that forces Wall Street to underestimate the company’s earnings power once again.
The biggest risk is equally clear. Expectations have become very high. Rising tariffs, weaker consumer spending, supply chain disruptions, or fewer inventory buying opportunities could pressure margins. More importantly, if customer traffic begins slowing, the market will likely notice long before the headlines explain why.
The next major catalyst is the fiscal second-quarter earnings release in late August 2026. Traders will focus on comparable store sales, customer traffic, operating margins, and management’s outlook. Third-quarter earnings follow in November, while holiday sales updates in December will provide an early reading on the most important shopping season of the year.
Ross is best suited for momentum traders and investors who respect companies making new highs for the right reasons. The trend remains healthy as long as four numbers continue improving together: customer traffic, comparable store sales, operating margins, and forward guidance. Ignore the daily headlines. Watch those four numbers. If they continue moving higher, Ross likely remains one of retail’s strongest leaders. If they begin to weaken, the stock will probably figure it out before everyone else does.
52-Week High and Low Analysis
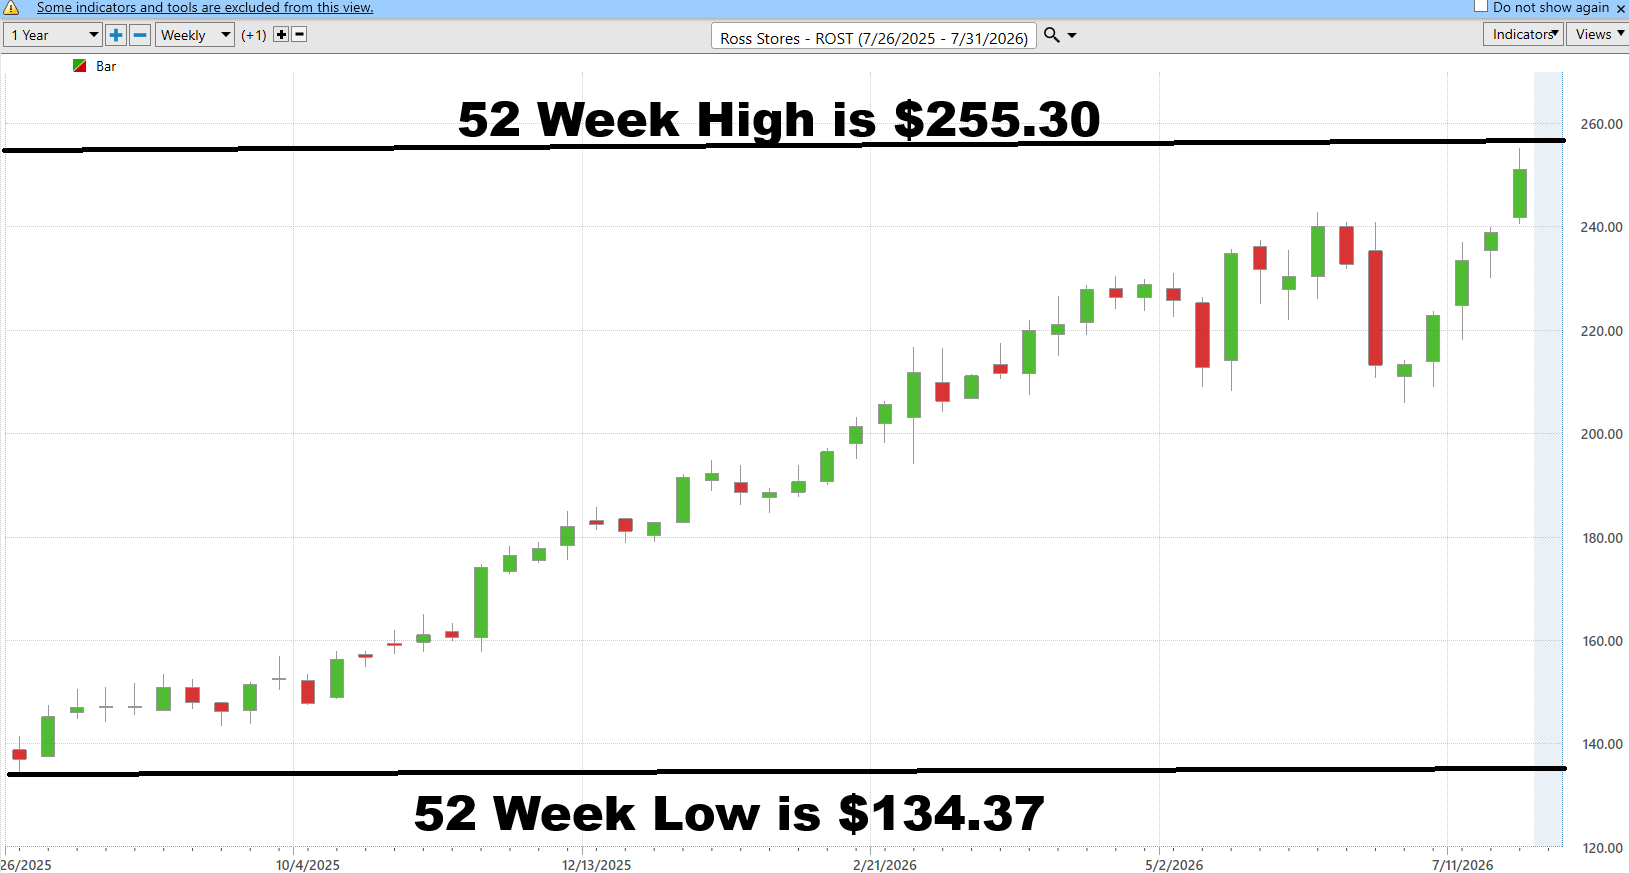
The 52-week boundaries chart reinforces that lesson. Ross has climbed from a 52-week low of $134.37 to challenge a 52-week high of $255.30, nearly doubling in value while repeatedly recovering from meaningful corrections. Stocks do not spend long periods making new highs by accident. New highs signal that buyers continue overwhelming sellers, forcing anyone waiting for lower prices to reconsider their decision. Contrary to popular belief, new highs are often signs of strength rather than danger. Great companies frequently look expensive because the market continually raises its opinion of their future earnings power. Until proven otherwise, a stock pressing against its 52-week high deserves respect, not skepticism.
Best-Case Scenario
One of the most misunderstood concepts in trading is volatility. Many people think of it as a statistic buried inside a spreadsheet. In reality, volatility is simply motion, and motion is where opportunity lives. Ross Stores has rewarded disciplined traders with exceptional gains, but it has also demanded discipline along the way. The best-case and worst-case charts tell the complete story.
Over the past year, the stock delivered rallies of 71.5%, 15.9%, and 24.3%.
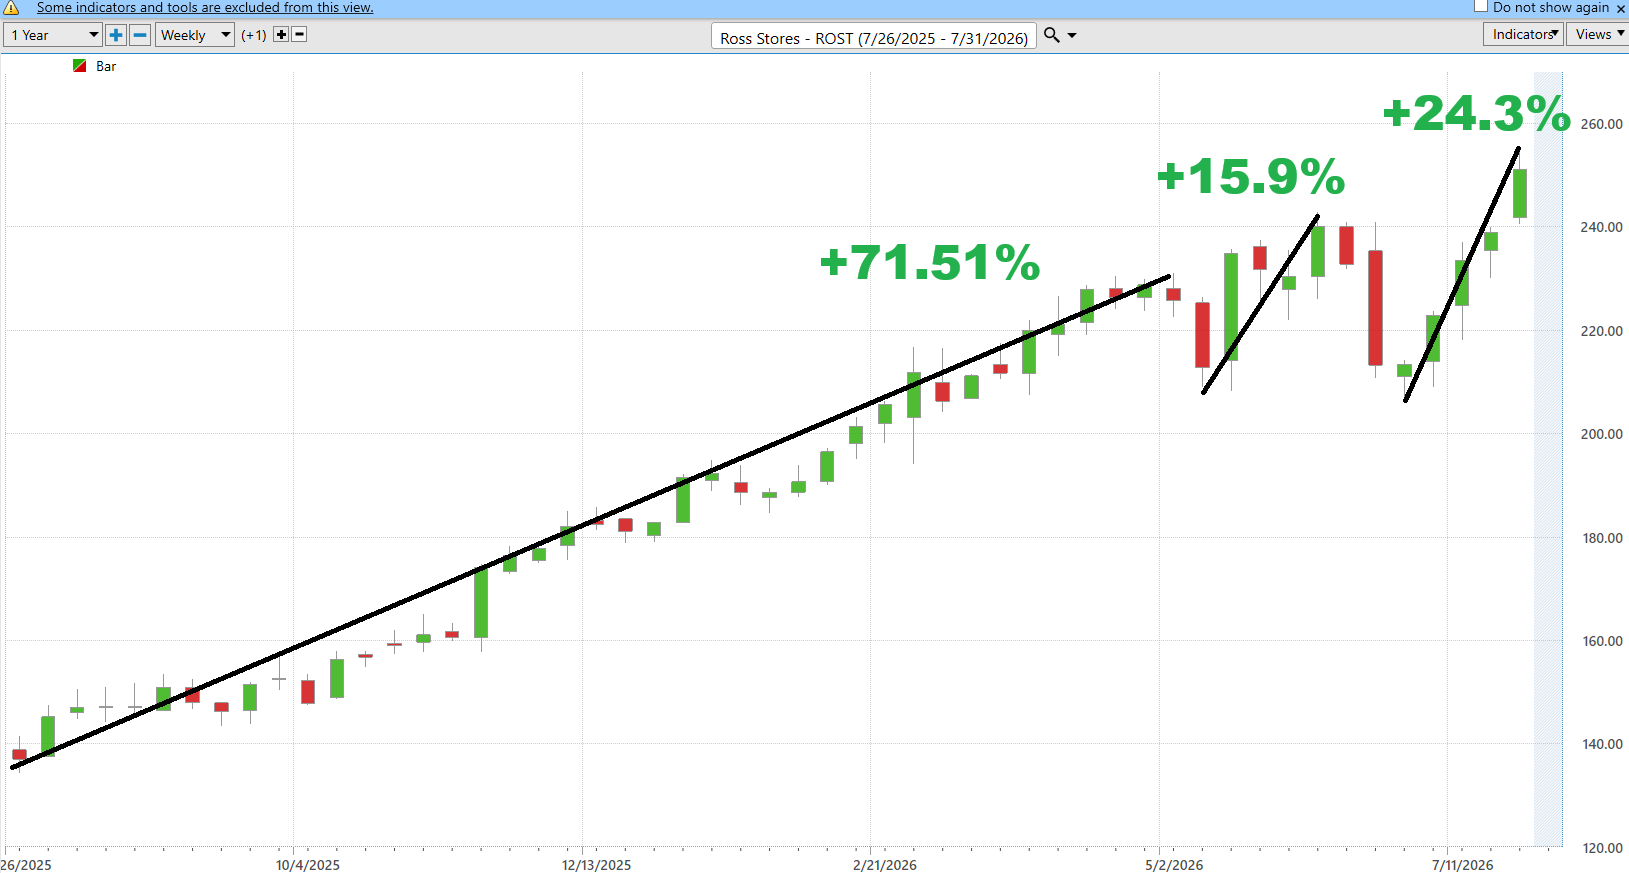
Yet those advances were interrupted by pullbacks of 9.4% and 15.2%. That is not a contradiction. It is exactly how healthy bull markets behave.
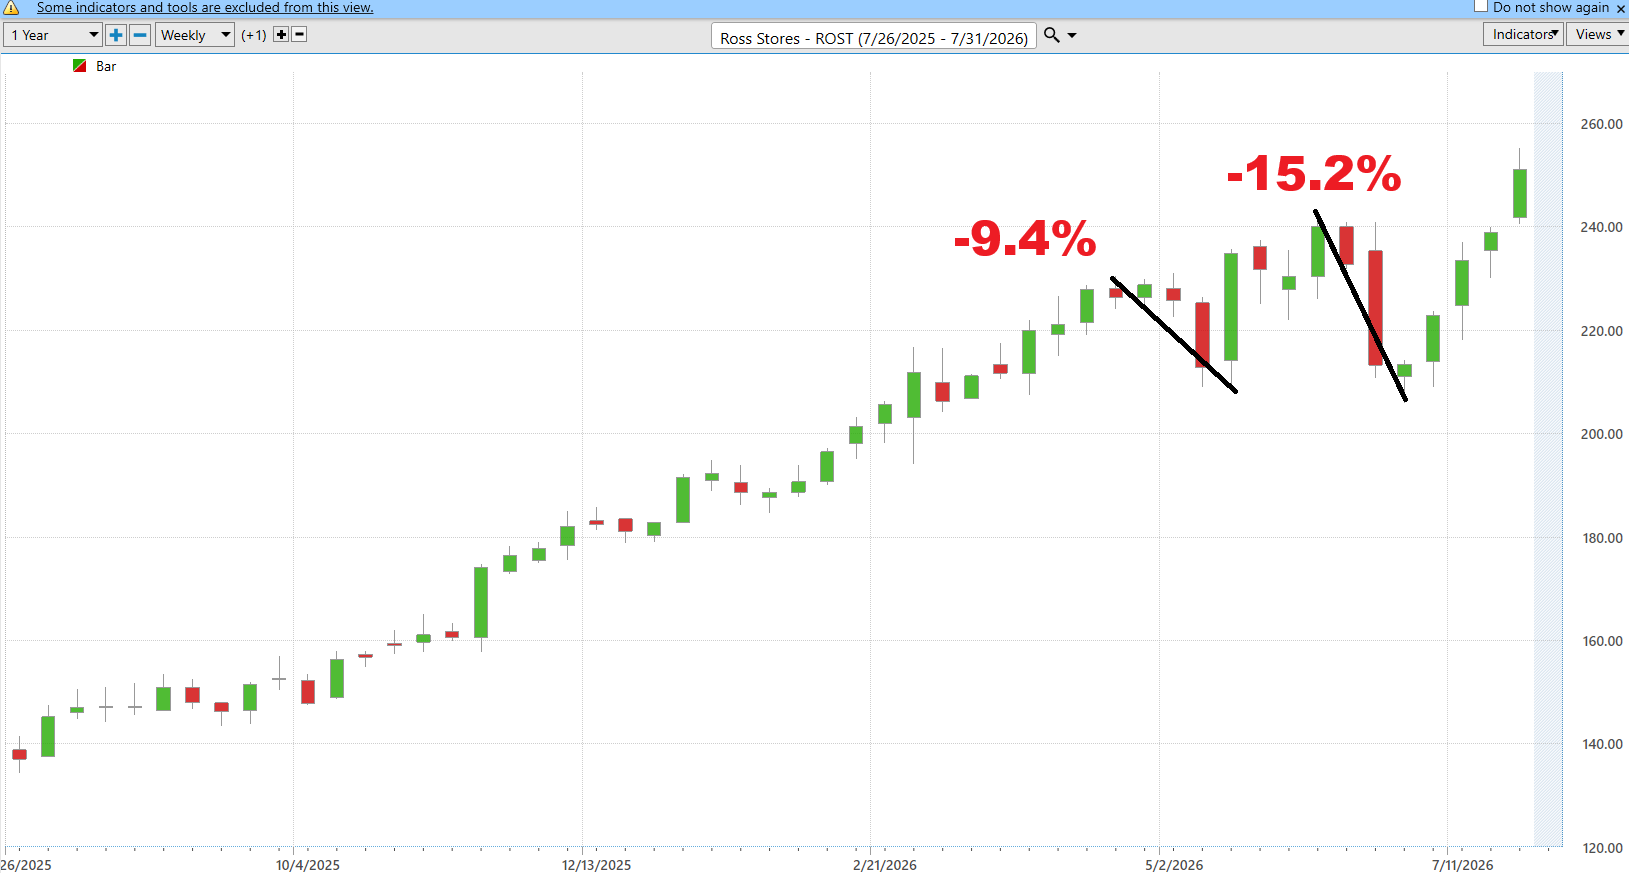
Strong trends advance, pause, shake out impatient traders, and then continue climbing. Investors who only focus on the destination miss the journey, while experienced traders recognize that temporary weakness is often the admission price for extraordinary long-term gains.
Comparison Metrics
The comparison metrics grid explains why Ross has become one of retail’s undisputed leaders.
During the past year, the stock gained 76.85%, outperforming the S&P 500 by 58.53 percentage points, the Nasdaq by 56.33 points, the Dow Jones Industrial Average by 58.03 points, and the Russell 2000 by 44.35 points. Even more impressive, the leadership is consistent across every measured time frame. Ross outperformed during the past week, month, six months, year-to-date, and full year. That kind of persistent relative strength rarely occurs because of luck. It usually reflects institutional investors steadily increasing their positions as improving fundamentals, rising earnings expectations, and disciplined management reinforce confidence in the company’s future.
We always remind traders that Relative Strength is by far one of the best stock selection methods. $ROST communicates this value accross all time frames.
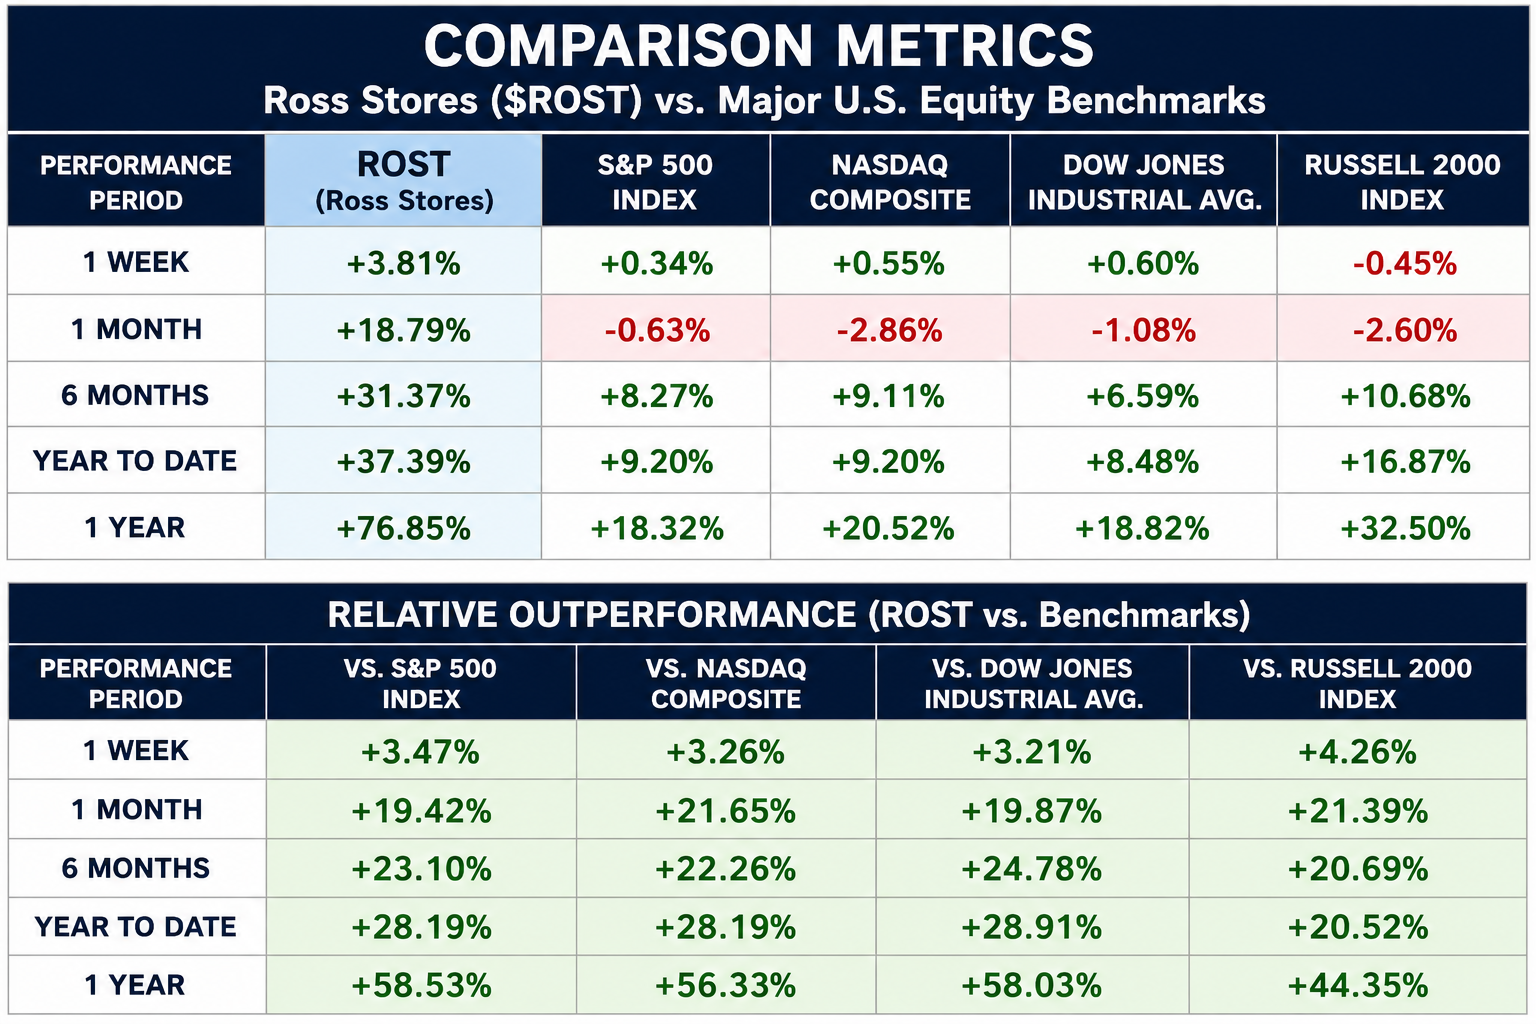
Viewed together, these charts tell one powerful story. Ross Stores is not simply participating in a rising market. It is leading it. The best-case and worst-case graphics demonstrate that volatility creates opportunity rather than something to fear. The 52-week boundaries show that buyers continue rewarding the company with higher prices, while the comparison metrics prove that capital is flowing into Ross faster than virtually every major benchmark. For disciplined traders, the lesson is straightforward. Respect the long-term trend, expect normal corrections, and never confuse temporary volatility with permanent weakness. The biggest winners rarely travel in straight lines, but they often leave behind a very recognizable footprint. Ross has been leaving that footprint all year.
VantagePoint AI Predictive Blue Line Analysis
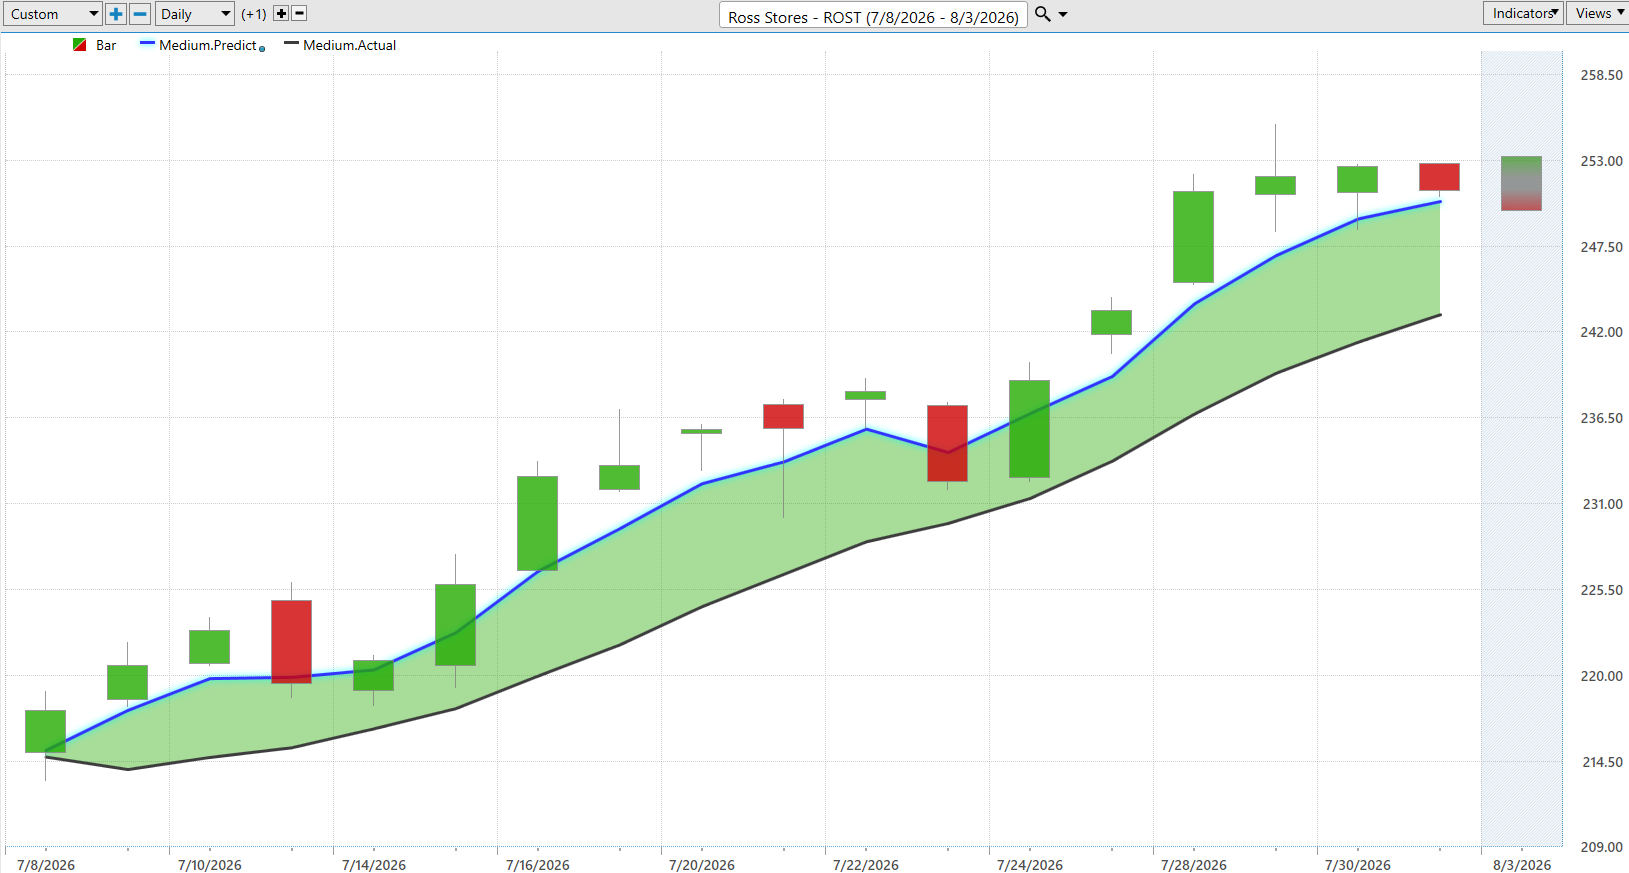
The Predictive Blue Line is doing exactly what disciplined traders hope to see. It continues to rise above the slower 10 day simple moving average, and the widening gap between the two tells a simple story: momentum is strengthening, not fading. Think of the blue line as the market’s forward-looking compass rather than its rearview mirror. While price has advanced sharply, the predictive trend continues to climb, suggesting buyers still control the larger narrative. That does not mean the stock cannot pause or pull back. Strong trends often do. But as long as the Predictive Blue Line continues making higher highs and remains above the actual moving average, the path of least resistance remains higher. For traders, patience is the edge. Instead of chasing strength after a sharp advance, wait for price to drift back toward the rising Predictive Blue Line, where risk is lower, reward is greater, and probability begins working in your favor again.
VantagePoint AI Neural Index Analysis
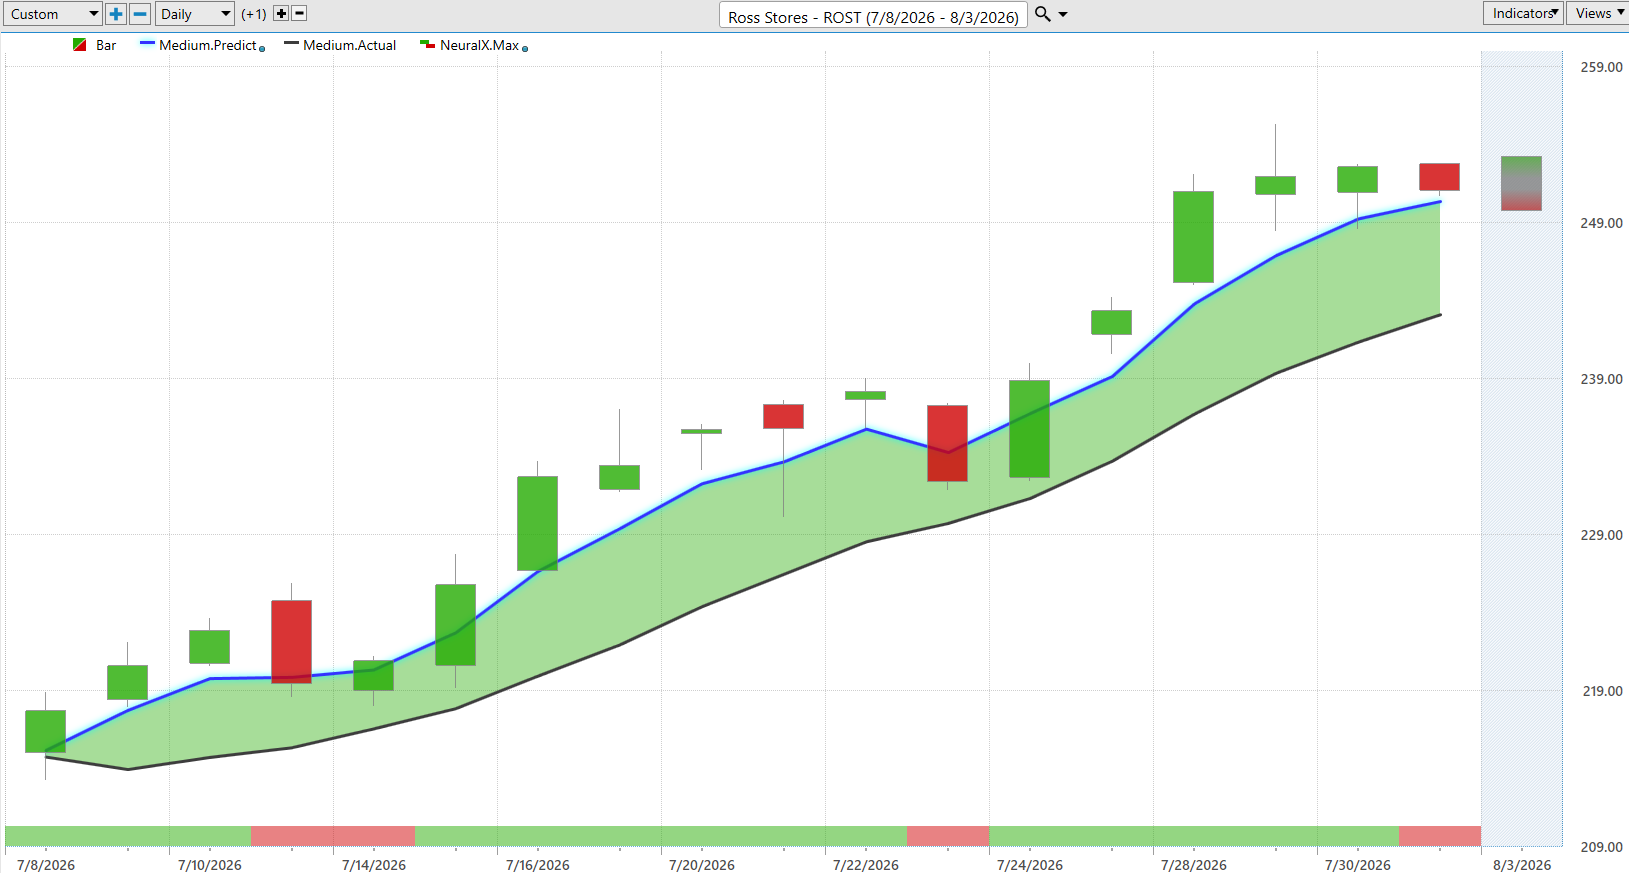
The Neural Index is designed to answer one question that price alone cannot: What is the highest-probability direction over the next 48 to 72 hours? Throughout most of this chart, the indicator remained predominantly green, confirming the bullish message from the rising Predictive Blue Line and helping traders stay on the right side of the trend during Ross Stores’ powerful advance. The brief red readings correctly warned of short-term pauses without changing the larger bullish outlook, demonstrating that temporary weakness can occur even in a strong uptrend. The latest reading has turned bearish, suggesting that the next few trading sessions could bring consolidation or a modest pullback rather than an immediate continuation higher. By itself, that is not a sell signal. It is an early caution flag. When viewed alongside the still-rising Predictive Blue Line, the message is straightforward: the longer-term trend remains bullish, but disciplined traders should be patient, monitor whether the Neural Index quickly returns to green, and use any short-term weakness to evaluate higher-probability entry opportunities rather than chasing price after a strong advance.
VantagePoint AI Daily Range Forecast
The Daily Range Forecast is less concerned with where the stock has been than where it is most likely to trade next. The forecast continues to point higher, with both the projected high and projected low rising steadily over the past several weeks. That tells us the market is still rewarding buyers with progressively higher prices. At the same time, the upper forecast boundary has begun to flatten while the lower boundary continues to climb, narrowing the expected trading range. This is often a sign that momentum remains bullish but that the stock is taking a brief pause to digest recent gains.
For disciplined traders, the Daily Range Forecast provides a practical roadmap rather than a prediction etched in stone. Buying near the lower forecast boundary generally offers a more favorable balance between risk and reward, while chasing price near the upper boundary leaves little margin for error. As long as both forecast lines continue making higher highs and higher lows, the larger trend remains intact. A decisive break below the rising lower forecast boundary would be the first indication that bullish momentum is weakening. Until that occurs, the forecast continues to favor buying controlled pullbacks over chasing extended rallies.
Our Suggestion
Ross Stores continues to exhibit the characteristics of a premier market leader. Revenue and net earnings are expanding, management has consistently exceeded expectations, comparable-store sales remain among the strongest in retail, and the stock is dramatically outperforming both its competitors and every major U.S. equity benchmark. The technical evidence supports the fundamental story. The Predictive Blue Line continues to trend higher, relative strength remains exceptional, and despite a short-term bearish Neural Index reading, the larger trend remains firmly intact. Strong businesses often become strong stocks, and Ross currently has both forces working in its favor.
The only caution is that outstanding companies frequently become crowded trades. After advancing nearly 77% over the past year and trading near a new 52-week high, expectations are extremely elevated. The Daily Range Forecast suggests near-term upside may be limited after the recent surge, while the latest Neural Index warns that the next 48 to 72 hours could bring consolidation or a modest pullback. That should not be mistaken for a change in trend. It is simply the market catching its breath after an exceptional run.
Our suggestion is straightforward. Existing shareholders should respect the trend and continue letting the market prove them wrong rather than trying to outguess it. New buyers should resist chasing strength and instead wait patiently for controlled weakness toward the rising Predictive Blue Line or the lower Daily Range Forecast boundary, where the balance between risk and reward improves significantly. As long as revenue and earnings continue growing, management executes, relative strength remains superior, and the Predictive Blue Line continues making higher highs and higher lows, Ross deserves to remain on every serious trader’s leadership watchlist.
Practice great money management on all of your trades.
Use the Daily Range Forecast to isolate short term trading opportunities.
Ready to learn more about forecasting stocks and options days before anyone else with up to 87.4% proven accuracy? Attend a FREE LIVE CLASS.
It’s not magic.
It’s machine learning.
THERE IS A SUBSTANTIAL RISK OF LOSS ASSOCIATED WITH TRADING. ONLY RISK CAPITAL SHOULD BE USED TO TRADE. TRADING STOCKS, FUTURES, OPTIONS, FOREX, AND ETFs IS NOT SUITABLE FOR EVERYONE.IMPORTANT NOTICE!
DISCLAIMER: STOCKS, FUTURES, OPTIONS, ETFs AND CURRENCY TRADING ALL HAVE LARGE POTENTIAL REWARDS, BUT THEY ALSO HAVE LARGE POTENTIAL RISK. YOU MUST BE AWARE OF THE RISKS AND BE WILLING TO ACCEPT THEM IN ORDER TO INVEST IN THESE MARKETS. DON’T TRADE WITH MONEY YOU CAN’T AFFORD TO LOSE. THIS ARTICLE AND WEBSITE IS NEITHER A SOLICITATION NOR AN OFFER TO BUY/SELL FUTURES, OPTIONS, STOCKS, OR CURRENCIES. NO REPRESENTATION IS BEING MADE THAT ANY ACCOUNT WILL OR IS LIKELY TO ACHIEVE PROFITS OR LOSSES SIMILAR TO THOSE DISCUSSED ON THIS ARTICLE OR WEBSITE. THE PAST PERFORMANCE OF ANY TRADING SYSTEM OR METHODOLOGY IS NOT NECESSARILY INDICATIVE OF FUTURE RESULTS. CFTC RULE 4.41 – HYPOTHETICAL OR SIMULATED PERFORMANCE RESULTS HAVE CERTAIN LIMITATIONS. UNLIKE AN ACTUAL PERFORMANCE RECORD, SIMULATED RESULTS DO NOT REPRESENT ACTUAL TRADING. ALSO, SINCE THE TRADES HAVE NOT BEEN EXECUTED, THE RESULTS MAY HAVE UNDER-OR-OVER COMPENSATED FOR THE IMPACT, IF ANY, OF CERTAIN MARKET FACTORS, SUCH AS LACK OF LIQUIDITY. SIMULATED TRADING PROGRAMS IN GENERAL ARE ALSO SUBJECT TO THE FACT THAT THEY ARE DESIGNED WITH THE BENEFIT OF HINDSIGHT. NO REPRESENTATION IS BEING MADE THAT ANY ACCOUNT WILL OR IS LIKELY TO ACHIEVE PROFIT OR LOSSES SIMILAR TO THOSE SHOWN.