


Register for a Free Live Training
The Hot Stocks Outlook uses VantagePoint’s market forecasts that are up to 87.4% accurate, demonstrating how traders can improve their timing and direction. In this week’s video, VantagePoint Software reviews forecasts for SPDR SPY($SPY), Under Armour ($UAA), National Beverage ($FIZZ), Pfizer ($PFE), Boeing ($BA), Travelers ($TRV), Wingstop ($WING), Cleveland Cliffs ($CLF),
SPDR SPY ETF ($SPY)
.
Hello again, Traders, and welcome back to the hot stocks outlook for September 29, 2023. I hope you all are having an excellent week out there in the financial markets. As always, we’ve got plenty of opportunities to take a look at today. So, as we typically do, go ahead and make sure you click on the link in the description below, and you can actually get a live demonstration to learn all the specifics about how this technology can really help you make better trading decisions day in and day out in the marketplace.
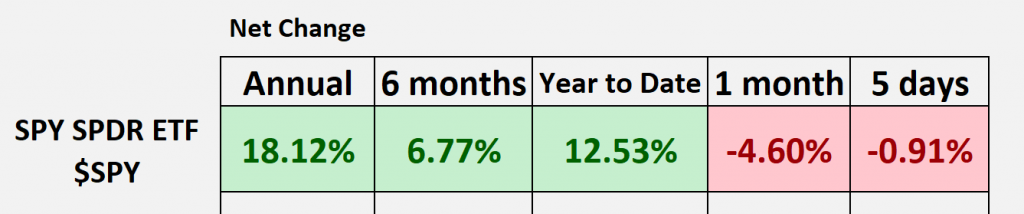
But as we typically do, we want to take a look at the broader S&P 500 performance, and we can do that via the Spy ETF. So as we look at some of these blocked periods going back, we can see that 12 months ago, we’re actually about 18 (now, you know that really depends on where the market was 12 months ago), but at the beginning of the year, we see we’re about 12 and a half percent higher.
Now what we’ve highlighted recently in these hot stocks outlooks is that there’s been some issues in the market, and this is especially important if you’re trading individual stocks. But you really need the best technology to help you make the best trading decisions and identify the best markets to be worthy of your attention and focus and trading capital.
So as we do this and go through a lot of these markets, you know, I encourage you to go back and watch the hot stocks outlook from a couple of weeks ago. That’s where we brought in The Travelers, we bought in Wingstop, but we’ve identified a lot of weakness spread out in the market, specifically here, Boeing, Pfizer, we’ll revisit, and some new things going on that traders can exploit and take advantage of and position into the portfolio to complement some of these opportunities as markets have been volatile and rolling through here.
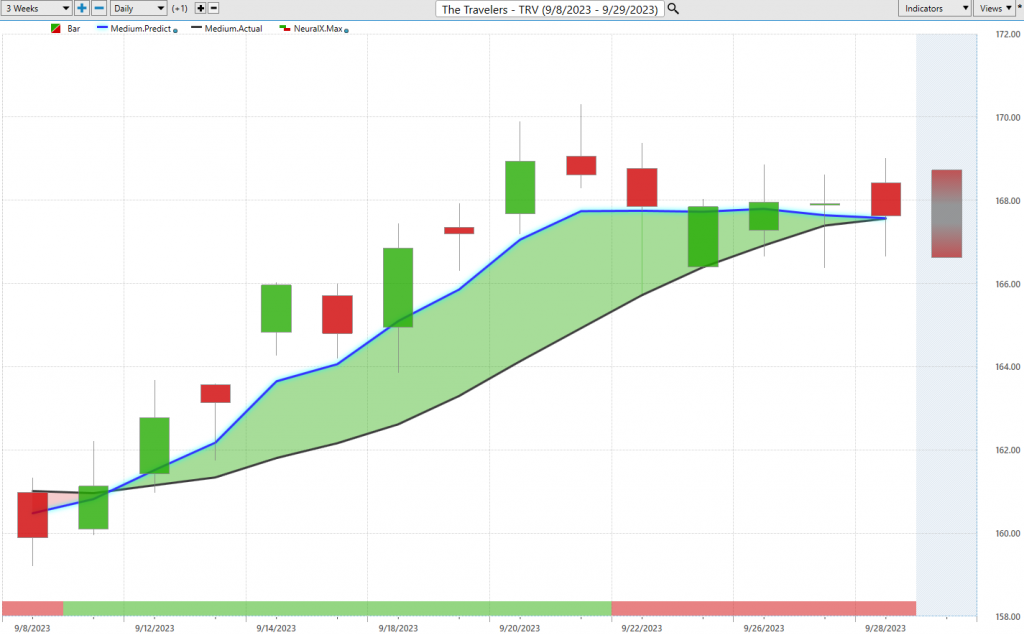
So let’s start out here with Travelers. This is a really great example of how all of these tools work within the Vantage Point software, and what you’re looking at here with Travelers is daily price action. Right, so each one of these candles represents a full and complete trading day, and Travelers we brought this through really two weeks ago. So this is a great example of how these forecasts update and help traders make better trading decisions.
So what you see against that daily price action is you’re going to notice there’s a black line and a blue line. There’s a bar at the bottom of the chart that goes from green to red and can go back to green, and then there’s a predicted candle. And so this is actually a predicted high and a predicted low value that helps traders with intraday very short-term term price action.
But let’s go ahead and just start with this black line and blue line right up against the price. And what you’re seeing here is with the black line value is a simple moving average. So this is a very common technical indicator. In this case, specifically, it’s actually a 10-period simple moving average. So what happens is you just add the last 10 closed prices together, divide by 10, and what that does for us as traders is smooth out the existing price action.
Right, let us know where market prices really have already been because all of that data comes from the past. But what we’re able to do with Vantage Point is compare that black, what we might call a lagging moving average, to this proprietary predicted moving average. And for this blue line, essentially, this value to be plotted and calculated and placed on the chart for the trader every evening.
Well, this is where the technology of artificial neural networks first comes into play. And what those neural networks are doing are performing what we would call inter-market analysis. And what that means is specifically for travelers insurance, there are dozens and dozens of markets that are known to drive and influence the future price of this market going forward. Now these can be positive correlations, inverse correlations, these can be leading or lagging relationships.
And this is where artificial neural networks have a huge advantage. They can analyze that data, make sense of it, and then produce a highly accurate output that traders can use to execute their trading plan, whether they’re shorter-term, longer-term trading options. You need to know where the market is headed next over a given time period.
And so what those neural networks are doing are looking at very broad markets, things like, you know, what we might call macro markets like the dollar index. You know, that’s had a profound impact on the value of the S&P 500 and a lot of individual stocks. Things like the Euro, things like gold prices. And it’ll also look at things like that SPY ETF or the individual stock indices like the S&P 500, the NASDAQ.
But it’s going to be able to look at other big commodities like gold and also down to individual stocks. So potentially other insurance companies, other insurance ETFs that all… there’s, you know, some really important information that can really be derived from those inter-market relationships and then used to generate these future price predictions.
So whenever that blue line, in this case, is crossing above that black line, it’s suggesting average prices are on the way up, and you, therefore, would want to execute strategies that are more likely to the bullish side here. But let’s break this down and sort of, we every week we do this, we sort of go from that predicted moving average, and you see we’ve got about a 4 percent rally just over the past 13 trade videos.
But what I want to highlight here is the predicted neural index. And so when you look very closely at the bottom of the chart, you see you have this bar that goes from green to red. And this is also utilizing that technology of artificial neural networks, but it’s tuned to solve a different problem for the Trader. It’s not looking for average prices over a given period of time and helping with those reversals. It’s really looking for short-term strength over the next 48-hour period, or you can think of that as two candles. And so what you notice here with Travelers, and again, this is a market that we brought through a couple of weeks ago, highlighting that look, there’s a lot of volatility out there. You need to be real careful, and you really need to hone in on the quality opportunities that will keep you a little bit safer here. And you see that as the market moves higher, we get a lot of strength. But things have shifted, and the market has run sideways. Now we haven’t seen a crossover to the downside here. But you see exactly how these predictive indicators work, saying here’s where the trend’s reversing, a lot of short-term strength, and here’s where you maybe want to make some adjustments and where you can use a, you know, Vantage Point, other tools like the predicted highs and predicted lows, you know, provided from this, you know, what we might call this Shadow predictive candle, you know, this is all provided a day ahead of time, you know, for the next trading day that’s coming up.
And so when we look at all of those predictions against the actual Market data, you can see how effective a tool like this is. Right? We use these levels to identify good opportunities to get involved in the market. But then as you need to manage the opportunity, well, yeah, you want to be a buyer in an uptrend, but maybe you want to take some profit and do some trading adjustment over this period of time where you see we’re hitting the predicted low, high, moving to predicted low, now moving back to the predicted high. And there’s a great opportunity there for Traders to improve their positions, minimize risk, and stay involved in the marketplace here.
So a little nice opportunity going on in Travelers, a really nice entry that we highlighted a couple of weeks ago. But let’s take this and look at some other markets.
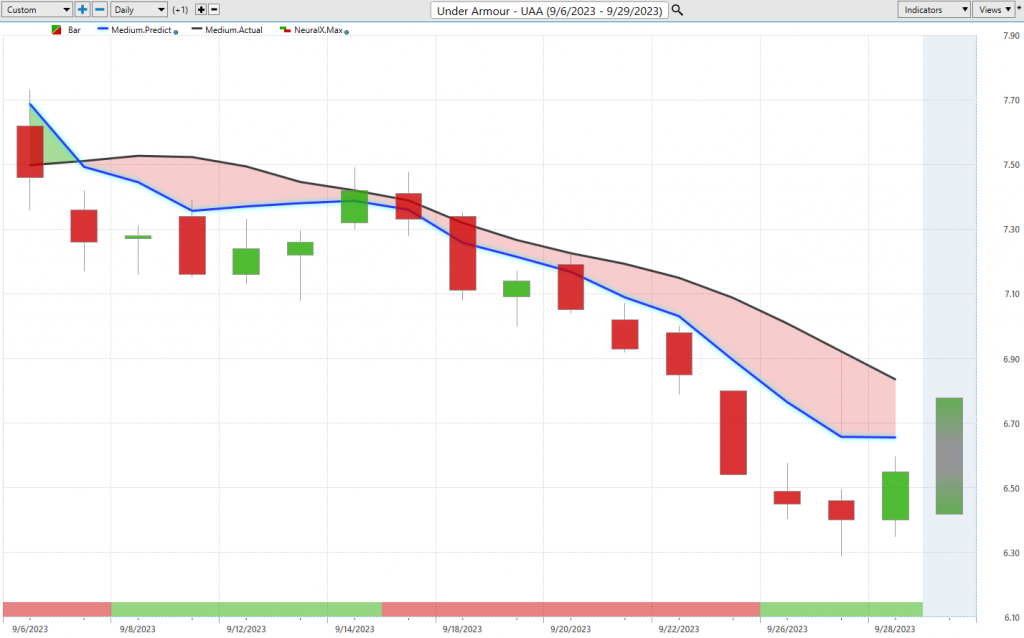
Now here’s Under Armour, and we have a completely different picture.
And I can’t stress this enough that the S&P, the broader indices are very mixed here. It’s not like everything’s moving straight up. You need to be really careful deciding if you are buying individual stocks or potentially a great option here is to go long and go short where these predictive indicators are highlighting that that’s the appropriate action to do.
So here, here Under Armour, you see that we have our daily price action. We got this blue line crossing below the black line, going all the way back really to the beginning of September. But what you’ll notice here, and why I wanted to highlight this, is look at the neural index here. Right, so short-term strength over the subsequent 48-hour periods, but is the trend up? Well, no.
And when that neural index gets bearish again, we see that momentum heat up, and shares start to decline, as just generalized volatility comes into the market as well. So you can see how when you find the right markets that are really primed when that overall S&P volatility and sell-off comes in, well, you know, those markets really benefit or don’t benefit in this case as shares go lower over the past three days.
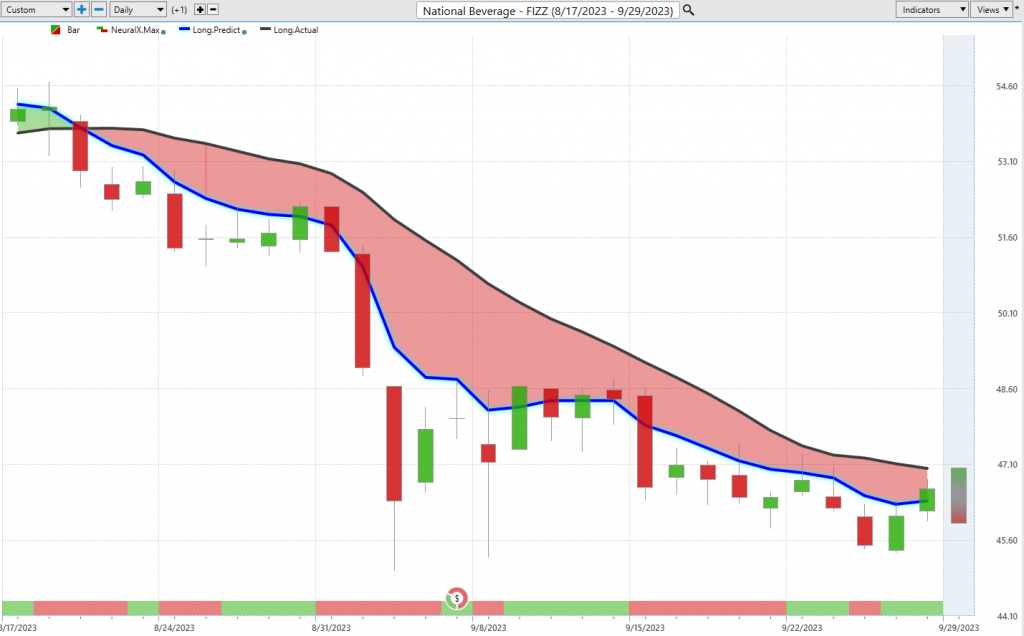
Here, National Beverage, again, good example of some of this weakness. A little bit more mixed from the neural index. And again, I want to highlight some of these periods to help traders out. But what’s very clear about this chart is this isn’t a downtrend. That blue line is crossed below the black line. You see a little blip here where the neural index gets bullish, and we immediately go lower.
But you’ll notice that again, here come these retracements, these sideways periods. But do you want to get long? No, no, no, no right? Very dangerous sideways retracement. Sideways retracement. But even with those sideways retracements, this market has just been crushed here. And we’ve seen again about a 14% decline in the past 28 trading days. So again, you know, about a month on the calendar here. 10% to 15% declines really across a large number of shares. And so, yeah, if you’re getting long, you really need to find some high-quality opportunities and really avoid these things that are in strong downtrends.
You see about 500 shares, about $3,800 move just over the past month here.
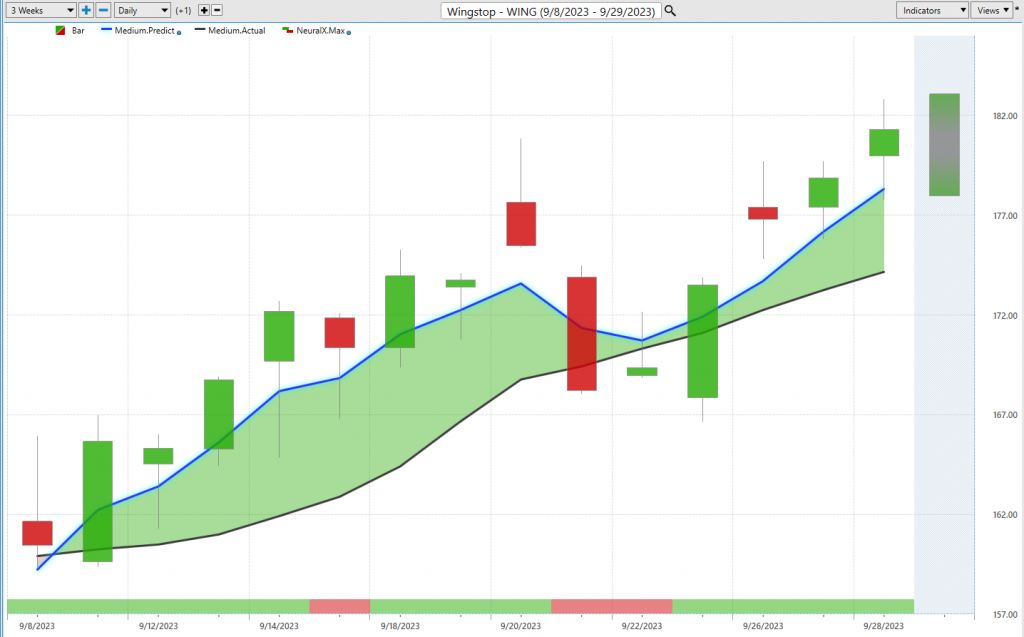
Now, we also brought in with Travelers a couple of weeks ago here at Wingstop, and a great example of how these predictive tools work, right? We can identify that blue line crossing above the black line. There’s a lot more strength here. You’re going to get that volatility, right? When the S&P starts selling off and the dollar starts marching higher, you’re going to see that effect almost all stocks in the market.
But what do we also see here? That blue line is still above the black line. So what happens here? Yeah, we get a couple weaknesses over the next couple of days, but last four trading days here in Wingstop, it’s been saying, “Look, the trend is up. If you want to get long in the market, this would certainly seem more appropriate here.” Shares up about 10.5% over the past 13 trading days.
Again here, you know, even 30 shares has yep, 500 dollars there, a hundred shares around 1700 there. So really nice moves. But of course, I keep coming back to this as things are quite mixed, and you want to be careful here. When we look at the predicted highs and lows, we see just how effective a lot of these tools are at identifying those early opportunities to really get a position, you know, in the market early.
And you see that well, you’re not coming back to these you know 160 levels where you start that position. So you really get the opportunity to get some longs into the portfolio. You could run your stops at break even and still have those opportunities benefiting you. Same thing on the bearish side, right?
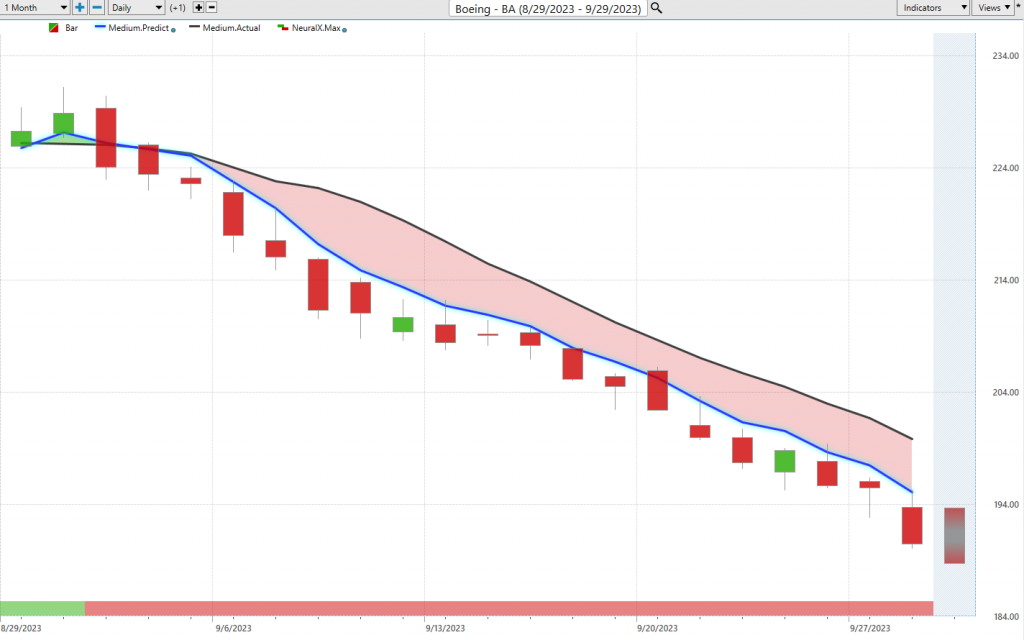
Here, shares of Boeing, and this has been just absolutely dreadful, right?
So, I mean, it doesn’t get any more clear here. What’s going on with Boeing, you’re in a downtrend short term. There’s weakness. And those predicted highs and lows, of course, you know, we can use those to identify some good places of value to potentially short, take profits on shorts as a very short-term trader here. So you see we get real close here, we hit it there. Um, close there.
But just a tremendous amount of weakness in shares of Boeing, very clearly that you only want to short, take profits on shorts, and be waiting for some better times here because there is some problems going on. So, you know, these are the types of things that we see really dragging down the indices and why you need to be really careful on which stocks you’re identifying as some good opportunities here. About 15% decline just in the past month, uh, and I got 500 shares about 17,000 move. Um, you know, obviously you can bring the share count down, but this is a really large move in a very small period of time in a very large stock here. So again, reasons to be careful, uh, and cautious here.
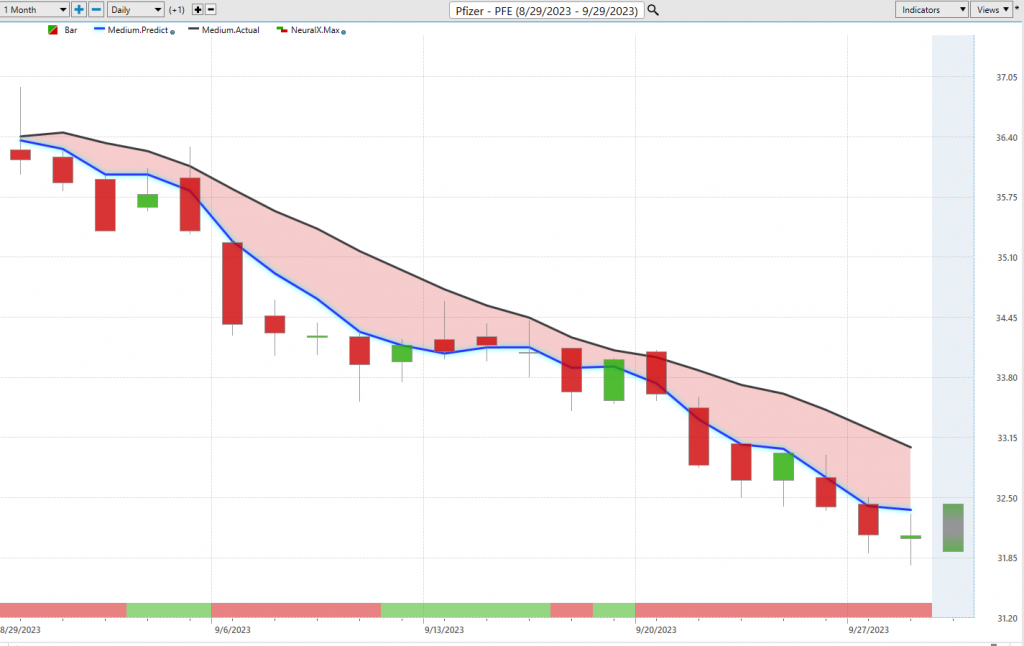
At Pfizer, another one of these opportunities, identifying the weakness in the market. Blue line crossover the black line to the downside, you get a couple of these areas where you see we’ve got some higher highs, sideways, uh, sort of retracement. But what’s been going on for the past couple of weeks? A heck of a lot of weakness. The trend is down, neural index is bearish. And of course, we have things like the Vantage Point predicted highs and lows to be used as guidance on where do I want to short, where do I potentially want to take profit and reset positions? You know, all these levels are very effective day to day to help you get those little edges on the market participants based on that time frame that, uh, you’re, uh, you know, participating in and trying to exploit, um, with your trading strategies.
So here, uh, shares off about 11 almost 12% you know, just in the past month here, 22 trading days. Again, 500 shares, a couple thousand dollars move lower there.
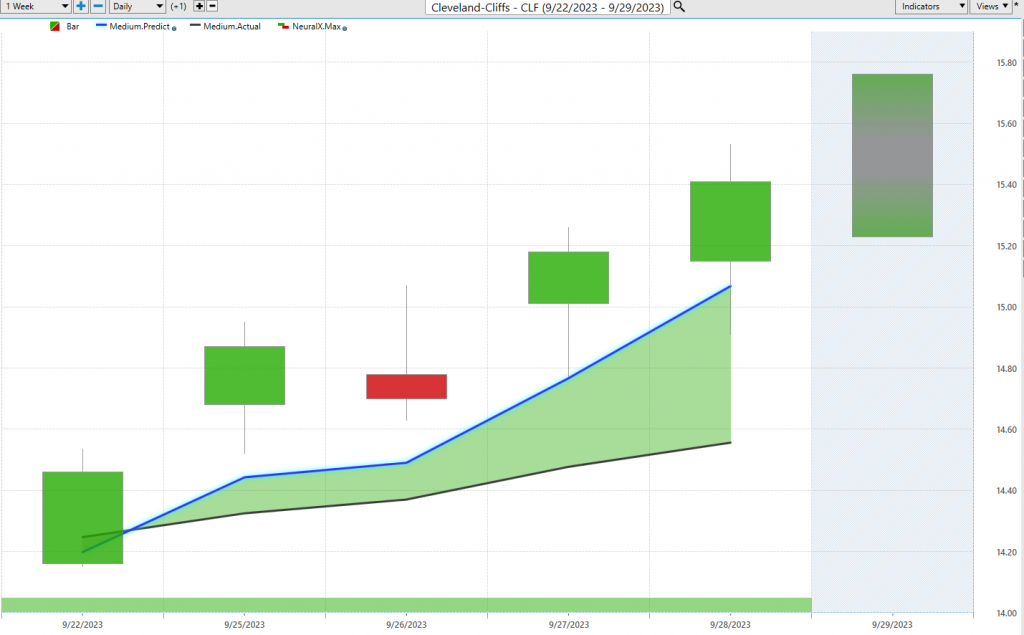
But lastly, let’s take a look here at Cleveland-Cliffs. So this is an example really similar to Travelers or Wingstop, really identifying that reversal or shift in the marketplace. And this is actually where tools like Vantage Point and INTelescan can really handle a lot of that for you, really identifying where these predictive indicators are generating signals as soon as they’re generated.
But what do we have here with that blue line crossing above the black line? You see that 48-hour forecast from the neural index really decidedly bullish over the past five trading days. And of course, traders would want to look towards Vantage Point’s predicted highs and lows. And so you see here with Cleveland Cliffs, we have this predicted low here, value of 1463. Well, where did the market move towards that day? 1463. And then advances towards that pretty good high of 1512.
You see the next trading day advancing and only to what move down to the next day’s predicted low, we can see this value here of a predicted low of 1497. Market went to 1491 and then advanced up towards the predicted high at 1551. So a really nice opportunities here to get that edge in the market, really accumulate that position, you know, and really minimize the risk to get that type of exposure into the portfolio.
So again, really nice opportunity thus far here in shares of Cleveland Cliffs. We can take a look at, okay, from that predicted low, what are we looking at here? About a 5%, you know, 5% move just in the past three trading days. And so, just like with shares of Boeing and some of these other things, well, neural index bullish, the overall trend is up, and of course, there’s places where you can belong and other places where you might want to short, hedge the portfolio in accordance with these predictive indicators.
So once again, this has been our hot stocks outlook for September 29, 2023. Thank you all for watching. Best of luck and bye for now.

