









Register for a Free Live Training
The Hot Stocks Outlook uses VantagePoint’s market forecasts that are up to 87.4% accurate, demonstrating how traders can improve their timing and direction. In this week’s video, VantagePoint Software reviews forecasts for Appian ($APPN), Brookdale ($BKD), Paycom Software ($PAYC), Pfizer ($PFE), Levi Strauss and Co. ($LEVI), Salesforce ($CRM)
VantagePoint AI Hot Stocks Outlook for August 28, 2026
Hello again traders and welcome back to the hot stocks outlook for August 28th, 2026. Hope you all have had an excellent week out there in the financial markets.
And as always, we are here to take a look at the most recent Vantage Point AI predictive forecast. So, if you haven’t already, be sure to go ahead and click the link down in the description below and get signed up for a live demonstration and you can learn all the specifics about how these predictive indicators and artificial intelligence technology is helping traders make much better trading decisions out in the marketplace.
Appian ($APPN)
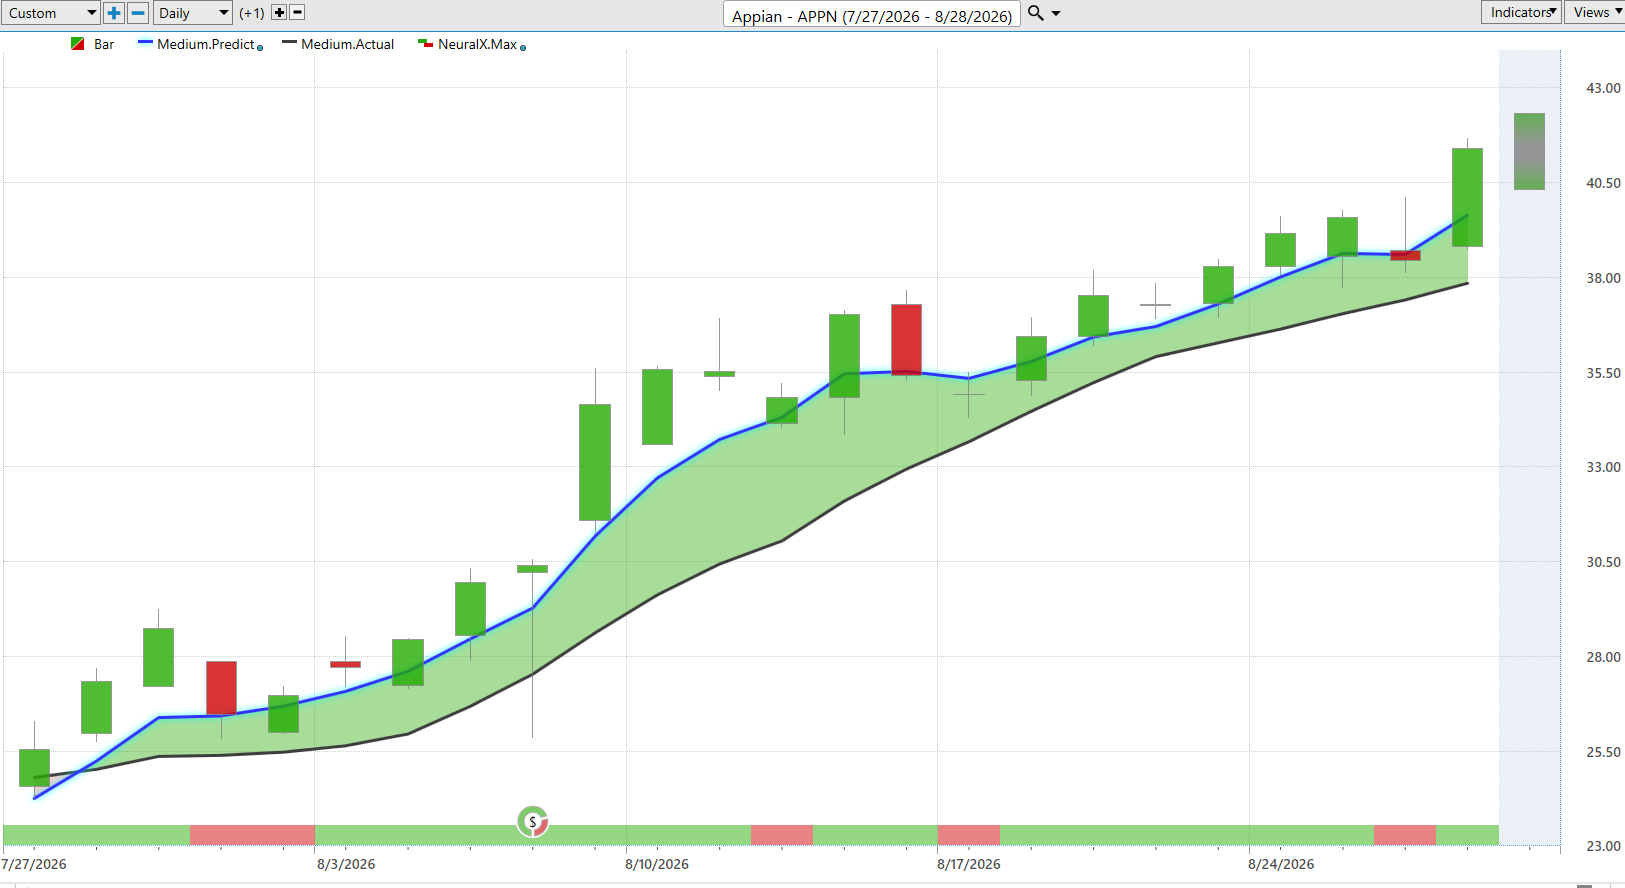
So we have a lot of examples to look at today. Actually a lot going on in the software space, which we actually looked at this uh back in July where a lot of these trends started. Uh but a nice example of how all of these tools work on shares of Appian here. And so what we have here is daily price action of course, right? So each one of these candles, well that’s going to represent a full and complete trading day. And right up against that daily price action, you’re first going to notice that there’s a black line and also a blue line value. And so what the black line is is quite simply a simple moving average. So a very common technical analysis indicator. uh we refer to this as the actual simple moving average. And all this value is is just looking back at the previous 10 closes, adding them all together, and then dividing by that number. And now, if we think about that calculation, well, that means that all of that data really just comes from the past of this one specific market in question. And it has no predictive capability. It really just summarizes what has already occurred. But what vantage points tools are able to do is actually predict where prices are likely headed next. And we do that uh actually through this vantage point predicted moving average. And so for this number essentially what we can think of as a price here for this price to get calculated and plotted and placed on the chart every evening for the trader. Well, this is where the technology of artificial neural networks come into play. And they’re performing what we would call intermarket analysis.
And so what that means is that rather than just looking at that past price data, Vantage Point’s technology is looking at dozens of other markets that are known to drive and influence future price. So essentially the data set that’s used to generate the value of these predicted moving averages is coming from not only the target market uh but it can be ETF groups, right? So ETFs are going to wrap up a large sector or grouping of stocks. It can come from other individual stocks throughout the stock market. But it even takes a global approach in that it looks at things like the value of the dollar index uh major currencies major uh uh indices as well as interest rates uh and even where applicable which we looked at last week uh certain commodities right so if gold or oil uh is very important to the stock you’re trading well it’s going to factor that in and use that to generate these highly accurate predictions. So whenever we see that blue line value in this case cross above the actual moving average or that black line what’s suggesting that these average prices are going to start moving higher uh and traders can look to take a long position. Now we see here since that forecast came through uh Appian shares up here about 60% just in the past 23 trading days. Uh and this has been an area of the market where a lot of these software and uh enterprise resource stocks uh have really been beaten down sort of like Salesforce here where we’ll take a look at uh but have been rallying over the past couple of months uh in a pretty strong way here.
So uh in addition to that uh predicted moving average, if you look at the very bottom of the chart here, you’re going to notice this bar that goes from green to red and back to green. Well, this is what’s called the Vantage Point predicted neural index. And it’s also utilizing that technology of artificial neural networks, but it’s really tuned to solve a different problem here. And that problem is much more geared towards the short term in anticipating short-term strength or weakness just over the next 48 hours, right? So just a couple of candles at a time moving forward. Uh and so you’ll notice here that as we get that blue line crossing above the black line, the neural index goes bearish here. You see a little bit of a gap down. So intraday uh lows being set here. Again, neural index gets bearish against some lower lows over the next 48 hours. Uh, but overall, this has a very high level of accuracy. So, it gets us right upwards of 86 87% of the time. And we can combine that output with the overall trend direction uh to manage those opportunities and really know when to anticipate potentially some short-term weakness. Now, uh lastly here, you’re of course provided the vantage point predicted high and predicted low. So in addition to the overall trend direction uh that short-term strength or weakness uh projected by the neural index, you’re also given actual intraday predicted levels of where the market is likely to trade. Uh and so this is where things get very interesting each week as we look back and say, well, how accurate have all of those predictions been against the actual market data?
So what’s going to happen is we have Friday coming in here. We’re going to fill in the actual market data and we’ll see how accurate this predicted high and predicted low value are. But as we look back and traders can say, okay, well, how would I have managed this opportunity? You’ll actually notice we take a look at this quite a bit uh uh from week to week where you see all the price action is bullish even on this trading day here and where’s the market trade the next trading day right into that level uh that vantage point predicted and then as we move forward just offers up these levels daytoday for traders to manage uh these opportunities. So even just this past week uh what would have been uh Tuesday here uh the market moving higher already up uh just this week about 8.4% uh and you see how the market just barely moves past that predicted low and trades higher. So really nice opportunity here in shares of Appian again about a 60% rally uh just really over the month here.
Brookdale ($BKD),
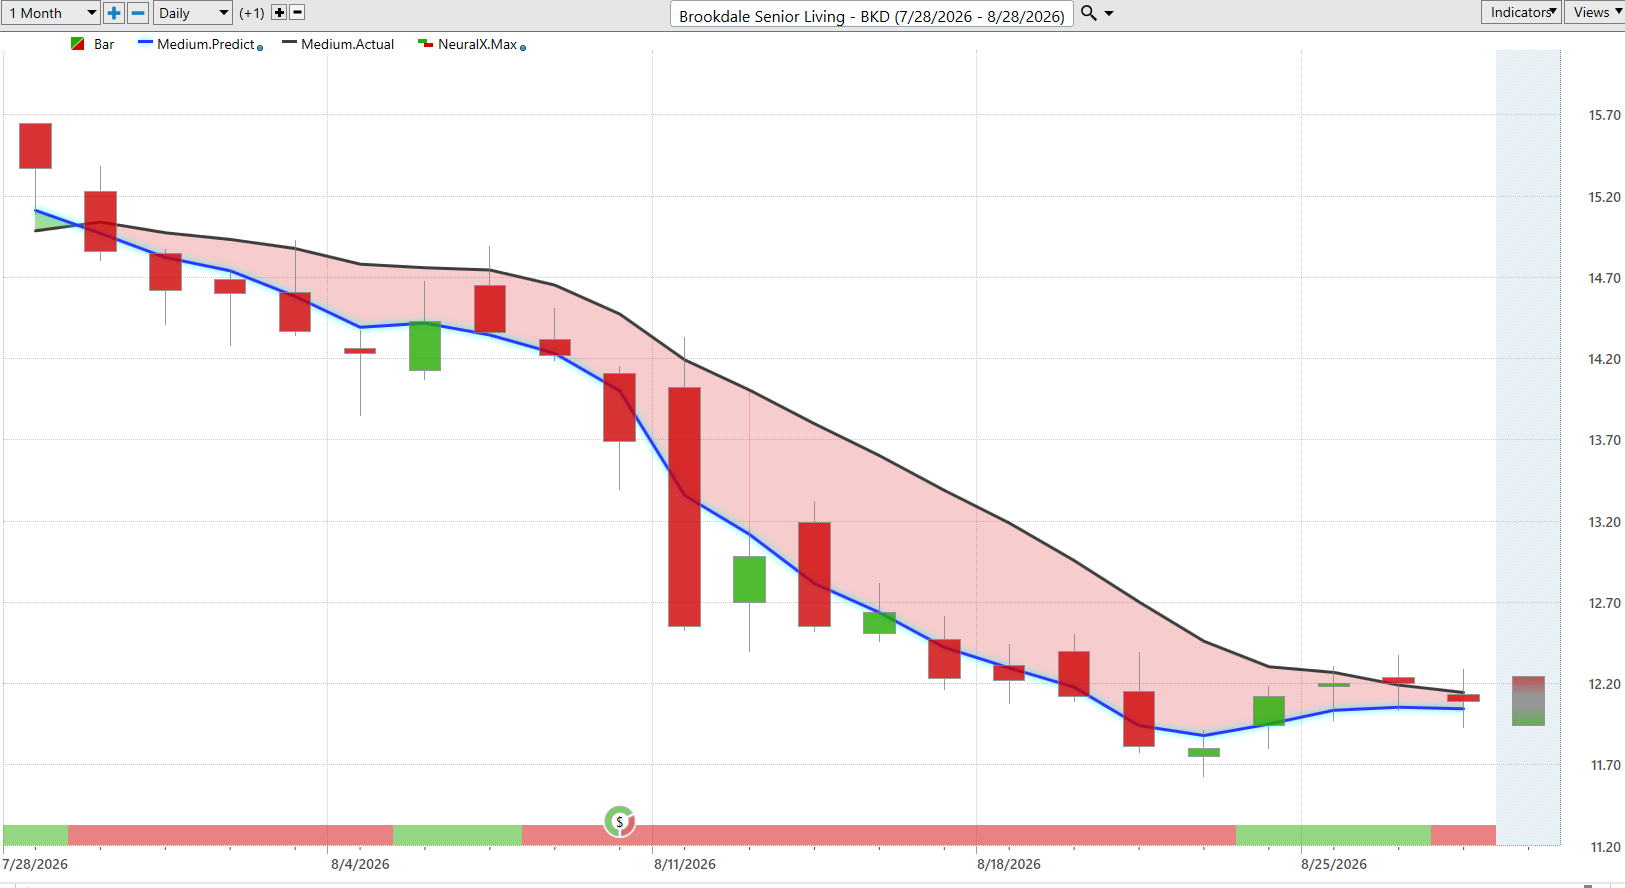
So uh we can take a look at Brookdale Senior Living and I wanted to bring this through because we’ve had a very mixed market, right? So, uh, we, you know, went through a period where stocks were just rallying every single day. The the broader indices were moving higher. Uh, but as things start to get mixed, well, you’re going to see some stocks start to struggle. Uh, and here you see that really just the exact opposite of what we had in the last chart, right? That blue line moving below the black line, neural index bearish. Now, you will again get these periods where the neural index can get bullish and you see that bullish subsequent price action over those 48 hour periods moving forward.
But very clearly the market is in a strong downtrend. And so uh if traders are looking to hedge or just looking again for directional trades, uh we see here Brookdale down about 19.4% just over the past 22 trading days. Uh and the exact same thing. We can take a look at those Vantage Point predicted highs and lows and you end up getting this road map moving forward. And one of the great things about Vantage Point is it adapts, right? So every single trading day, this technology is looking at not only the target market, but those intermarket relationships and then projecting that forecast forward for the trader so that they can make intelligent decisions on how they want to manage their trades. So uh a pretty strong decline here in Brookdale.
Paycom Software ($PAYC),
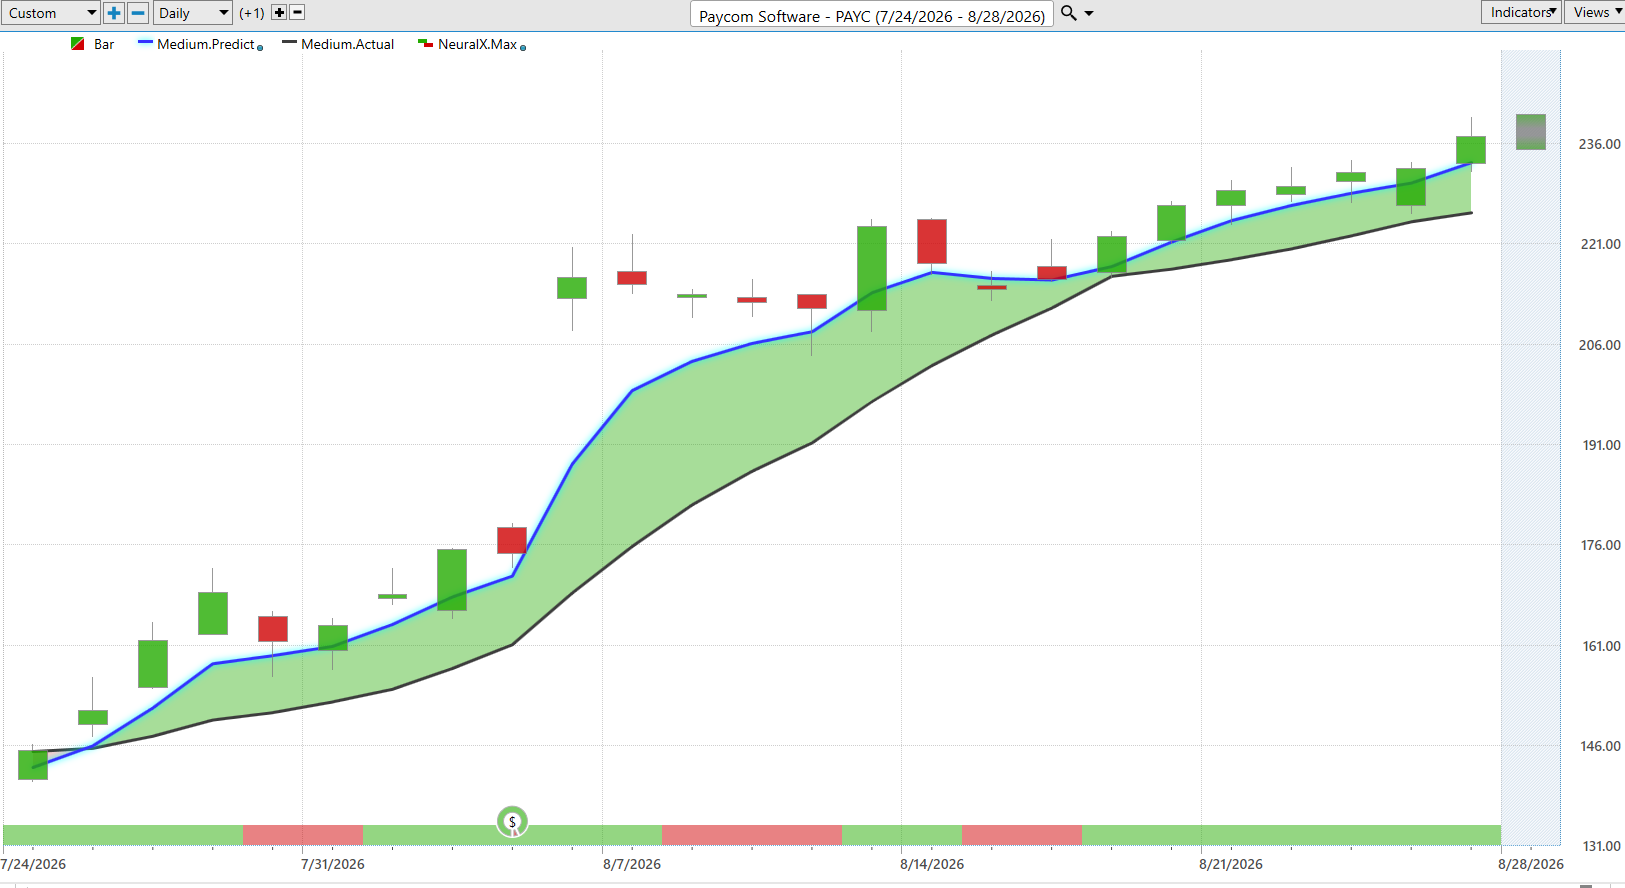
Back to the software side though, here’s Paycom software and you start to see a lot of these relationships uh and grouping of stocks turn higher uh all at the same time. And so this is where features like the vantage point intelliscan actually allows traders to scan through all of these predictive indicators and really see hey where are these market trends starting to shift what area of the market is that happening in uh not only what stocks to focus on but then getting that road map uh while you’re managing the trade and uh we progress forward through time. Uh so again you see that this neural index goes bearish you get a little sideways price action over the subsequent 48 hours. Uh but notice that the blue line is still very much above the black line. The trend is still solidly bullish. Uh and of course as traders manage this, they’ve got those predicted high and low values. So again, you see the exact same scenario here moving u you know all the price action is bullish in the uptrend and then you scoot right back into those predicted levels uh and the trend resumes. We have earnings here which is always going to act as a catalyst here. Uh but just multiple days here just moving down to that predicted low sometimes closing pretty much right at that level. uh things like this where you gap down and just immediately trade higher uh as the market is in a strong uptrend. So uh again as we look overall just over the past few weeks here uh shares up about 51% now uh in just the past 23 trading days. So, um, in a lot of these software names, I encourage you to go back and look at a lot of these hot stocks outlooks at the beginning of July. Uh, we were looking at Wayar, Jack Henry, uh, Thompson Reuters, all of which have rallied uh, pretty strongly here. And this just being a couple more examples uh, of that in the software space. Now, uh, here’s Pfizer. Pretty straightforward forecast, very popular stock here, but again, blue line getting above the black line.
Pfizer ($PFE),
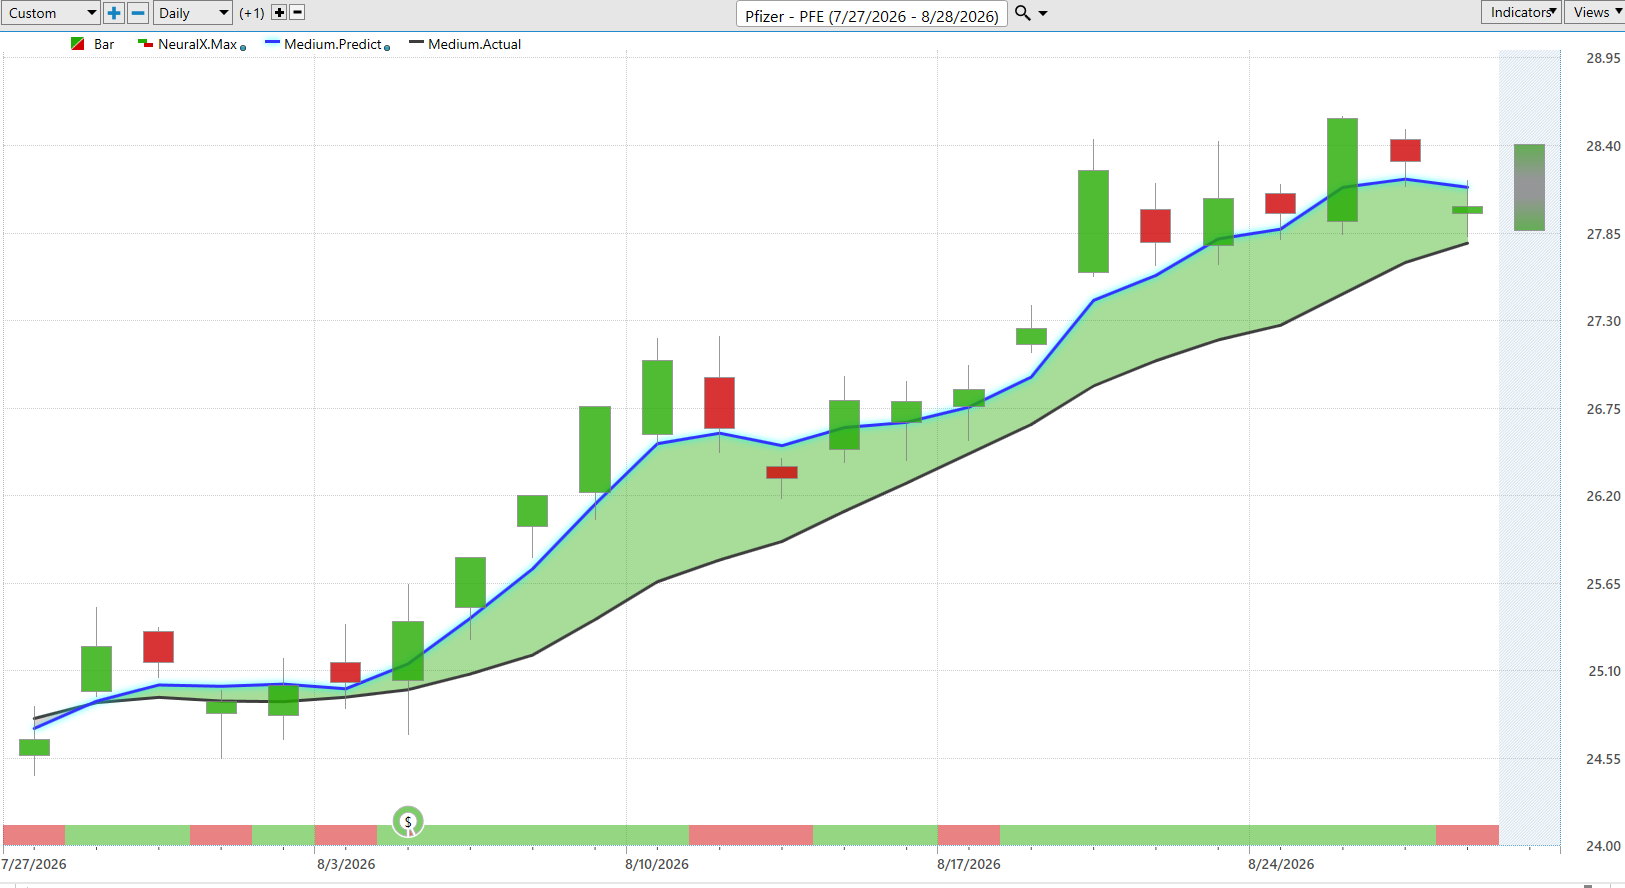
A good example of these neural index is just going, look, we’re running sideways here over those 48 hour periods. And you see how you get these lower lows in the price action. Uh, just letting you know that that’s likely to see some short-term weakness over those 48 hour periods. Again, you see here getting a gap down. Um, and so again, it just helps traders really anticipate what is likely to occur in the short term so they can make those better potentially longer term decisions on how to manage that trending opportunity. You see shares up about 12% now uh just over the past 23 trading days. So pretty much just one month of time shares up about 12%. Uh and of course you have that road map of the predicted highs and lows. Uh and again you see these previous predicted lows being hit uh and then the market rallying here. You see even here you’re getting that range moving lower uh before the trading day. Right? So it’s letting you know look expect this weakness. Expect to trade down towards these predicted lows. But as long as that blue line remains above the black line, the overall trend is still bullish. Uh and we see the market start to uh firm up and and go higher here. So nice opportunity there uh in Pfizer and and you know even things like Amgen we looked at last week just a lot of bullishness in uh some of these large pharmaceutical stocks. Uh back to some weakness though.
Levi Strauss and Co. ($LEVI)
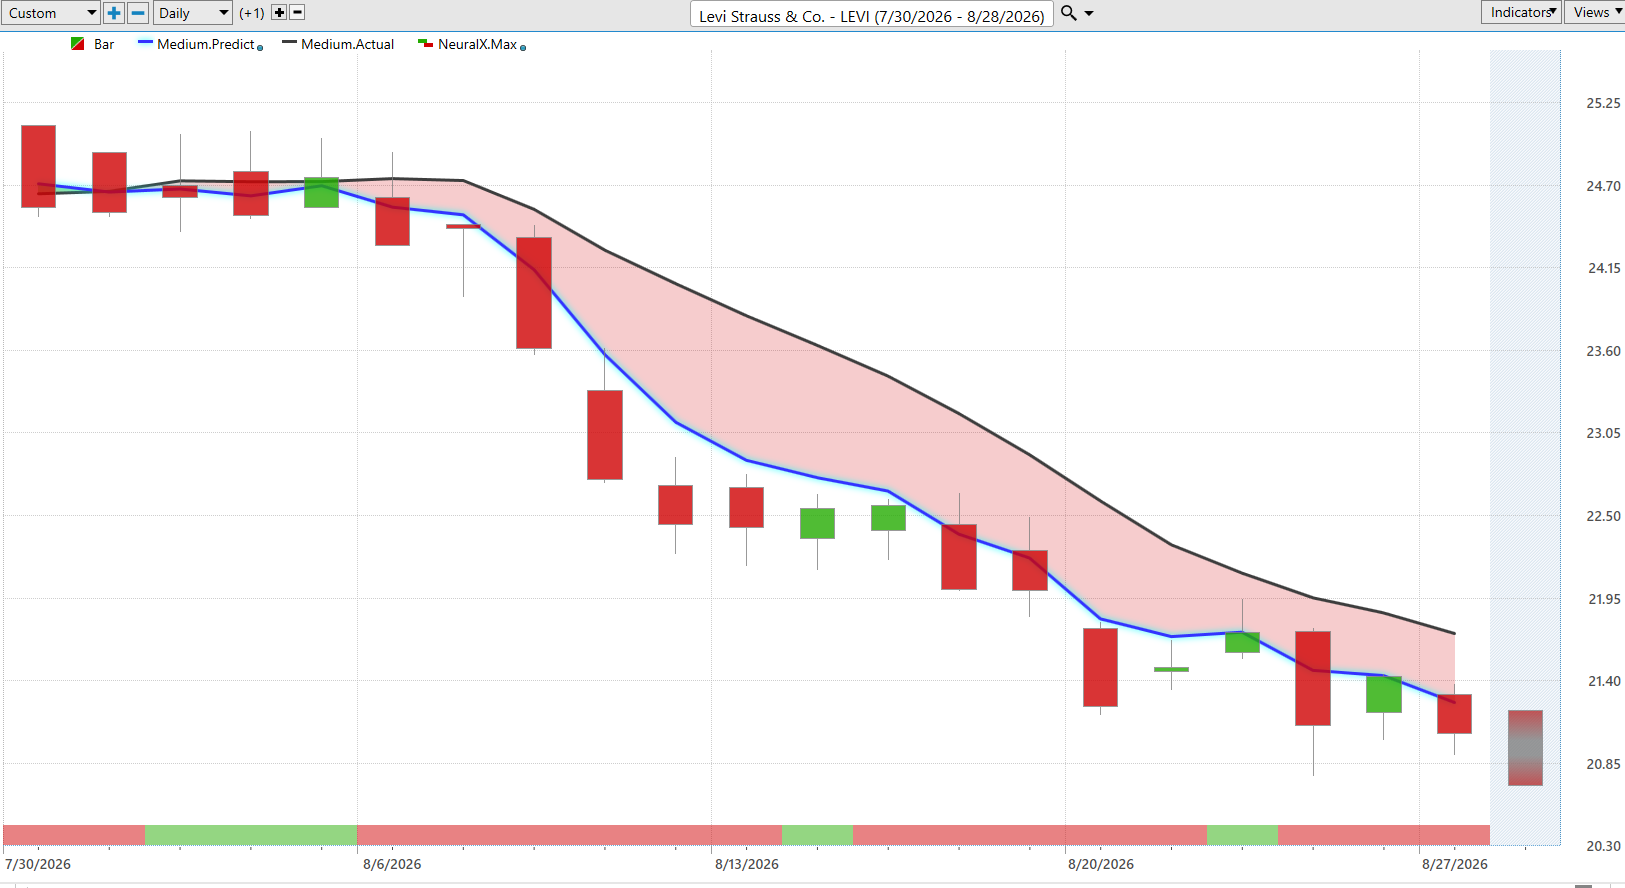
Here’s shares of Levi Strauss, right? So blue line below the black line. And notice this how the neural index goes bullish here. And notice that you don’t just immediately start declining, right? The market stays in this sideways price action, but very clearly it’s letting you know that look, these neural network relationships are actually skewing this to stay on the bearish side, right? It’s it’s looking at those relationships and kind of adding this depressionary effect to forecast where things are likely moving.
Uh and so once the neural index gets bearish, you see, well, now you really get that momentum kicking into the market. So this is a pretty substantial move when there’s not earnings or anything’s going on here. But you can see very clearly a lot of that separation between that predicted moving average and the actual very bearish neural index. And that’s where you see that momentum really kick in. Uh neural index goes bullish here and notice a couple of days of sideways price action before quickly going bearish and then again that very bearish momentum kicking back into the market here. Uh so really nice opportunity on the bearish side here in shares of Levi. uh and just generally you know an area of the market to avoid. So uh this is where we can collectively again use things like the Intelliscan to look at you know whether it be these ERP stocks whether it be uh uh uh you know the pharmaceutical companies and and really identifying those areas of consistent strength and and where we see uh sort of confluence as far as these predictions and vantage point forecast. So about a 14% decline now just over 19 trading days.
Salesforce ($CRM)
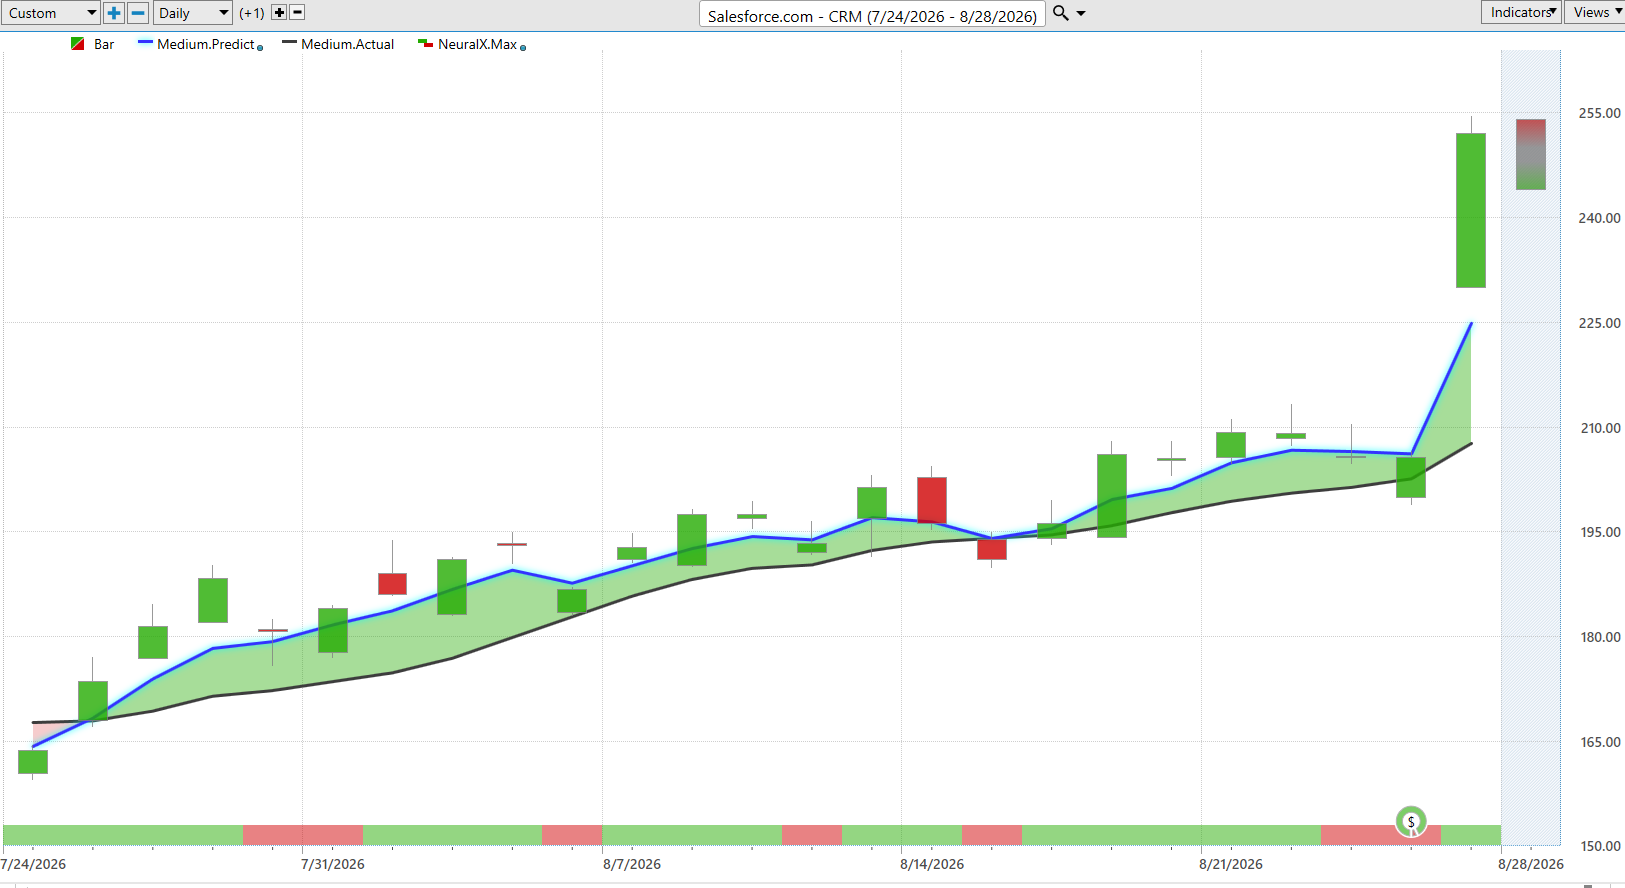
And lastly here, Salesforce, which uh was really the star yesterday with earnings uh and just seeing an extremely strong rally here, about a 50% rally now just over the past 24 trading days. Uh but this all starting you see very early uh going into the end of July, early August and and really all the things bottomed uh quite a while ago really uh going into the early part of July here. Uh so again, we can of course look at those vantage point predicted highs and lows uh and really just offering that roadmap for traders to say look, you want to be a buyer in an uptrend uh and potentially scoop up shares down at these predicted levels. So we’ll go ahead and leave it there for today. Uh but once again, this has been the Vantage Point hot stocks outlook for August 28th, 2026. Thank you all for watching. Best of luck out there and bye for now.


