






Hot Stock Snapshot: Thomson Reuters Corporation ($TRI)
Thomson Reuters Corporation ($TRI) is a content and technology company operating in the Industrials sector and Specialty Business Services industry. Its core businesses serve legal, corporate, tax, accounting, audit, compliance, and news professionals. The company increasingly sits at the intersection of trusted proprietary information, professional workflows, and artificial intelligence.
The investment story surrounding $TRI has become unusually complicated. The underlying business continues to grow, yet the stock has suffered a massive valuation reset as investors question whether generative AI will strengthen Thomson Reuters’ competitive advantages or ultimately disrupt them.
Revenue and Earnings Analysis
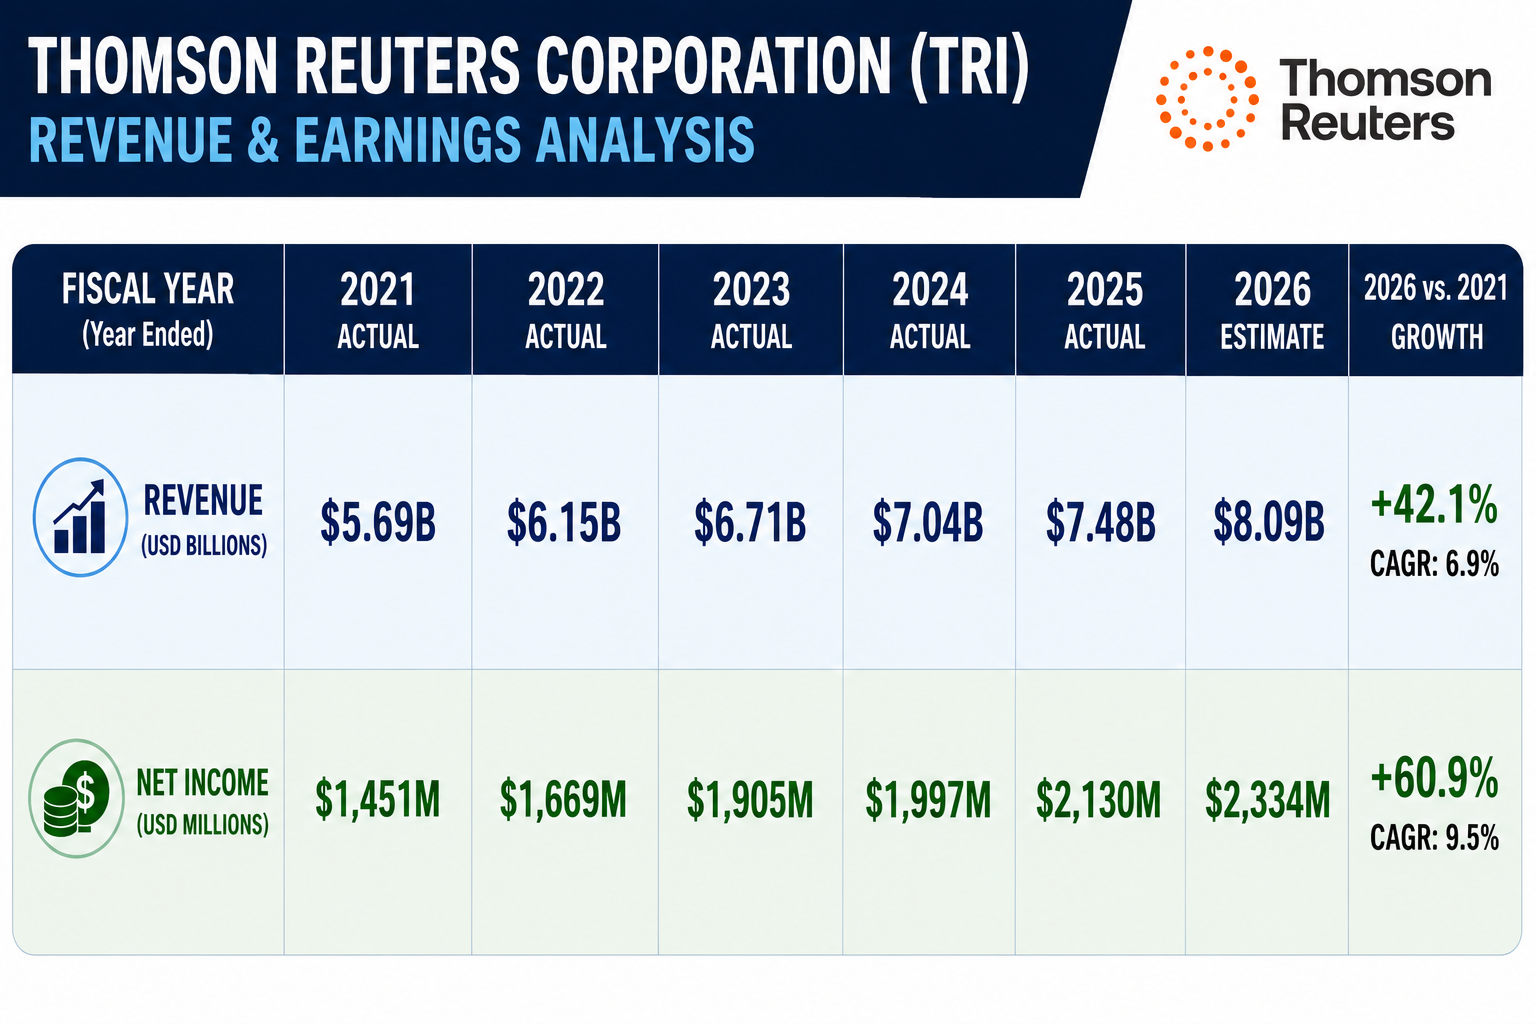
The long-term revenue picture is constructive. According to the financial data provided, revenue has increased from approximately $5.69 billion in 2021 to $7.48 billion in 2025, with the 2026 estimate at approximately $8.09 billion. That represents projected growth of roughly 42.1% from 2021 through 2026, or about a 6.9% compound annual growth rate.
The earnings picture presented in the supplied table is even stronger, with net income shown rising from $1.451 billion in 2021 to an estimated $2.334 billion in 2026, representing approximately 60.9% cumulative growth. However, current StockAnalysis data reports 2025 earnings of about $1.50 billion, down 32.1% from 2024, so the historical net-income figures in the supplied graphic should be independently verified before publication.
Fundamentally, the key takeaway is the contrast between the company’s business trajectory and its stock price. The business has continued growing while the market has dramatically repriced the stock downward.
52-Week High and Low Analysis

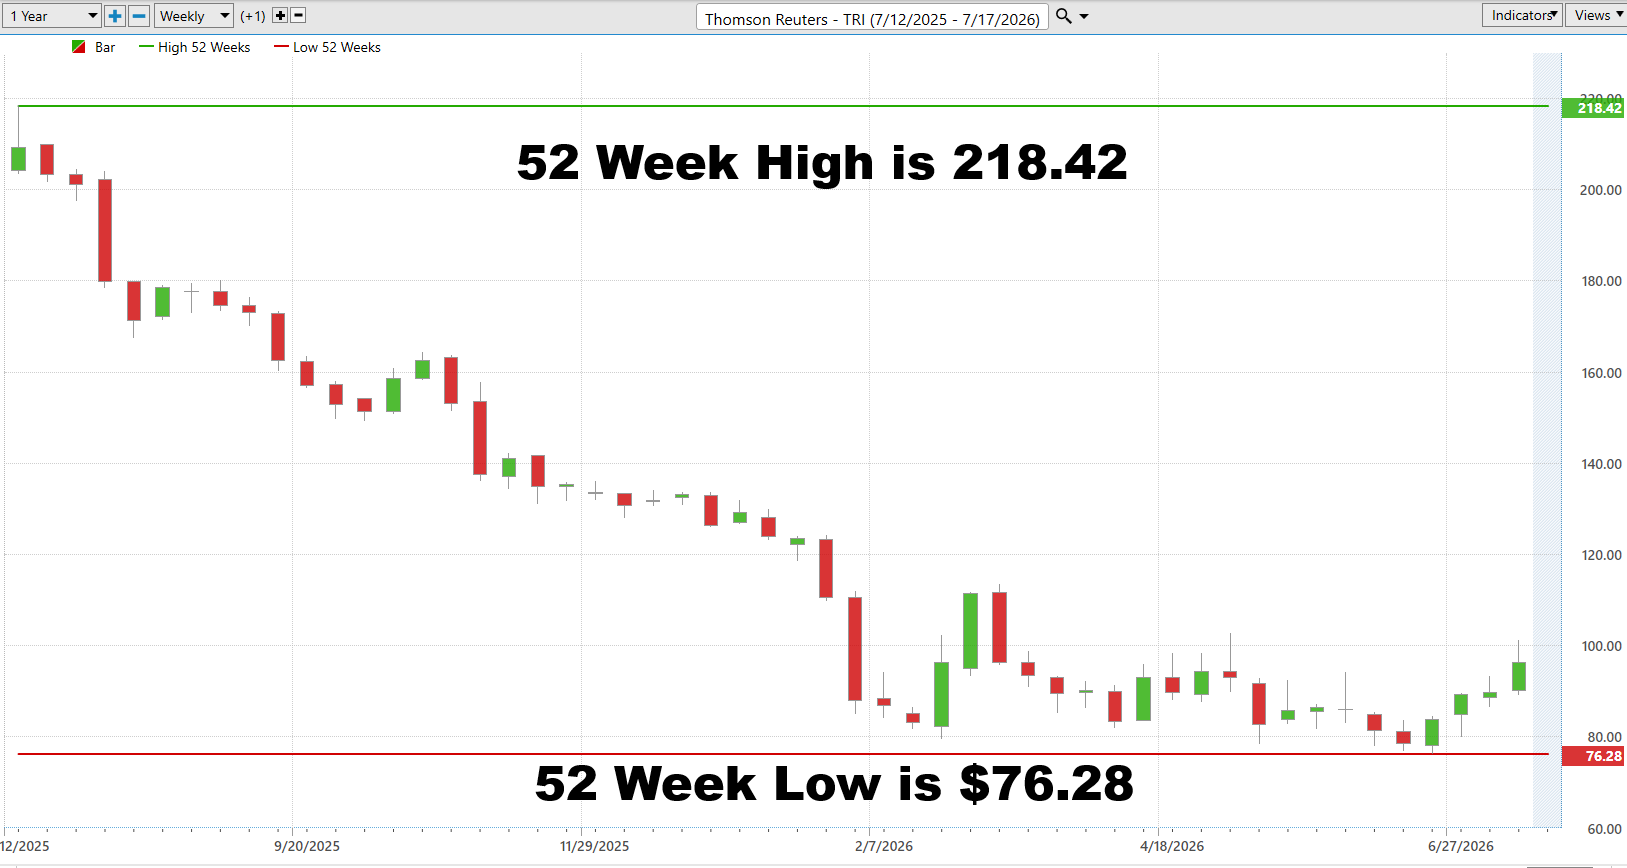
Few numbers tell the $TRI story more clearly than its 52-week boundaries. Based on the supplied chart, the stock traded as high as $218.42 and as low as $76.28, with a last closing price of $96.20.
That creates an enormous $142.14 trading range. At $96.20, the stock sits only about 18.5% of the way from its 52-week low toward its high, leaving it much closer to the bottom of its annual range than the top.
The big-picture trend remains damaged. A stock that falls from above $200 toward $80 has experienced more than an ordinary correction. It has undergone a fundamental reassessment by investors. The important question now is whether the recent rebound represents the beginning of a durable trend reversal or simply another rally inside a much larger bearish trend.
Best-Case Scenario
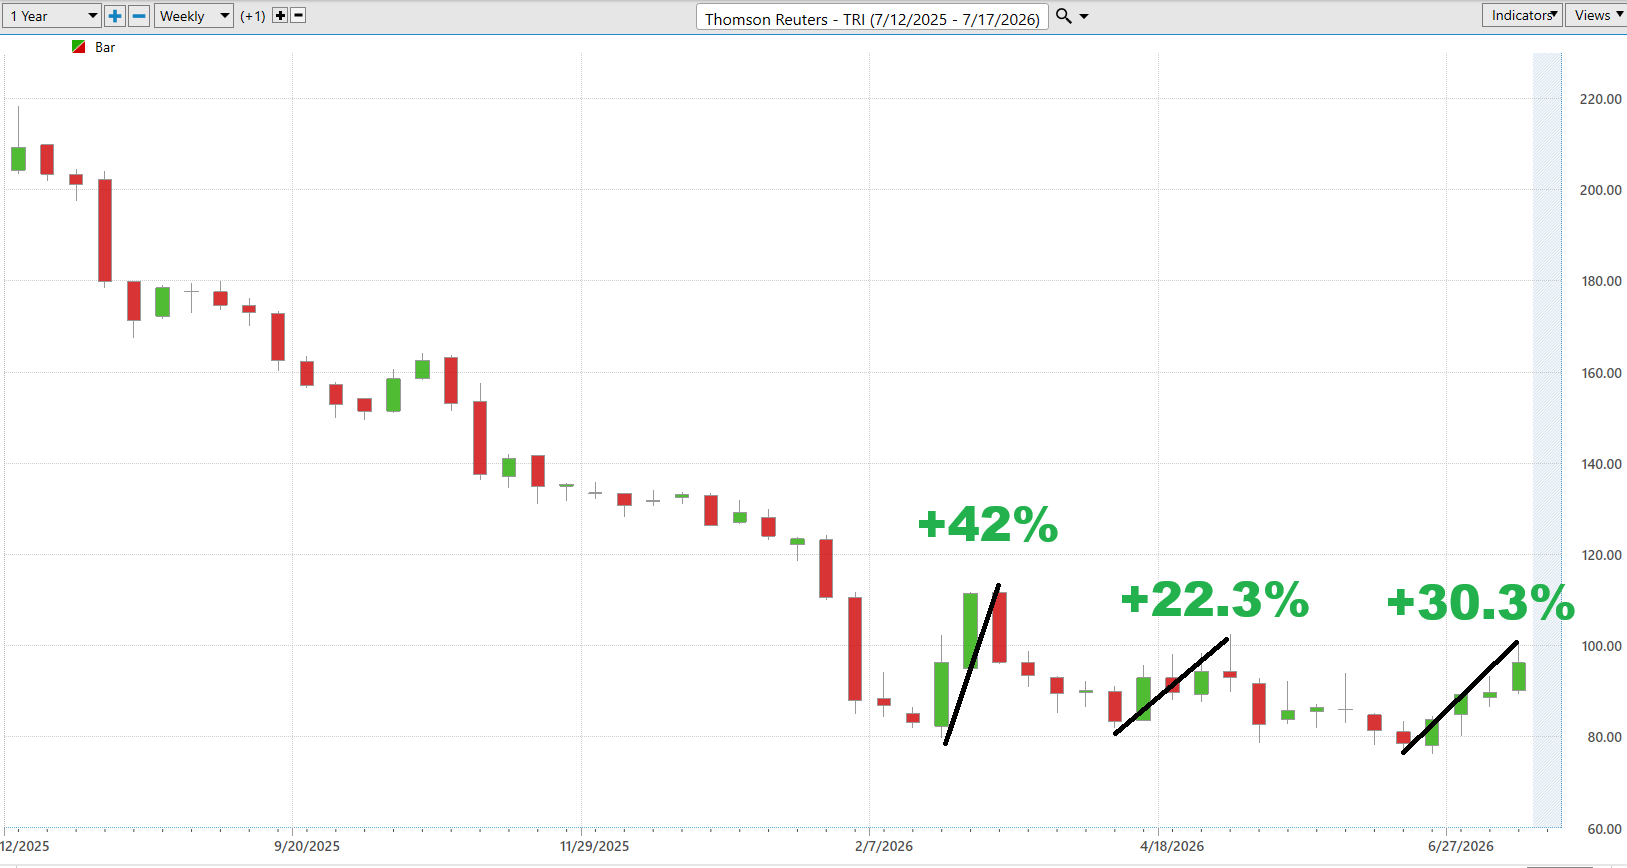
The bullish argument starts with the price action near the lows. After the enormous decline, $TRI has demonstrated an ability to produce increasingly meaningful rallies. The supplied chart highlights advances of approximately 42%, 22.3%, and 30.3% from separate swing lows.
More recently, the stock has advanced sharply from the upper-$70s into the upper-$90s. That suggests buyers are becoming increasingly willing to step in when the stock approaches its lower price boundaries.
Fundamentally, there is also a potential catalyst. Thomson Reuters reported 10% first-quarter 2026 revenue growth and reaffirmed its forecast for 7.5% to 8% full-year revenue growth, emphasizing demand for its AI products across its core professional markets.
If the current recovery develops into a sustained trend, the bulls will want to see $TRI establish progressively higher highs and higher lows. The recent recovery is encouraging, but the stock still has considerable technical damage to repair.
Worst-Case Scenario
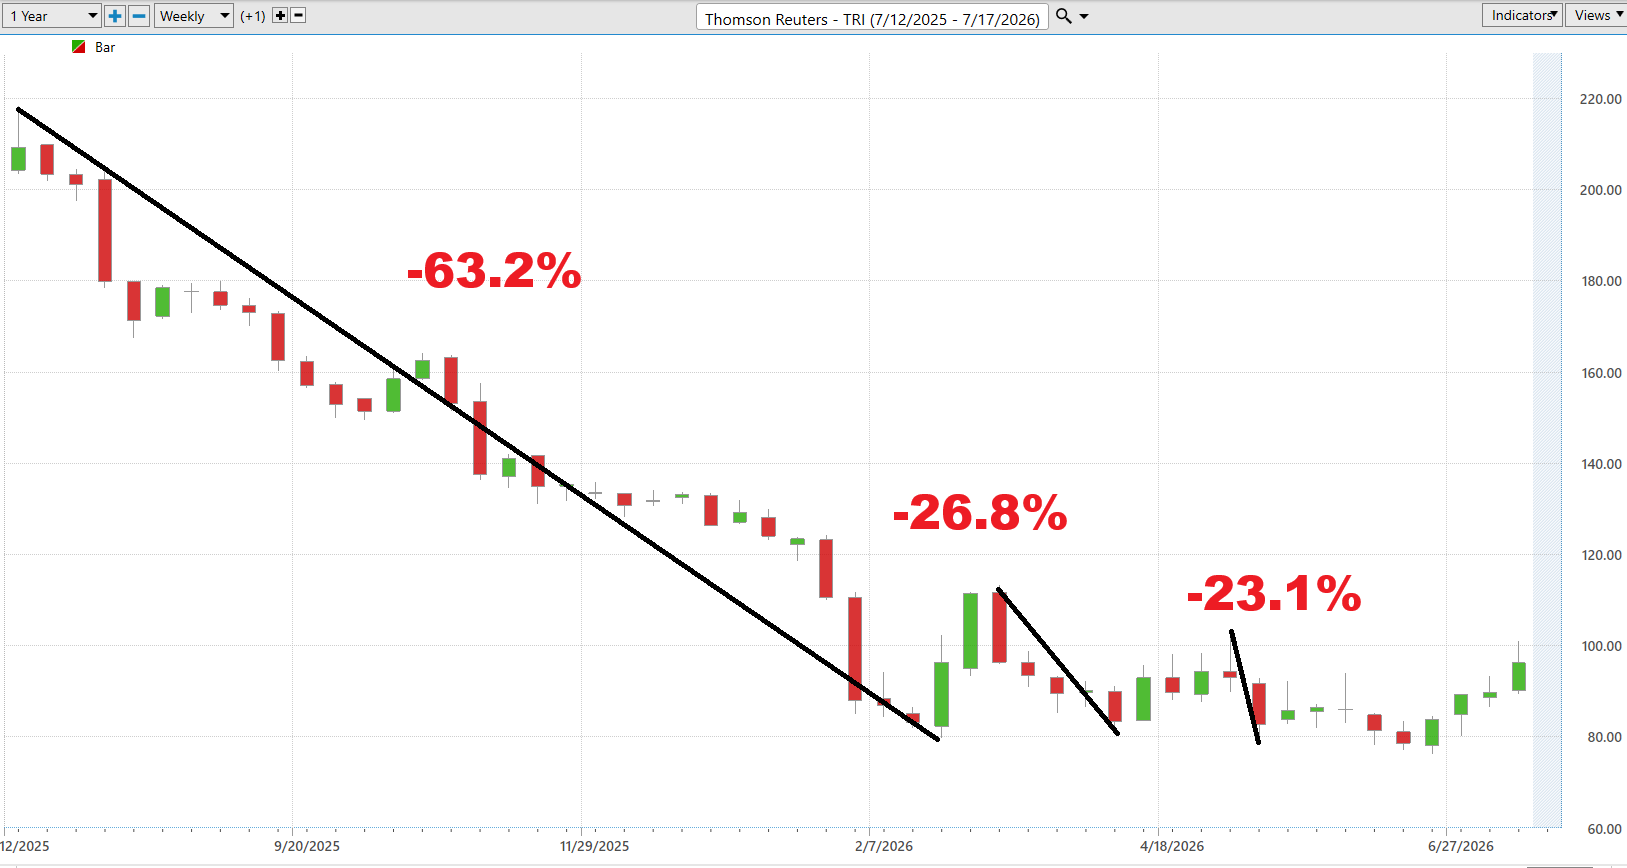
The bearish history cannot be ignored. According to the supplied chart, $TRI experienced a devastating decline of approximately 63.2% from its major high to its subsequent low.
Even after attempting to recover, the stock suffered additional declines of approximately 26.8% and 23.1%. This pattern demonstrates that rallies have repeatedly been met by aggressive selling.
The principal risk is therefore straightforward: the recent rebound could fail. If sellers regain control and the stock begins moving back toward the $76.28 low, traders would need to consider the possibility of another test of that critical support area.
There is also strategic uncertainty. Thomson Reuters recently agreed to sell a 51% stake in its Global Print business to KKR for approximately $500 million, sharpening its focus on legal, corporate, tax, audit, accounting, and AI-driven professional solutions. The transaction could improve strategic focus, but it also underscores how aggressively the company is repositioning itself as its traditional businesses evolve.
Predictive Blue Line Analysis
The VantagePoint Predictive Blue Line is currently presenting a much more constructive short-term picture than the 52-week chart.
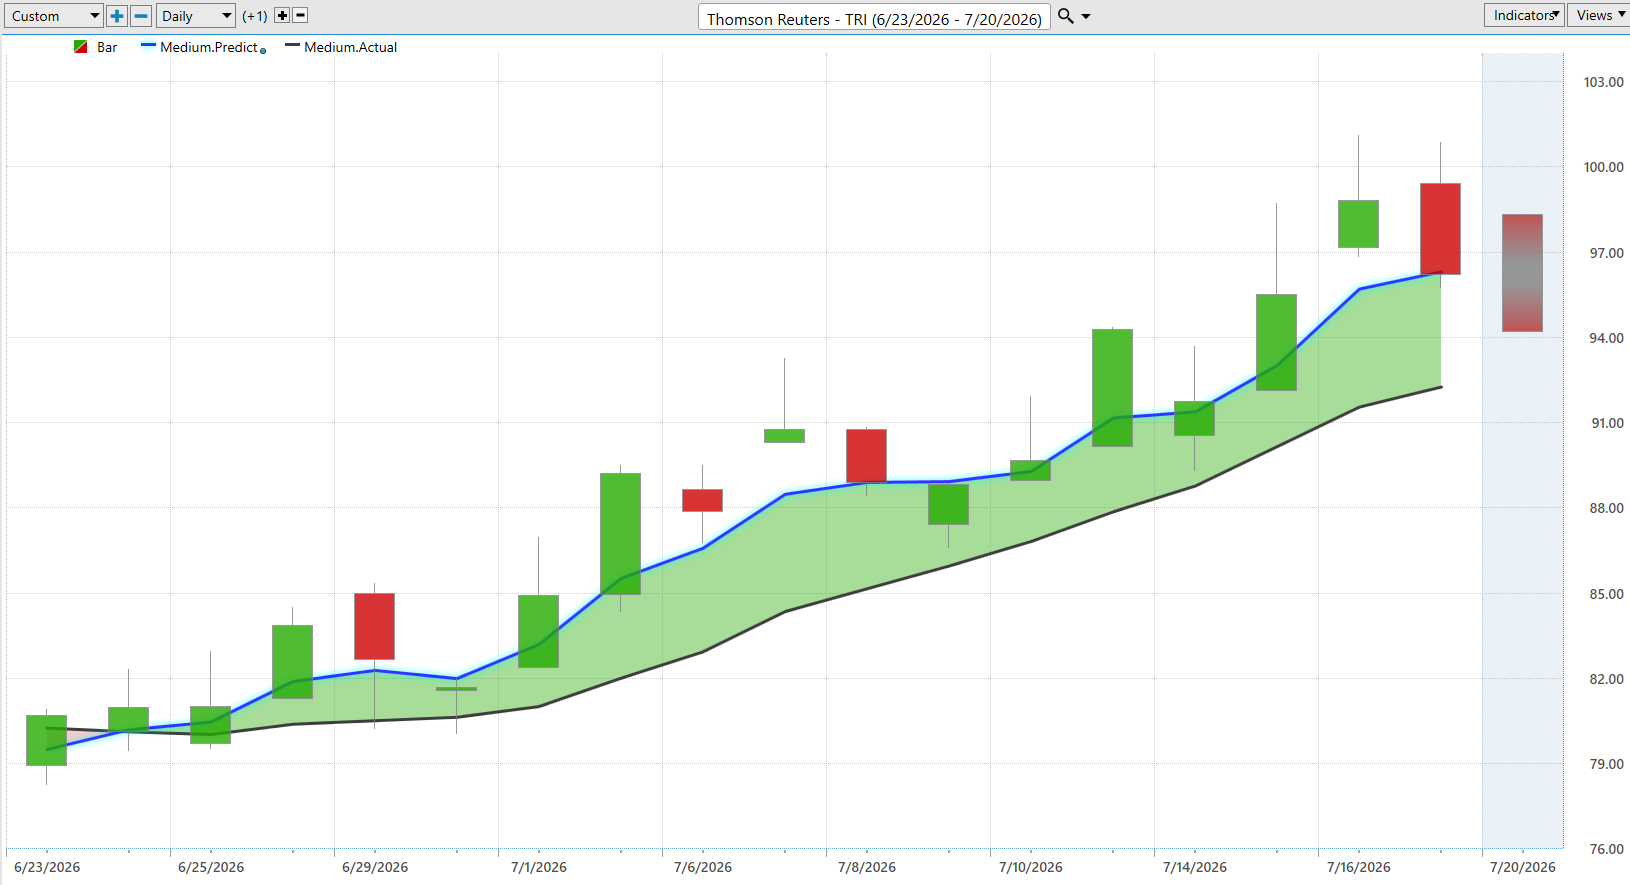
In the supplied chart, the Predictive Blue Line is rising and remains above the black actual moving average. Price has advanced from roughly $80 into the upper-$90s while the predictive trend has moved steadily higher.
This indicates that the short-term trend bias remains bullish. As long as the Predictive Blue Line continues rising and price maintains its relationship with that trend, traders have evidence that the recent recovery remains intact.
The important distinction is time frame. The long-term trend has suffered severe damage, but the short-term trend has turned bullish. Traders should not confuse one with the other.
Neural Index Analysis
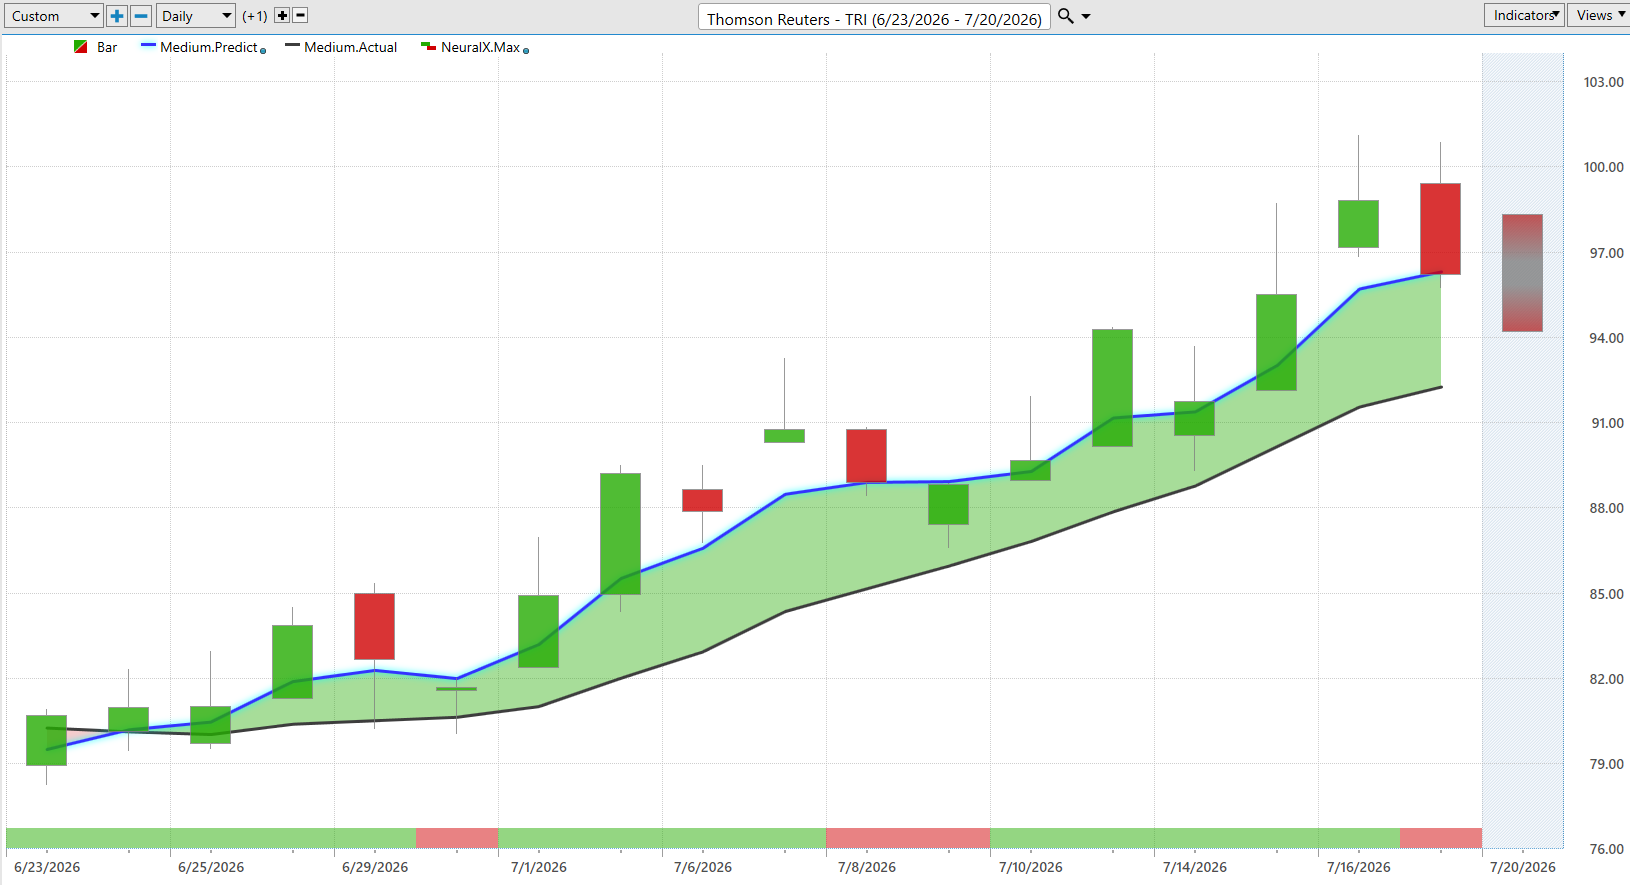
The Neural Index adds another layer to the short-term picture. Throughout much of the recent advance, the indicator has remained positive, supporting the bullish movement identified by the Predictive Blue Line.
However, the most recent reading in the supplied chart has turned negative. That creates a short-term caution signal even though the broader Predictive Blue Line trend remains bullish.
This is where double confirmation becomes important. The rising Predictive Blue Line favors the bulls, but the Neural Index suggests traders should be prepared for near-term weakness or consolidation. A return to positive Neural Index readings alongside a rising Predictive Blue Line would provide stronger confirmation that buyers are regaining control.
Comparison Metrics
The relative-performance numbers reveal the central contradiction surrounding $TRI.

Over the past year, Thomson Reuters has declined approximately 53.44%, while the S&P 500 gained 18.27%, the Nasdaq Composite gained 21.67%, the Dow gained 17.65%, and the Russell 2000 gained 32.77%. The six-month and year-to-date comparisons are similarly poor, with $TRI down 21.74% over six months and 25.04% year to date.
But the short-term picture has flipped dramatically. Over the past month, $TRI gained 25.67%, while the S&P 500 declined 0.20%. Over the latest week shown, TRI gained 6.71%, while all four major benchmarks declined.
That is the most interesting development in the entire snapshot. A long-term laggard has suddenly become a short-term leader.
Our Suggestion
$TRI is a turnaround watchlist candidate, not yet a clean long-term momentum story.
The stock has been brutally punished, falling from above $200 to below $80, and its annual and year-to-date relative performance remains dramatically worse than the broader market. But something has changed recently. The stock is outperforming sharply over the one-month and one-week periods, the Predictive Blue Line has turned higher, and the fundamental business continues to report revenue growth.
For traders, the opportunity is in watching whether this short-term strength can mature into a genuine trend reversal. The key battleground is between improving short-term momentum and a severely damaged long-term trend.
The bulls need continued higher highs, higher lows, a rising Predictive Blue Line, and renewed positive confirmation from the Neural Index. The bears need the rebound to fail and price to begin retreating toward the lower end of the 52-week range.
At $96.20, with a current StockAnalysis analyst consensus of Buy and an average 12-month price target of approximately $119.33, the market sees potential upside, but the extraordinary distance from the stock’s former highs demonstrates just how much confidence has been lost.
Put $TRI on the radar. The business is growing. The stock has been crushed. Short-term momentum is improving. Now the market has to prove that the turnaround is real.
Ready to learn more about forecasting stocks and options days before anyone else with up to 87.4% proven accuracy?
Attend a FREE LIVE CLASS.
It’s not magic.
It’s machine learning.
THERE IS A SUBSTANTIAL RISK OF LOSS ASSOCIATED WITH TRADING. ONLY RISK CAPITAL SHOULD BE USED TO TRADE. TRADING STOCKS, FUTURES, OPTIONS, FOREX, AND ETFs IS NOT SUITABLE FOR EVERYONE.IMPORTANT NOTICE!
DISCLAIMER: STOCKS, FUTURES, OPTIONS, ETFs AND CURRENCY TRADING ALL HAVE LARGE POTENTIAL REWARDS, BUT THEY ALSO HAVE LARGE POTENTIAL RISK. YOU MUST BE AWARE OF THE RISKS AND BE WILLING TO ACCEPT THEM IN ORDER TO INVEST IN THESE MARKETS. DON’T TRADE WITH MONEY YOU CAN’T AFFORD TO LOSE. THIS ARTICLE AND WEBSITE IS NEITHER A SOLICITATION NOR AN OFFER TO BUY/SELL FUTURES, OPTIONS, STOCKS, OR CURRENCIES. NO REPRESENTATION IS BEING MADE THAT ANY ACCOUNT WILL OR IS LIKELY TO ACHIEVE PROFITS OR LOSSES SIMILAR TO THOSE DISCUSSED ON THIS ARTICLE OR WEBSITE. THE PAST PERFORMANCE OF ANY TRADING SYSTEM OR METHODOLOGY IS NOT NECESSARILY INDICATIVE OF FUTURE RESULTS. CFTC RULE 4.41 – HYPOTHETICAL OR SIMULATED PERFORMANCE RESULTS HAVE CERTAIN LIMITATIONS. UNLIKE AN ACTUAL PERFORMANCE RECORD, SIMULATED RESULTS DO NOT REPRESENT ACTUAL TRADING. ALSO, SINCE THE TRADES HAVE NOT BEEN EXECUTED, THE RESULTS MAY HAVE UNDER-OR-OVER COMPENSATED FOR THE IMPACT, IF ANY, OF CERTAIN MARKET FACTORS, SUCH AS LACK OF LIQUIDITY. SIMULATED TRADING PROGRAMS IN GENERAL ARE ALSO SUBJECT TO THE FACT THAT THEY ARE DESIGNED WITH THE BENEFIT OF HINDSIGHT. NO REPRESENTATION IS BEING MADE THAT ANY ACCOUNT WILL OR IS LIKELY TO ACHIEVE PROFIT OR LOSSES SIMILAR TO THOSE SHOWN.