


When I was younger, I swam competitively. One of the most valuable lessons that sport taught me wasn’t just about discipline or endurance, it was how to think about time. In swimming, time isn’t just a stopwatch reading. It’s a framework. It tells you where you are, where you’re going, and whether your pace will get you there.
Trading works the same way.
Many traders focus solely on price. But experienced ones know it’s price over time that reveals the real story. Implied Volatility (IV) offers a forward-looking gauge — but only becomes useful when compared against historical ranges. Understanding how far an asset has typically moved over different time frames allows you to separate signal from noise.
That’s the power of context. By aligning past behavior with present conditions, we gain insight into what might happen next — not through guesswork, but through probability.
Implied volatility whispers the market’s fears, expectations, and secrets — if you know how to listen. And the $VIX? That’s the loudspeaker.
Created in 1993 by the Chicago Board Options Exchange, the $VIX distills the implied volatility of S&P 500 options into a single number reflecting Wall Street’s 30-day outlook. Low readings suggest calm. Spikes mean turbulence ahead — even if the surface looks calm.
If you’re serious about trading, you need to track IV. It’s not advanced, it’s absolutely essential. Without it, you’re flying blind in a storm.
The good news? You don’t need to spend a dime to access it, many major brokerages and trading sites will give you access to it.
Bottom line: Wall Street uses IV. So should you.
Why? Because IV doesn’t predict direction — it forecasts magnitude. High $VIX? Expect wide swings. Low $VIX? Likely tight ranges. It’s about how bumpy the ride could get, not which way it’s headed.
Take the five-year $VIXY chart: a high near 41.46%, a low around 14%. That range matters. A 14% reading is calm waters. A 41% reading? Hurricane watch. High IV means rapid price moves and spiked emotions. Low IV means tighter, more stable trading ranges.
It’s like driving — same vehicle, but a dry road versus one covered in ice. The risks are different, and so is your approach.
The $VIX isn’t just a number, it’s the market’s mood ring. When you understand the mood, you can trade smarter.
IV isn’t just about market uncertainty, it’s Wall Street’s price tag on potential chaos. When IV rises, options get expensive. When it drops, they’re on sale. But deeper still, institutions use IV forecasts to define probable price zones and structure trades accordingly. They’re not guessing — they’re managing risk through strategies like covered calls and cash-secured puts.
IV is a tactical blueprint. When low, buying options becomes cost-effective. When high, selling options can yield rich premiums. It’s not just sentiment—it’s the architecture of professional trading. Covered calls, put spreads, calendars—these strategies don’t just benefit from IV — they rely on it. IV helps traders frame price ranges and define probability zones, pricing risk accordingly.
Think of IV as the options market’s rumor about the future. It doesn’t predict outcomes — it whispers expected movement. Institutions selling options are essentially writing insurance based on that whisper. High IV? Overpriced insurance. Low IV? Cheap coverage. And those calendar spreads and covered calls? They’re less about being right, more about monetizing uncertainty.
This is where Wall Street operates — not in the headlines, but in the machinery underneath. The pros don’t chase momentum. They sell options on stocks they already want to own. It’s not gambling — it’s structured discipline.
IV is a neon sign — “On Sale” or “Premium Pricing” — flashing on every option. If you ignore it, you’re walking into a street fight blind. The pros don’t guess. They measure. They use IV like a sniper uses a scope.
Want income? Covered calls and cash-secured puts work best when you price risk properly. High volatility? Charge top dollar. Low volatility? Go shopping. Either way, IV tells you the battlefield. Without it, you’re not even in the fight.
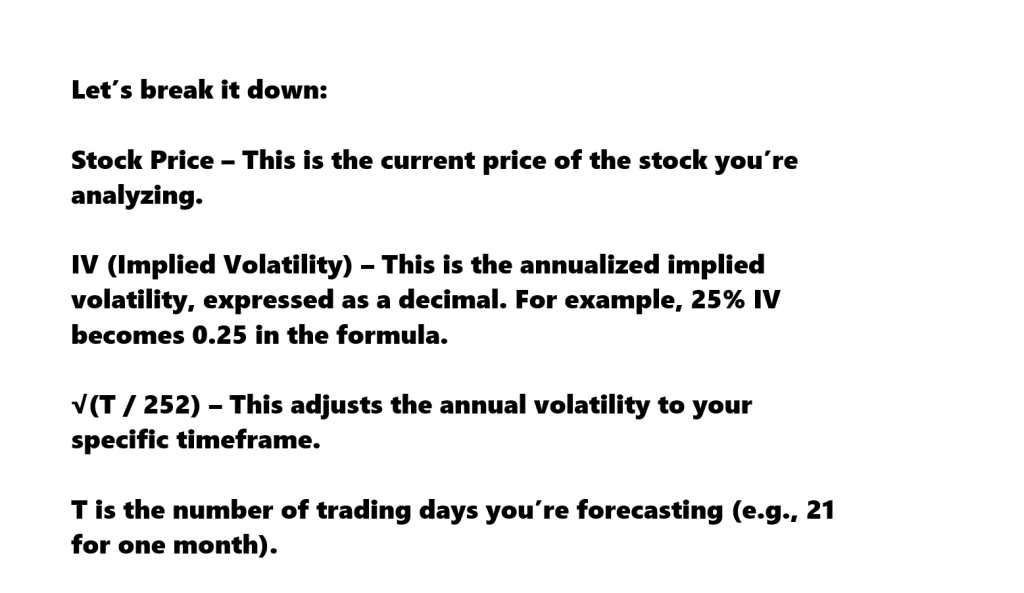
Here’ the concept that powers all of this: the normal distribution curve.
When the math is applied, it becomes practical:
Expected Move = Price × IV × √(T / 252).
You’ve probably seen it — bell-shaped, floating in finance books like some sacred scroll. It’s not magic. It’s how randomness behaves under typical conditions.
At the center? The average — the most likely outcome. One standard deviation captures 68% of outcomes. Two standard deviations? 95%. Three? 99.7%. This is probability theory 101. It’s how casinos profit. It’s how traders separate lotto tickets from smart bets.
It doesn’t predict the future. It frames the likelihood of outcomes.
And when you understand that? You stop gambling and start calculating.
Implied volatility helps define these ranges. A 25% IV on a $200 stock? That’s a forecasted move of about $50 in either direction over the next year. That’s your 68% zone. Go beyond that? You’re stepping into the tails of the curve — where the big money plays its edge.
This math isn’t for academics — it’s for anyone serious about risk. Use it, and you’re trading with precision.
Let’s apply it to the $SPY, currently priced at $632.78, with a current IV of 17.88%, and historical extremes of 14% (low) and 41.46% (high). Using the expected move formula:
Expected Move = Price × IV × √(T / 252)
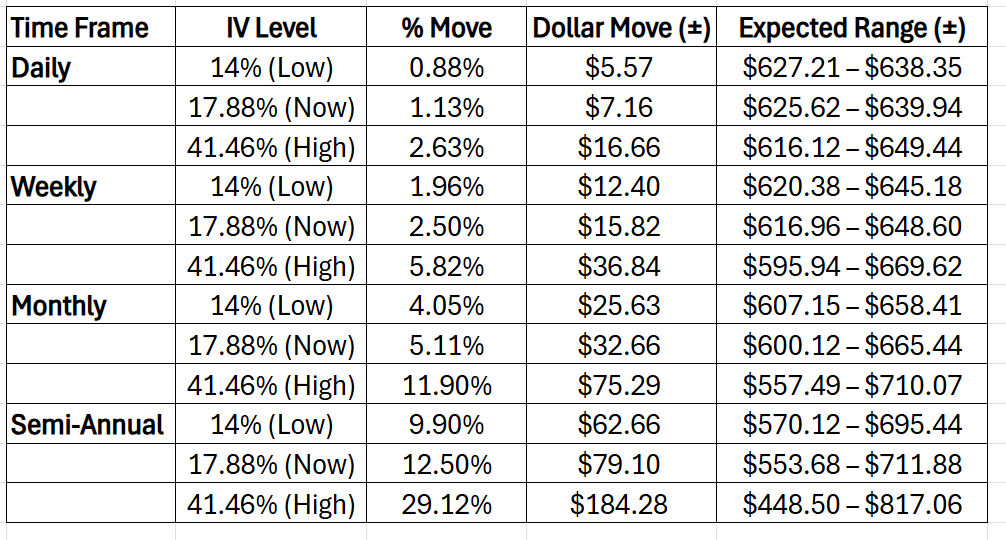
We calculate the probable range over daily, weekly, monthly, and semi-annual time frames. As volatility increases, the expected range widens. That’s the visual power of the volatility cone — and why it matters.
Retail traders often miss this. They trade on gut feel. Headlines. Hype. But real pros use math. They calculate, plan, and prepare. Implied volatility is the market’s consensus on risk. It’s not a guarantee. It’s a map of what’s likely.
And in this game, knowing what’s likely is everything.
So, stop guessing. Start measuring. Use implied volatility not as a prediction, but as a tool — a tactical framework for how far, how fast, and how rough the road might be.
Because the traders who survive? They don’t wait for miracles. They trade with math. With margins of safety. With probabilities.
And that, right there, is how you could win.
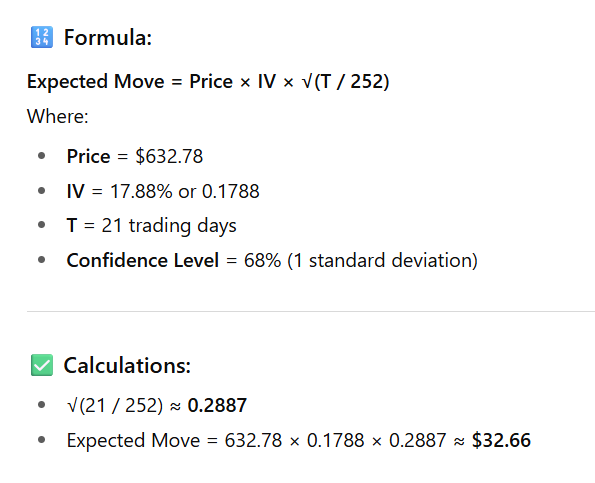
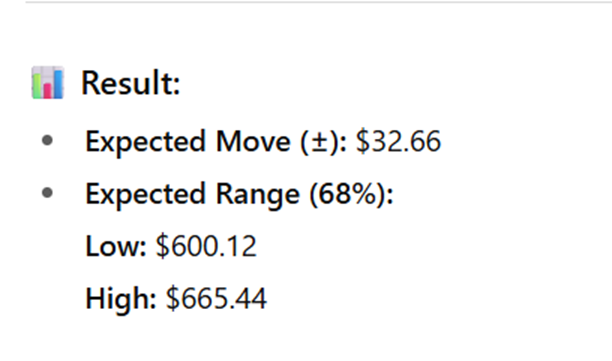
Here is the final result telling us that over the next 21 trading days the expected range with a 68% confidence factor is $6001.12 on the downside and $665.44 on the upside.
If you wanted a 95% confidence factor you would need to apply two standard deviations. If you wanted a 99% confidence factor you would apply three standard deviations.
Here’s something every trader — and every serious investor — ought to know:
The $SPY now has options that expire every single trading day. That’s right, daily expirations. Monday through Friday, without exception. It’s a seismic shift in the way this market operates, and it’s not just about convenience, it’s about strategy.
And what’s driving these trades? Implied Volatility.
Institutions aren’t throwing darts at a board. They’re using probability models — rigorous, precise, and relentless — to determine exactly which options to sell, when to sell them, and how far the underlying asset can reasonably move within a day.
This is not gambling. This is not guesswork. This is math.
With daily expirations, traders now price risk in 24-hour cycles. That means implied volatility becomes the heartbeat of the entire strategy — used aggressively, systematically, and without emotion.
The big players? They’re not hoping. They’re calculating.
And if you’re not watching implied volatility? If you’re not thinking probabilistically? Then you’re not trading with the pros — you’re trading against them.
Stay sharp. The market has changed.
For options traders, volatility is the heartbeat of the entire strategy. But beyond the headline number, what’s essential is the direction of that volatility. Is it holding steady? Contracting? Expanding?
When implied volatility is falling, the advantage subtly shifts toward the option sellers. The contracts they’ve sold — often at a premium — gradually lose value as uncertainty dissipates, tilting the odds in their favor. In a market where time decay is always at work, declining volatility compounds their edge.
Conversely, rising volatility tends to benefit the buyer. Even if the underlying asset remains unchanged, the market’s increasing expectation of movement inflates option premiums. That elevation alone can turn a previously neutral trade profitable.
At the core of it all is an idea that’s as old as derivatives markets themselves: elasticity.
Option pricing stretches and contracts, not unlike a rubber band. When that band stretches — when premiums rise — it reflects growing risk expectations over the same time frame. Successful options trading, then, is not just about direction or timing. It’s about understanding how volatility expands and contracts — and knowing which side of the trade stands to gain from that tension.
Every trader faces the same uphill battle…
How do you cut through the noise — an avalanche of charts, headlines, predictions, and opinion — and consistently make smart, profitable decisions?
The truth? Most don’t.
Volatility is rising. The rules are shifting. And the old playbook — the one built on “buy and hold” faith — is being torn to pieces.
But here’s the secret that savvy traders already know…
We’re not in the same market we were five years ago. We’ve entered a Brave New Financial World — one shaped by artificial interest rates, global monetary experiments, and unprecedented uncertainty.
When central banks pushed interest rates into negative territory, they weren’t solving a problem. They were creating new ones.
And now? If the Federal Reserve doesn’t’ cut interest rates through 2025 as they’ve signaled, expect the tremors to grow stronger. Volatility won’t just return, it will explode.
So, what’s a smart trader to do?
You adapt. You evolve. You upgrade your tools.
Enter: Artificial Intelligence.
Not as a novelty. Not as a luxury. But as a necessity.
Today’s A.I. trading systems don’t just help. They guide. They filter out noise and reveal the statistically sound moves — the ones with real probability behind them.
This is no longer reserved for billion-dollar hedge funds. Main Street traders are using A.I. to get institutional-grade results.
Smaller accounts. Bigger wins. Lower stress. Higher certainty.
If you’ve ever felt like the markets are rigged against you… if you’ve watched your hard-earned savings tossed around by headlines and algorithms… it’s time to reclaim control.
Join us for a free, live online training.
You’ll discover exactly how traders are using A.I. to reduce risk, increase returns, and bring clarity to chaos.
It’s not magic.
It’s machine learning.
Make it count.
THERE IS A SUBSTANTIAL RISK OF LOSS ASSOCIATED WITH TRADING. ONLY RISK CAPITAL SHOULD BE USED TO TRADE. TRADING STOCKS, FUTURES, OPTIONS, FOREX, AND ETFs IS NOT SUITABLE FOR EVERYONE.IMPORTANT NOTICE!
DISCLAIMER: STOCKS, FUTURES, OPTIONS, ETFs AND CURRENCY TRADING ALL HAVE LARGE POTENTIAL REWARDS, BUT THEY ALSO HAVE LARGE POTENTIAL RISK. YOU MUST BE AWARE OF THE RISKS AND BE WILLING TO ACCEPT THEM IN ORDER TO INVEST IN THESE MARKETS. DON’T TRADE WITH MONEY YOU CAN’T AFFORD TO LOSE. THIS ARTICLE AND WEBSITE IS NEITHER A SOLICITATION NOR AN OFFER TO BUY/SELL FUTURES, OPTIONS, STOCKS, OR CURRENCIES. NO REPRESENTATION IS BEING MADE THAT ANY ACCOUNT WILL OR IS LIKELY TO ACHIEVE PROFITS OR LOSSES SIMILAR TO THOSE DISCUSSED ON THIS ARTICLE OR WEBSITE. THE PAST PERFORMANCE OF ANY TRADING SYSTEM OR METHODOLOGY IS NOT NECESSARILY INDICATIVE OF FUTURE RESULTS. CFTC RULE 4.41 – HYPOTHETICAL OR SIMULATED PERFORMANCE RESULTS HAVE CERTAIN LIMITATIONS. UNLIKE AN ACTUAL PERFORMANCE RECORD, SIMULATED RESULTS DO NOT REPRESENT ACTUAL TRADING. ALSO, SINCE THE TRADES HAVE NOT BEEN EXECUTED, THE RESULTS MAY HAVE UNDER-OR-OVER COMPENSATED FOR THE IMPACT, IF ANY, OF CERTAIN MARKET FACTORS, SUCH AS LACK OF LIQUIDITY. SIMULATED TRADING PROGRAMS IN GENERAL ARE ALSO SUBJECT TO THE FACT THAT THEY ARE DESIGNED WITH THE BENEFIT OF HINDSIGHT. NO REPRESENTATION IS BEING MADE THAT ANY ACCOUNT WILL OR IS LIKELY TO ACHIEVE PROFIT OR LOSSES SIMILAR TO THOSE SHOWN.


