


What separates the pros from the amateurs in trading?
It’s the ability to identify strength — and ride it.
In a market filled with noise, headlines, and conflicting opinions, relative strength gives traders a powerful edge. It shows you what’s working, what’s not, and where your capital has the best odds of compounding.
This article will show you exactly what relative strength is, where it came from, how it’s calculated, and how to use it to help you beat the market.
Relative strength is a measure of how one stock (or any tradable asset) is performing compared to another — usually a benchmark like the S&P 500 or a sector specific ETF.
It’s a way of asking: “Is this stock stronger or weaker than the rest of the market?”
If Stock A is up 15% over the past 3 months and Stock B is only up 5%, Stock A has greater relative strength. If the S&P 500 is flat or down during that same period, Stock A’s outperformance becomes even more significant.
This is not the same as the Relative Strength Index which was created in the 1970’s by Welles Wilder.
While traders have always looked for strong stocks, it wasn’t until Robert Levy published his 1968 study, Relative Strength as a Criterion for Investment Selection, that the concept of Relative Strength became systematic.
Levy’s research showed that buying the top 10% of stocks based on their six-month price performance often led to market-beating returns. In other words, strength tends to persist.
Levy’s research was the first to statistically demonstrate that stocks showing strong price performance over a prior period (typically 6 to 12 months) tended to continue outperforming in the near future. He laid out a system for ranking stocks based on their historical performance and proved that buying the top-ranked stocks often led to better returns than the market average.
While earlier market observers like Charles Dow and Richard D. Wyckoff discussed the idea of “market leadership” and “demand strength” in more qualitative terms, it was Robert Levy who turned relative strength into a measurable, data-driven strategy.
🧠 Quote from Robert Levy’s 1968 Dissertation
“There is strong evidence that common stocks which have exhibited superior price strength in the past will maintain superior price strength in the future, at least over short to intermediate periods.”
— Robert A. Levy, Relative Strength as a Criterion for Investment Selection, 1968
This simple, data-backed insight turned Wall Street’s traditional thinking on its head. At the time, many believed that past performance was irrelevant. Levy proved otherwise. His findings laid the groundwork for what we now recognize as momentum investing — a strategy embraced by hedge funds, index providers, and academic finance.
Robert Levy’s work didn’t just introduce a tool. It redefined the way we evaluate performance in markets. His relative strength model gave traders a lens that cuts through emotion and opinion — and delivers actionable insight.
As computers made trading data more accessible, professional investors embraced relative strength as a core part of their strategy. It became a foundational element in momentum investing, sector rotation models, and even smart beta ETFs.
Today, hedge funds, mutual funds, and retail traders all rely on some form of relative strength analysis to guide decision-making.
How to Calculate Relative Strength
The formula for basic relative strength is simple:
Relative Strength = (Price of Stock A) / (Price of Benchmark)
To make it useful, we compare this ratio over time. If it’s going up, Stock A is outperforming. If it’s going down, it’s lagging.
You can also use percentage changes over a fixed period. For example:
- Stock A: +20% over 6 months
- Benchmark: +5% over 6 months
- → Relative outperformance = 15%
Most charting and trading platforms will plot a relative strength line or rank, saving you the math.
In a market gripped by volatility and speculation, relative strength isn’t just a nice-to-know metric — it’s a beacon of sanity. Relative strength tells us which stocks are outperforming and which are fading, and that kind of clarity is priceless when capital is on the line. Professional traders and serious investors alike know that leadership matters, and relative strength puts a spotlight on it.
You can think of relative strength as your market truth serum. It compares the performance of one stock against another — or against an entire index like the S&P 500 — and it doesn’t lie. If a stock’s outperforming the benchmark, it’s flashing a sign of institutional demand. And where the big money goes, smart traders follow. It’s the difference between chasing headlines and acting on reality, and in today’s market, that difference can mean everything.
What makes Relative Strength so compelling is its versatility, its flexibility, and above all — its philosophy. This isn’t just another technical indicator buried inside a charting platform. It’s a lens, a way of thinking that reshapes how traders, portfolio managers, and even corporate executives view performance. At its core, Relative Strength teaches a simple, powerful truth: strength matters — and if you don’t know what’s strong or weak, you’re not trading, you’re guessing.
The beauty of Relative Strength lies in how adaptable it is. Your benchmark doesn’t need to be the S&P 500. It can be a rival company, an industry group, or a custom index built around your objectives. If you’re a fund manager, your benchmark might be your fund category or peer group. If you’re a CEO, it could be a competing firm you’re aiming to outperform. The framework remains the same: Who’s leading, who’s lagging, and where is capital flowing?
And unlike rigid, backward-looking metrics, Relative Strength adjusts gracefully across time frames. Swing traders may apply it to three-week moves. Institutional investors might focus on trailing six- or twelve-month performance. The philosophy is timeless — even as the time frame flexes. What remains constant is the focus on persistence of outperformance, a core tenet of modern momentum theory and a strategy that has stood up to decades of academic scrutiny.
But Relative Strength doesn’t operate in a vacuum. Once you’ve identified what’s outperforming (whether it’s a stock, a sector, or a strategy) that’s when the real work begins. You bring in tools like artificial intelligence, machine learning, earnings analysis, and volume flow models to separate durable leadership from temporary noise. Relative Strength gives you a short list. The rest is precision work.
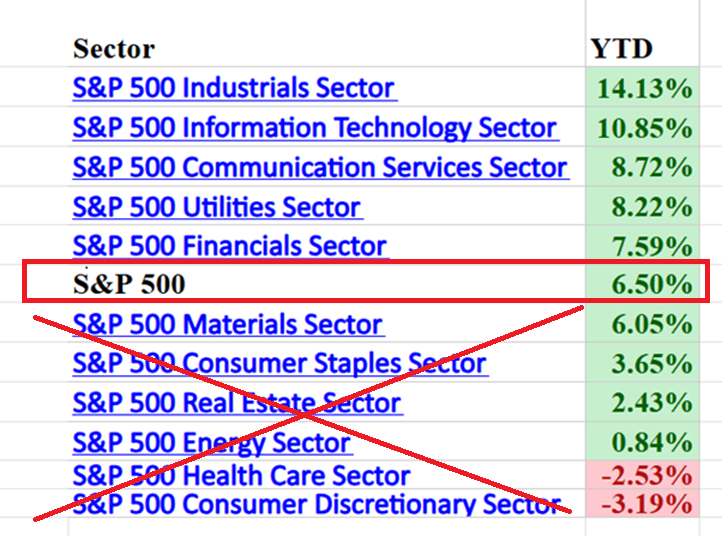
Let’s look at the data. Year-to-date, five sectors outperformed the S&P 500 Index, which itself is up approximately 6.5% this year.
These sectors are Industrials (+14.13%), Information Technology (+10.85%), Communication Services (+8.72%), Utilities (+8.22%), and Financials (+7.59%).
These aren’t guesses. These are sectors where market participants have voted with capital. We ignore the underperformers — because capital doesn’t flow toward weakness. And within these five outperforming sectors, we drill deeper. We look for the top relative strength candidates, the names that are not just participating, but leading. That’s where opportunity lives.
The power of relative strength lies in its simplicity. No algorithm or fancy forecast needed. You track how a stock performs against the market over time. If it’s climbing faster than the rest, that’s your cue. It means buyers are stepping in, trends are strengthening, and odds are shifting in your favor. That’s not just analysis, it’s strategy. And it’s how winners in this game stay one step ahead.
We’ve seen this play out time and time again. Whether it’s Apple, Nvidia, or ExxonMobil—stocks that lead the market higher almost always show relative strength first. The talking heads on cable news may distract you with noise, but traders focused on RS are tuned into the signal. In fact, during sector rotations or early bull phases, relative strength often gives the first clue that a major shift is underway. That’s the kind of insight that matters to real investors.
At the end of the day, markets don’t reward stories; they reward strength. Relative strength isn’t a magic wand, but it’s about as close to an honest compass as you’ll find in modern finance. If you’re not measuring what’s strong and what’s weak, you’re flying blind. But if you’re tracking relative strength, you’re in the pilot’s seat — with a map that tells you exactly where the tailwinds are. And in this economy, that’s more than an edge — it’s a necessity.
Applying relative strength to a sector is less about intuition and more about informed positioning. It begins with a benchmark — typically something broad and widely tracked, like the S&P 500 Index or a sector-specific ETF such as XLK for technology or XLE for energy. This benchmark is your control group. It provides the reference point against which every stock or subsector is evaluated. If a stock is not beating its benchmark over a defined period — say, 3 months, 6 months, or year-to-date — it’s not leading. It’s lagging. And in markets, laggards rarely outperform over time.
The process begins with a scan. Professional investors and institutions often run screeners that calculate performance deltas between individual stocks and their benchmark. For instance, if you’re analyzing the industrial sector, you might use XLI as the yardstick. From there, you look for stocks consistently outperforming that ETF across multiple timeframes. The goal isn’t just to find the best-performing stock today — it’s to isolate those exhibiting persistent, sustained strength. Strength that often reflects institutional accumulation, pricing power, or positive earnings sentiment.
But relative strength is not absolute. Context matters. You may find a stock outperforming its sector but still trailing the broader market. Or you may discover strength that’s short-lived news-driven spike, not a trend. This is where discipline comes in. You filter out noise by aligning RS analysis with broader trend confirmation: moving averages, volume profiles, macroeconomic tailwinds. Relative strength points you in the right direction, but it’s the confluence of signals that gives conviction.
Stock selection follows naturally. You start with the top decile of relative strength within the sector, but you don’t stop there. You examine fundamentals: revenue growth, margin expansion, catalysts. Is this strength backed by something tangible? Is there a story behind the price? The best trades often marry strong RS with accelerating fundamentals — where Wall Street estimates are still catching up to reality. That’s where asymmetric risk-reward profiles emerge.
Ultimately, the value of applying relative strength to a sector isn’t about chasing hot stocks. It’s about identifying leadership — those companies attracting capital for good reason. In a world flooded with data and short-term noise, relative strength remains one of the few quantitative signals that consistently cuts through. It’s not about predicting the market. It’s about aligning yourself with what’s already working — and letting the market do the heavy lifting.
If you’re serious about finding undervalued companies in this market, you need more than a gut feeling and a few headlines. You need a lens that reveals where the smart money is going — and where it’s not. That lens, my friends, is relative strength. It doesn’t just show you what’s hot. It shows you what’s quietly gaining strength while the rest of the market sleeps.
Now, here’s the trick: most people use relative strength to chase the winners. But the pros? The savvy, disciplined investors? They use it to identify value hiding in plain sight. These are stocks that have been beaten down, left for dead, and then — almost without warning — start to outperform their peers. That shift, that uptick in relative strength, is the first real signal that institutional money is sniffing around. And where institutional money goes, higher prices often follow.
You want to find stocks that have strong fundamentals — solid cash flow, good balance sheets, maybe even a dividend — but that have underperformed their sector for a while. Then, suddenly, they start outperforming the benchmark. That’s the moment. That’s the inflection point where value turns into opportunity.
The table below is hypothetical but quickly communicates the Relative Strength concept and idea very simply.
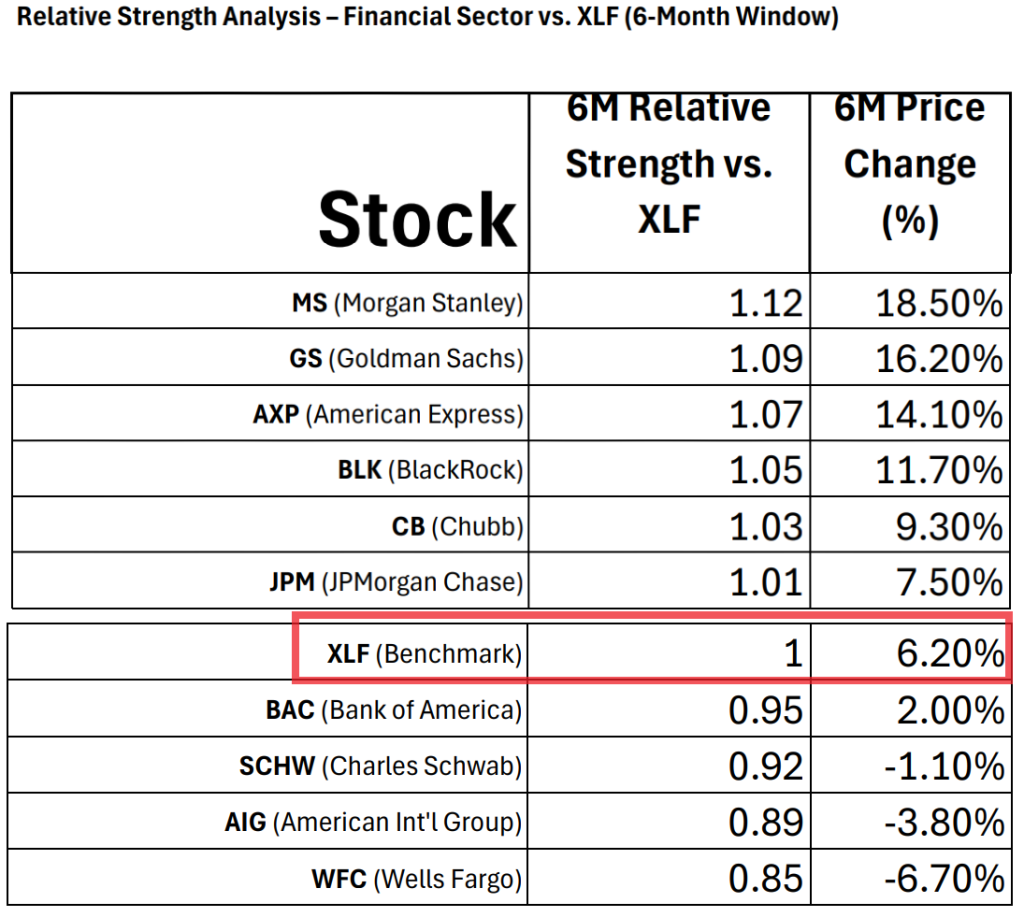
The $XLF ETF is the benchmark in this hypothetical example.
So, the first thing that we do is ignore all the laggards that are underperforming. Anything that is ranked below the benchmark is considered toxic.
All our attention is focused on the top 6 candidates. They are all beating the benchmark. It is from that small basket of stocks that we continue to analyze to locate and focus on our trading opportunity.
From a trader’s lens, Morgan Stanley (MS) and Goldman Sachs (GS) stand out. They’re not just up in price, they’re outperforming XLF, suggesting inflows from institutional money and likely favorable earnings sentiment. These are the financials showing true sector leadership.
American Express (AXP) and BlackRock (BLK) also rank above the benchmark, signaling broader strength in diversified financials and asset managers. Meanwhile, names like Wells Fargo (WFC) and AIG are underperforming, implying relative weakness despite the sector’s broader gains.
If you’re building a long-only watchlist, these RS rankings matter. You want exposure to the top stocks that are both rising and outperforming their sector ETF.
Think of Relative Strength as the market’s ultimate report card.
It doesn’t care about your feelings, your opinions, or some talking head’s hot take on cable news. It simply tells you what’s working… and what’s not. Period. You want to know which stocks are crushing it and which ones are limping along in shame? RS shows you — instantly.
Here’s the kicker: winners tend to keep winning. It’s momentum. It’s how markets work. The stocks showing the most strength over the last six months? Odds are, they’re going to keep steamrolling forward if the market even remotely rhymes with its recent past. And the weaklings? They usually stay stuck in the mud.
I’m not saying it’s guaranteed. This isn’t a crystal ball. But if you’re in this game to play smart and stack the odds in your favor, Relative Strength can be an edge. It’s not about guessing. It’s about betting with the house, where the probabilities lean hard in your direction. Ignore it, and you’re flying blind. Use it, and you’ve got the closest thing to X-ray vision this market will ever give you.
You want to trade like a pro? Then stop chasing stories. Start following strength. That’s how you win.
Here’s where the rubber meets the road, my friend.
Once you know which sectors are crushing it — and we just did that — you don’t stop. You go a level deeper. You stack the best stocks against their own sector ETF like it’s a showdown. Because here’s the truth: if that stock can’t even beat its own team, it’s dead weight. You want elite? Then you need proof of life. You need outperformance.
This isn’t just theory, it’s a brutally practical way to define quality. It sets a bar. And if the stock doesn’t clear it? You toss it. Simple. That’s how pros separate contenders from pretenders. You’re not wasting time or capital hoping some laggard catches up. You’re hunting momentum, leadership, and edge.
What this does is build a filter — a line in the sand that says, “If you’re not stronger than your own sector ETF, I’m not interested.” Because why settle for average when you can ride with the alpha dogs? You’ve got options. And the only thing worse than missing a trade… is getting trapped in the wrong one.
What makes Relative Strength powerful is this: the numbers don’t lie… and they don’t sit still.
You see, the data and performance metrics that Relative Strength reveals are dynamic, always shifting. Which means yesterday’s leaders can become today’s laggards — and new contenders are constantly stepping into the spotlight. That’s the natural rhythm of the market. It rotates. And if you’re alert to these changes, you can ride that rotation like a seasoned pro. But when you build and maintain this list you see an even smaller handful of companies that withstand all the slings and arrows and continue to dominate.
This is where smart traders separate themselves from the amateurs. They don’t chase everything — they specialize. They keep a focused eye on a handful of top-performing sectors, and within each one, they know exactly who’s winning. Not guessing. Not hoping. Knowing. In fact, in my book, there’s nothing more valuable than knowing who’s leading in each sector.
From a stock selection standpoint, Relative Strength makes the process beautifully practical. Why? Because it works through elimination. Most stocks — frankly, 95% of them — are trailing the top names in their niche. So, you ignore them. Completely. You zero in on the few that are beating the pack. The cream. The outliers. The leaders.
Because in trading, as in life, the rule holds true: Winners win. Laggards lag. And the faster you align yourself with the winners, the faster your trading results start looking like theirs.
The longer I trade, the more I admire and appreciate Relative Strength. It’s not just a strategy — it’s a mindset shift. I’ll tell you, I used to believe the only way to make money was to buy low and sell high. That’s what we were all taught, right? But let me be blunt: Relative Strength teaches you something smarter — you can buy high, and you can sell higher.
New traders struggle with that. They see a stock already moving, and they think the opportunity is gone. They hesitate, they doubt, and they miss the move. But here’s the truth: buying strength means buying quality. You’re not fishing for bottoms — you’re aligning with what’s working. And in this market, that makes all the difference.
That quality I’m talking about — it’s not found in some vague balance sheet formula or clever ratio. It’s defined by one thing: performance. Cold. Hard. Measurable. Who’s outperforming? Who’s gaining ground? That’s the scoreboard that matters. Everything else is noise.
If your goal is to build real wealth — not theory, not fantasy, but actual returns — you’ve got to study performance like your financial life depends on it. Because it does. Winners show up in the numbers, not the narratives.
Relative Strength doesn’t promise perfection. But what it delivers is focus, discipline, and an unfiltered view of reality.
Let me ask you something that might sting a little…
Do you know the top 5 candidates in each of the 6 top-performing sectors right now?
No?
Why not?
That’s where the money is being made. Right now. Not in the noise. Not in the cheap seats. In the sectors leading the charge — the ones dragging this market uphill while everything else wheezes and stalls. If you’re serious about trading, that’s your sandbox. Period. The winners live there. The edge lives there. And if you’re not living there too, you’re just playing dress-up with your trading account.
The top performers are golden. Not maybes. Not “could be’s.” These are stocks with real juice. The ones that are proving themselves in real time with real capital behind them. But here’s the move that separates amateurs from assassins: cross-reference those leaders with A.I.
Artificial intelligence Trading Software isn’t just some shiny toy. It’s the tool that keeps you locked onto the right trend, at the right time, and on the right side of the market. It filters the hype, crushes the laggards, and hands you a list that matters.
Let’s take a moment to reflect on what we’ve already uncovered about the powerful tool known as Relative Strength — a concept so deceptively simple, yet so devastatingly effective, it separates the pros from the pretenders.
At its core, relative strength is all about comparison. Not in the way your neighbor brags about their new car — but in a precise, objective way that pits one asset’s performance against another: a market index, an industry group, or even another stock. It’s a no-nonsense scoreboard that reveals who’s really winning.
Outperformance is everything. Relative strength shines a spotlight on the assets that are doing better than their peers. These are the horses leading the race, the stocks that don’t just survive the market’s ups and downs, they thrive.
That’s why seasoned traders use it as a momentum meter. It helps you zero in on the real movers. The kind of stocks that demand attention through superior price action.
Now, let’s not forget how to use it — because knowing the theory without the application is like owning a Ferrari and never taking it out of the garage.
Step one: Pick your benchmark. Whether it’s the S&P 500, a sector index, or a rival stock, choose something that reflects the playing field.
Step two: Measure performance over time. Six months. One year. Whatever makes sense for your strategy. You’re comparing trajectories — who’s gaining ground faster?
And finally, step three: Study and upgrade the results regularly. Look for consistency. Assets that keep outrunning the pack over time. That’s your signal. That’s your edge.
In short: Relative strength is a compass. Use it wisely, and you’ll know which direction the smart money is moving.
I believe in Relative Strength like a battle-tested Marine believes in his rifle. It’s not hype. It’s not theory. You want to know how legends are made? Look at the past five years. Tesla, NVIDIA, Microsoft, Meta, even MicroStrategy — they didn’t sneak their way to the top. They dominated the leaderboard. And guess what? They all showed up — again and again — on the Relative Strength report card long before they became household names. Great traders don’t fight trends — they surrender to them. That’s not weakness. That’s wisdom. And that, my friend, is what Relative Strength delivers: brutal clarity on who’s winning, who’s just surviving, and who you better start paying attention to before the market leaves you behind.
Now here’s the deal. I want to invite you to the free Learn How To Trade with A.I. Live Online Master Class. No fluff. No hype. Just a fast-paced, no-holds-barred session showing you how to use artificial intelligence to spot these monster trends before the herd wakes up. You’ll see how the pros use A.I. to measure Relative Strength in real time, identify new leaders in every sector, and ride trends that make legacy-level wealth possible.
Let A.I. do the heavy lifting. You bring the focus — we’ll show you how to unleash the strategy. Join us.
While talking heads argue over hypotheticals and half-baked theories, seasoned traders know better. We don’t chase opinions — we follow the trend. Why? Because the trend doesn’t argue, exaggerate, or guess. It reveals. Quietly. Powerfully. Consistently.
And when you pair that natural market truth with the forecasting power of VantagePoint A.I., you get something rare — an advantage so precise and reliable, it almost feels unfair. Especially when combined with a time-tested strategy like Relative Strength, which can tilt the odds further in your favor. Less risk. More reward. Greater peace of mind.
Want to see it for yourself? You’re invited to our next FREE Live Online Training, where we pull back the curtain and show you exactly how traders are using artificial intelligence to find and ride the right trends at the right time.
No fluff. No gimmicks. Just the smart, strategic edge that professionals rely on when performance truly matters.
It’s not magic.
It’s machine learning.
This is your moment. Make it count.
THERE IS A SUBSTANTIAL RISK OF LOSS ASSOCIATED WITH TRADING. ONLY RISK CAPITAL SHOULD BE USED TO TRADE. TRADING STOCKS, FUTURES, OPTIONS, FOREX, AND ETFs IS NOT SUITABLE FOR EVERYONE.IMPORTANT NOTICE!
DISCLAIMER: STOCKS, FUTURES, OPTIONS, ETFs AND CURRENCY TRADING ALL HAVE LARGE POTENTIAL REWARDS, BUT THEY ALSO HAVE LARGE POTENTIAL RISK. YOU MUST BE AWARE OF THE RISKS AND BE WILLING TO ACCEPT THEM IN ORDER TO INVEST IN THESE MARKETS. DON’T TRADE WITH MONEY YOU CAN’T AFFORD TO LOSE. THIS ARTICLE AND WEBSITE IS NEITHER A SOLICITATION NOR AN OFFER TO BUY/SELL FUTURES, OPTIONS, STOCKS, OR CURRENCIES. NO REPRESENTATION IS BEING MADE THAT ANY ACCOUNT WILL OR IS LIKELY TO ACHIEVE PROFITS OR LOSSES SIMILAR TO THOSE DISCUSSED ON THIS ARTICLE OR WEBSITE. THE PAST PERFORMANCE OF ANY TRADING SYSTEM OR METHODOLOGY IS NOT NECESSARILY INDICATIVE OF FUTURE RESULTS. CFTC RULE 4.41 – HYPOTHETICAL OR SIMULATED PERFORMANCE RESULTS HAVE CERTAIN LIMITATIONS. UNLIKE AN ACTUAL PERFORMANCE RECORD, SIMULATED RESULTS DO NOT REPRESENT ACTUAL TRADING. ALSO, SINCE THE TRADES HAVE NOT BEEN EXECUTED, THE RESULTS MAY HAVE UNDER-OR-OVER COMPENSATED FOR THE IMPACT, IF ANY, OF CERTAIN MARKET FACTORS, SUCH AS LACK OF LIQUIDITY. SIMULATED TRADING PROGRAMS IN GENERAL ARE ALSO SUBJECT TO THE FACT THAT THEY ARE DESIGNED WITH THE BENEFIT OF HINDSIGHT. NO REPRESENTATION IS BEING MADE THAT ANY ACCOUNT WILL OR IS LIKELY TO ACHIEVE PROFIT OR LOSSES SIMILAR TO THOSE SHOWN.


