Options trading offers tremendous opportunities for most traders but one of the larger challenges with trading these derivative instruments is being able to differentiate the risk and reward profiles of different trading tactics and strategies. In this article we will focus on analyzing the differences between call buyers and put sellers. Both tactics are traditionally recommended in up trends. However, their risk profiles are completely different as is the success of the traders who trade them.
Options trading is a financial strategy that grants individuals the right, but not the obligation, to buy or sell an underlying asset at a predetermined price within a specified time frame. Essentially, it provides traders with the opportunity to speculate on price movements in various financial markets, including stocks, commodities, and indices, without the need to own the underlying asset. Options come in two main forms: calls, which grant the right to buy the underlying asset, and puts, which grant the right to sell. Traders can profit from options by correctly predicting the direction of price movements or hedging against potential losses in their investment portfolios. However, options trading involves inherent risks and complexities, requiring traders to thoroughly understand the mechanics of options contracts and the underlying market dynamics before engaging in such activities.
Buyers of options enjoy a unique advantage in that they have limited risk exposure. When purchasing an option, whether it’s a call or a put, the most they can lose is the premium they paid to acquire the option contract. This premium is essentially the cost of purchasing the right to buy (in the case of a call option) or sell (in the case of a put option) the underlying asset at a specified price within a set timeframe. Regardless of how the market moves, the maximum loss for the option buyer is capped at this premium.
On the other hand, options sellers take on a different role and bear additional responsibilities. When selling an option, they receive the premium from the buyer upfront. However, by doing so, they take on the obligation to fulfill the terms of the option contract if the buyer decides to exercise it. For example, if an option seller has sold a call option, they are obligated to sell the underlying asset to the option buyer at the specified strike price if the buyer chooses to exercise the option. Similarly, if an option seller has sold a put option, they are obligated to buy the underlying asset from the option buyer at the specified strike price if the buyer decides to exercise the option. This means that option sellers face potentially unlimited losses if the market moves significantly against their position, making risk management and careful consideration of market conditions crucial for sellers.
Comparing options sellers to a casino and option buyers to gamblers can provide a helpful analogy to understand the dynamics of options trading.
Options sellers, much like casinos, operate with a statistical edge in their favor. Casinos design their games so that, over the long run, they are likely to come out ahead due to the probabilities being in their favor. Similarly, options sellers often utilize strategies that take advantage of probabilities and statistical models to tilt the odds in their favor. By consistently selling options and collecting premiums, options sellers aim to profit over time, much like how casinos profit from the aggregate losses of gamblers.
On the other hand, option buyers can be likened to gamblers in a casino. When a gambler places a bet, they are essentially paying for the chance to win big, knowing that they might lose their wager. Similarly, option buyers pay a premium in the hopes of achieving substantial profits if the market moves in their favor. However, just like gambling, there’s no guarantee of success, and option buyers risk losing their entire premium if the market doesn’t move as anticipated within the specified time frame.
In this analogy, options sellers adopt a more strategic and calculated approach, akin to the business model of a casino, where consistent, methodical actions are taken to capitalize on statistical probabilities. Meanwhile, option buyers, like gamblers, rely more on chance and speculation, hoping for a favorable outcome but accepting the risk of potential losses. It’s essential for both options sellers and buyers to understand their respective roles and the inherent risks involved in options trading, just as both casinos and gamblers understand the dynamics of their interactions on the casino floor.
The point I’m making is it’s essential in trading to be able to effectively define and manage risk. The challenge that always exists for options traders is that RISK can be extremely deceptive.
For example, let’s go back to the casino analogy. The casino is focused on long term edges which ensure its survival. On the other hand, the gambler is looking for that one break the bank outcome that will create life changing income. When you trade options, you can choose to be the gambler, or the casino, or both. Understanding all the possibilities is what empowers traders. To do so, we must always look beyond the surface apparencies.
The following graphic clearly illustrates the differences between purchasing a right on a stock, versus creating an obligation.
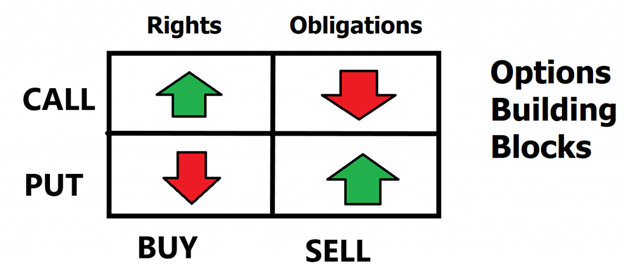
The primary difference lies in the nature of the contractual agreement and the associated financial exposure. By purchasing a call option, an investor acquires the right, but not the obligation, to buy an underlying asset at a predetermined price (the strike price) within a specified time frame. This right provides the potential for profit if the price of the underlying asset rises above the strike price, as the option holder can then exercise the option to buy at a lower price. Conversely, by selling a put option, an investor assumes the obligation to buy the underlying asset at the specified strike price if the option buyer decides to exercise their right to sell. While purchasing a call option grants the flexibility to choose whether to exercise the option based on market conditions, selling a put option entails a binding commitment to purchase the asset, irrespective of the market price, should the option be exercised.
Let’s look at each of these scenarios so that we can see the similarities and differences of each strategy.
Whenever you think that a stock will rise in price you have a handful of choices.
- You can purchase stock.
- You can purchase a call option.
- You can sell a put option.
While all these strategies will theoretically benefit from a rising stock price, they each have very different risk and reward profile.
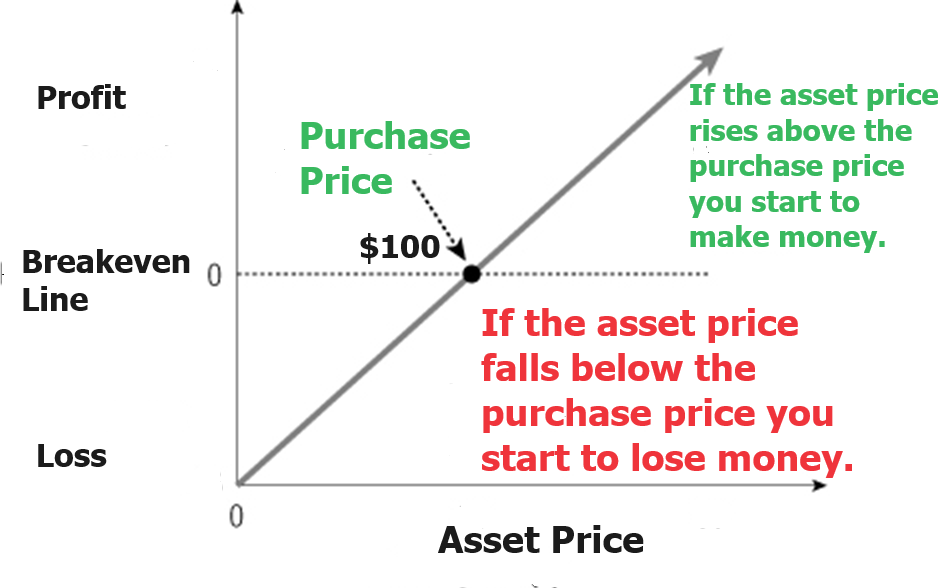
Let’s assume that XYZ stock is trading at $100.
This means that a stock purchase would require a buyer to allocate $10,000 to purchase 100 shares of stock. The risk/reward profile is very easy to understand. The key point for this scenario is that a buyer of stock has a very straightforward linear relationship with the asset. In many instances they can potentially purchase on margin which increases leverage and risk.
When a trader purchases a call option, they have limited risk and theoretically unlimited reward potential. While this can sound very attractive on the surface, we need to really dissect these terms and focus on the probabilities if we truly want to be successful.
The Stock Price is 100.
Purchase One XYZ 100 CALL option at $5.
Here is what the risk/reward profile looks like for a call option buyer. The call option buyer, by paying $5 per share, has the right but not the obligation to purchase 100 shares of XYZ stock between now and the expiration date. They only need to pay $5 a share now or $500 which is their maximum risk. In other words, they control 100 shares of a $100 stock for only a $500 premium.
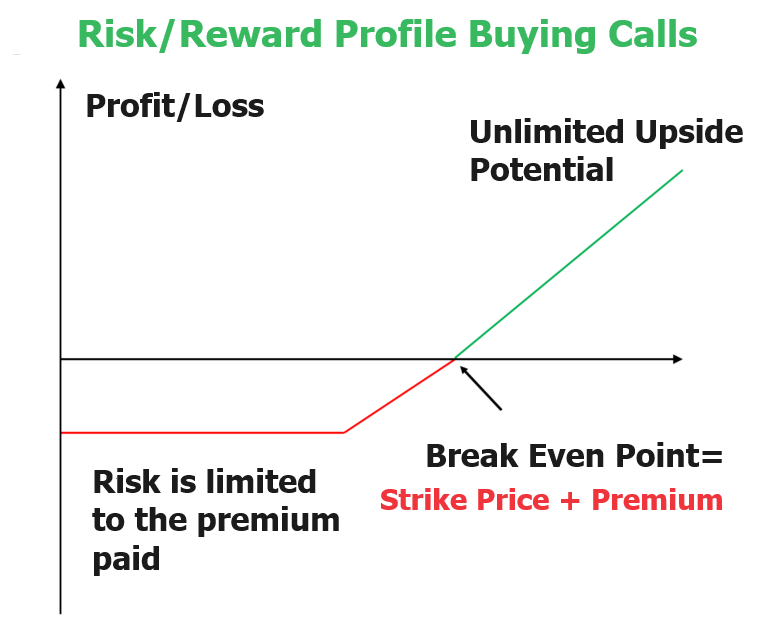
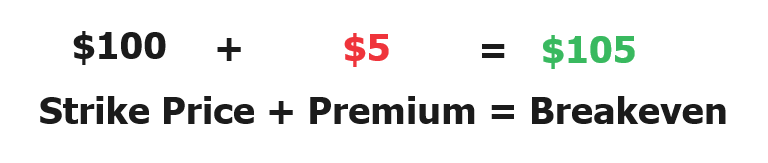
Here is the simple commonsense math that every option trader does whenever they purchase a call option: If the strike price is $100, we need to add the premium of $5 to determine the breakeven price at expiration.
The billion-dollar question for Call Option Buyers is what is the probability of prices rising more than 5% between now and the expiration date? How often has that occurred in the past? This is a very simple question that is often ignored by call option buyers because they are comforted by the fact that they have limited risk and unlimited profit potential.
While it is nice to know that you have limited risk on a trade, the better question to ask is what are my probabilities of success?
Lastly, let’s look at the risk reward profile of a PUT Option Seller. When a trader sells a put, they create an obligation to buy the underlying asset at the agreed upon strike price between now and the expiration date in exchange for a premium received.
Here is the scenario: Stock price is $100.
Sell 1 XYZ 95 Put at $5
The seller is agreeing to buy XYZ at $95 per share between now and the expiration date in exchange for the $5 received now. The maximum gain the put option seller can receive is $5, or the premium received. Theoretically the risk on this trade is the price of the stock less the premium received. This is theoretical but needs to be evaluated because the buyer has obligated themselves to buy the stock at $95 and in theory, the stock can potentially go to zero.
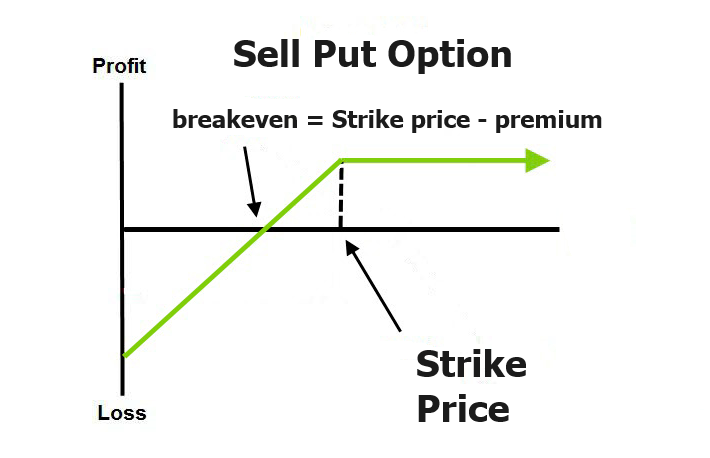
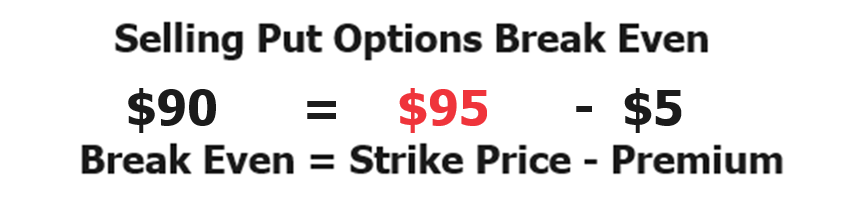
The put option seller will begin losing money at expiration at any price below $90 per share. This is because they obligated themselves to purchase the underlying stock at $95 per share but received a premium of $5 to create that obligation. The billion-dollar question that the put option seller asks is what is the probability of the stock falling below $90 at expiration? At any price above $90 at expiration the put option seller will still be profitable.
The maximum loss that the seller of a put option can incur is theoretically the price of the stock less the premium received. When an investor sells a put option, they are obligated to buy the underlying asset at the specified strike price if the option buyer decides to exercise their put option. If the price of the underlying asset were to plummet to zero, the seller would still need to purchase the asset at the strike price, resulting in a loss equal to the strike price minus the premium. Since the price of an asset can However, in practical terms, the loss is limited by the actual price of the underlying asset, which cannot drop below zero.
So far, we have three different strategies for monetizing an uptrend. All three tactics have different risk/reward profiles. All three tactics have different margin requirements.
Which one is best?
While that is a great question, the better question revolves around looking at the probabilities of price moving enough to make the strategies either profitable or unprofitable.
Since every stock will have its own individual volatility, I’ll attempt to answer this question from the data I’ve analyzed on the SPDR S&P 500 ETF ($SPY). The SPDR S&P 500 ETF Trust, commonly referred to by its ticker symbol “$SPY,” is one of the most widely traded exchange-traded funds (ETFs) in the world. This ETF seeks to track the performance of the S&P 500 index, which is composed of 500 of the largest publicly traded companies in the United States, spanning various sectors of the economy. The $SPY ETF is designed to provide investors with a convenient way to gain exposure to the overall performance of the U.S. stock market. It offers liquidity, diversification, and relatively low expense ratios compared to actively managed mutual funds. Investors can buy and sell shares of the $SPY ETF throughout the trading day on stock exchanges, allowing for easy access to broad market exposure with the flexibility of intra-day trading.
However, before we look at the data it is crucial for options traders to understand “time decay” or “theta.” Time decay is a critical concept for new options traders to understand. It refers to the gradual reduction in the value of an options contract over time, specifically due to the diminishing time left until the expiration date. All options exist for a finite amount of time. As each day passes, the time value of an option diminishes, regardless of whether the underlying asset’s price moves in the desired direction. This occurs because options have a limited lifespan, and with each passing day, there is less time for the option to potentially move in the money (profitably). Time decay accelerates as the expiration date approaches, leading to a steeper decline in the option’s value. Assume that an option is out of the money and is trading at $5 and has 10 days left before expiration. From this simple example we can deduce that it will decay in value roughly, 1/10th each day.
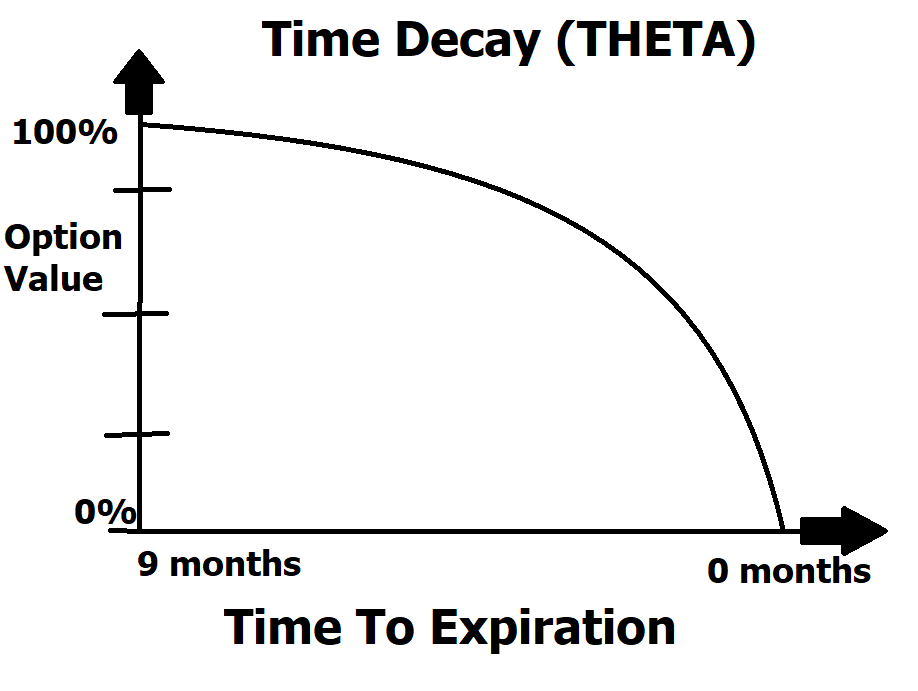
Understanding time decay is crucial for options traders because it highlights the importance of timing in options strategies. It means options buyers need the underlying asset to move in the desired direction quickly to offset the erosion of time value, while options sellers benefit from the decay of time value if the underlying asset’s price remains relatively stable. Therefore, incorporating time decay considerations into options trading strategies is essential for maximizing profit potential and managing risk effectively.
ALWAYS study time decay whenever you trade options. It’s the gorilla in the room. There is no experience more frustrating to an options buyer than to correctly anticipate the trend but to still not make money because of time decay.
The graphic below is the monthly performance metrics of the $SPY over the last 10 years. The data is presented as the net change from each month’s closing price to the following month’s closing price.
This is fascinating and worthy of your attention because it will certainly burst a few myths regarding options trading.
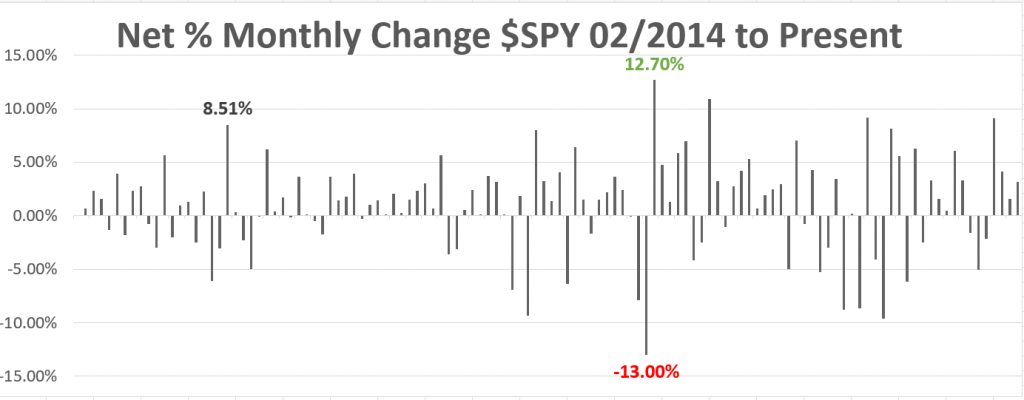
There are 120 data points in this data series which covers the net percentage change from February 2014 to present time.
The largest positive monthly gain was +12.7%
The largest negative monthly loss was -13%
The average monthly return of the entire data series is +.92%
There were 79 net positive monthly gains. This means 65.8% of the time the market closed positively on the month.
There were 41 net negative monthly losses. This means that 34.17% of the time the market closed negative on the month.
There were 18 occurrences that were greater than 5% monthly gains. This means 15% of the time the market had 5% or greater gains.
There were 12 occurrences that were greater than -5% monthly losses. This means that 10% of the time the market had 5% or greater losses. Or stated another way, 90% of the time the market did not close more than 5% lower.
There were 7 occurrences out of 120 that were greater than 7.5% monthly gains. This means that 5.8% of the time the market had 7.5% or greater monthly gains.
There were 6 occurrences out of 120 that were greater than 7.5% monthly gains. This means that 5% of the time the market had 7.5% or greater monthly losses. Or stated another way, 92.5% of the time the market did not lose greater than 7.5%.
If we analyze only the up closes, the average positive return of all UP closes was 3.33%
If we analyze all the down closes, the average net negative return was of the down closes was – 3.83%
We can make some interesting observations from this data. Keep in mind that this data only measures the distance from each month’s close, meaning within the month the results could have been potentially greater.
What is patently obvious to me though is that based upon this data series that put option sellers have a very distinct odds-on advantage of success if they are selling options that are 5% or greater out of the money. They key is to practice good money management to make sure that one bad trade does not ruin your trading account.
But do you know what increases the odds of success even further?
Allowing artificial intelligence to navigate and do the heavy lifting trend analysis.
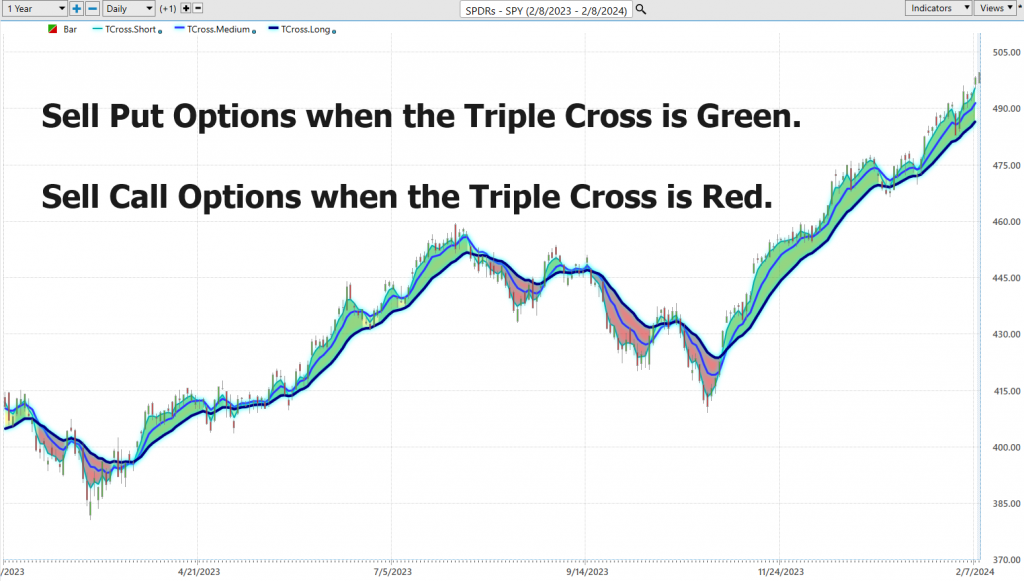
One picture paints a thousand words.
Study the following chart of the VantagePoint A.I. Triple cross indicator which we use regularly in our weekly stock studies. When the indicator turns green it indicates that the 3 predictive moving averages all are confirming and uptrend. When the indicators turns red the indicators confirm a downtrend.
I hope you can see and understand the dilemma that options traders face.
The idea of having limited risk and unlimited profit potential can be very risky if you don’t know what the trend or probabilities of success are! It’s no different than rolling the dice at the casino.
The idea of only making a limited reward sounds unappealing in comparison but can be a very high probability trading tactic.
These are the type of ideas that we discuss in depth at our Free Live Trainings where we teach traders how to trade with artificial intelligence and focus on high probability data driven trades.
Are you ready to revolutionize your trading game and soar to new heights of success? Prepare to be blown away as we unveil the ultimate secret weapon: Artificial Intelligence. Join us for our Live Trainings and unlock the power of cutting-edge A.I. technology to supercharge your trading strategies like never before. Imagine having a virtual trading partner that never sleeps, tirelessly scanning markets, analyzing data, and executing trades with lightning-fast precision. That’s the power of A.I. at your fingertips, delivering real-time insights and uncovering lucrative opportunities that traditional methods could never uncover.
Here’s the deal: Trading with A.I. isn’t just a game-changer—it’s a game-winner. Say goodbye to guesswork and hello to data-driven decisions that drive results. Our Live Trainings will immerse you in the world of A.I.-driven trading, equipping you with the knowledge, tools, and strategies to stay ahead of the curve in today’s dynamic markets. From advanced algorithms to predictive analytics, you’ll learn how to harness the full potential of A.I. to minimize risk, maximize profits, and achieve your financial goals with confidence. Don’t miss this exclusive opportunity to join the ranks of elite traders who are redefining the future of finance. Reserve your spot now and embark on a journey to trading mastery with AI as your ultimate ally. Your success story starts here. The purpose of artificial intelligence is to always calculate the best move forward by keeping you as a trader on the right side, of the right trend at the right time.
Remember: Artificial Intelligence has beaten humans at Chess, Poker and Go. Why should trading be any different?
To explore the transformative potential of A.I. in trading, I invite you to join us for a FREE Live Training session.
Discover how A.I. can help you minimize risk, maximize rewards, and provide peace of mind in your trading journey. Don’t miss this opportunity to equip yourself with the knowledge and tools that can make all the difference.
It’s not magic.
It’s machine learning.
Make it count.
THERE IS A SUBSTANTIAL RISK OF LOSS ASSOCIATED WITH TRADING. ONLY RISK CAPITAL SHOULD BE USED TO TRADE. TRADING STOCKS, FUTURES, OPTIONS, FOREX, AND ETFs IS NOT SUITABLE FOR EVERYONE.IMPORTANT NOTICE!
DISCLAIMER: STOCKS, FUTURES, OPTIONS, ETFs AND CURRENCY TRADING ALL HAVE LARGE POTENTIAL REWARDS, BUT THEY ALSO HAVE LARGE POTENTIAL RISK. YOU MUST BE AWARE OF THE RISKS AND BE WILLING TO ACCEPT THEM IN ORDER TO INVEST IN THESE MARKETS. DON’T TRADE WITH MONEY YOU CAN’T AFFORD TO LOSE. THIS ARTICLE AND WEBSITE IS NEITHER A SOLICITATION NOR AN OFFER TO BUY/SELL FUTURES, OPTIONS, STOCKS, OR CURRENCIES. NO REPRESENTATION IS BEING MADE THAT ANY ACCOUNT WILL OR IS LIKELY TO ACHIEVE PROFITS OR LOSSES SIMILAR TO THOSE DISCUSSED ON THIS ARTICLE OR WEBSITE. THE PAST PERFORMANCE OF ANY TRADING SYSTEM OR METHODOLOGY IS NOT NECESSARILY INDICATIVE OF FUTURE RESULTS. CFTC RULE 4.41 – HYPOTHETICAL OR SIMULATED PERFORMANCE RESULTS HAVE CERTAIN LIMITATIONS. UNLIKE AN ACTUAL PERFORMANCE RECORD, SIMULATED RESULTS DO NOT REPRESENT ACTUAL TRADING. ALSO, SINCE THE TRADES HAVE NOT BEEN EXECUTED, THE RESULTS MAY HAVE UNDER-OR-OVER COMPENSATED FOR THE IMPACT, IF ANY, OF CERTAIN MARKET FACTORS, SUCH AS LACK OF LIQUIDITY. SIMULATED TRADING PROGRAMS IN GENERAL ARE ALSO SUBJECT TO THE FACT THAT THEY ARE DESIGNED WITH THE BENEFIT OF HINDSIGHT. NO REPRESENTATION IS BEING MADE THAT ANY ACCOUNT WILL OR IS LIKELY TO ACHIEVE PROFIT OR LOSSES SIMILAR TO THOSE SHOWN.