









This week’s AI stock spotlight is American Airlines Group ($AAL).
American Airlines traces its history to 1930. The parent company operated as AMR Corporation until December 2013, when it was renamed American Airlines Group, and it is headquartered in Fort Worth, Texas. Robert D. Isom Jr. is chief executive officer. Together with its regional partners, American operates more than 6,000 daily flights to more than 350 destinations in more than 60 countries, using a fleet of 1,624 aircraft, 1,037 mainline and 587 regional, and a workforce of about 141,100 full-time equivalent employees. At the November 10 close, the company had a market value of about $9.35 billion.
The business model is one integrated air transportation business with three revenue lines. Passenger revenue is the engine, at $14.90 billion of the $16.34 billion the company reported for the third quarter of 2026. Cargo added $274 million. Other revenue, $1.16 billion in the quarter, is where the AAdvantage loyalty program and its co-branded credit card relationship with Citi show up, and that line has become one of the most valuable parts of the company. The network runs through hubs in Charlotte, Chicago, Dallas/Fort Worth, Los Angeles, Miami, New York, Philadelphia, Phoenix, and Washington, D.C., with partner gateways in London, Madrid, Seattle/Tacoma, Sydney, and Tokyo.
American competes most directly with Delta Air Lines and United Airlines, the other two large U.S. network carriers, and with Southwest Airlines and Alaska Air Group in domestic markets. Its differentiation rests on three things: the nine-hub network and its international partner gateways; the AAdvantage program, where enrollments grew 27.4% and co-branded card spending rose nearly 10% in the third quarter; and a premium push, with plans to lift premium seating on its narrowbody fleet to 40% and Starlink connectivity now across more than 1,000 mainline aircraft. Managed corporate revenue grew 27.6% in the quarter, the sixth straight quarter of double-digit growth.
The airline group as a whole is a high-beta corner of the transportation sector, and 2026 has been a year in which jet fuel has decided more of the story than demand. Tensions involving Iran kept crude oil elevated through October, with Brent above $111 a barrel on October 22 and above $116 on October 23 after Houthi attacks in Saudi Arabia. Carriers across the industry cut their outlooks because of fuel. Delta trimmed guidance, United guided its fourth quarter on fuel of $4.80 per gallon, Southwest cut its outlook, Alaska guided to a wider loss and cut 200 jobs, Air Canada lowered its forecast, and IAG and Ryanair both pointed to higher fuel bills. When oil fell, the group moved together in the other direction. On November 4, West Texas Intermediate crude fell about 8% to roughly $88, and United, Delta, and Southwest gained 6% to 8%. On November 9, crude fell about 4% to near $87, United rose about 7%, Delta about 5%, and AAL gained 7.44%. For American, with $28.08 billion of net debt and thin margins, that sensitivity is amplified.
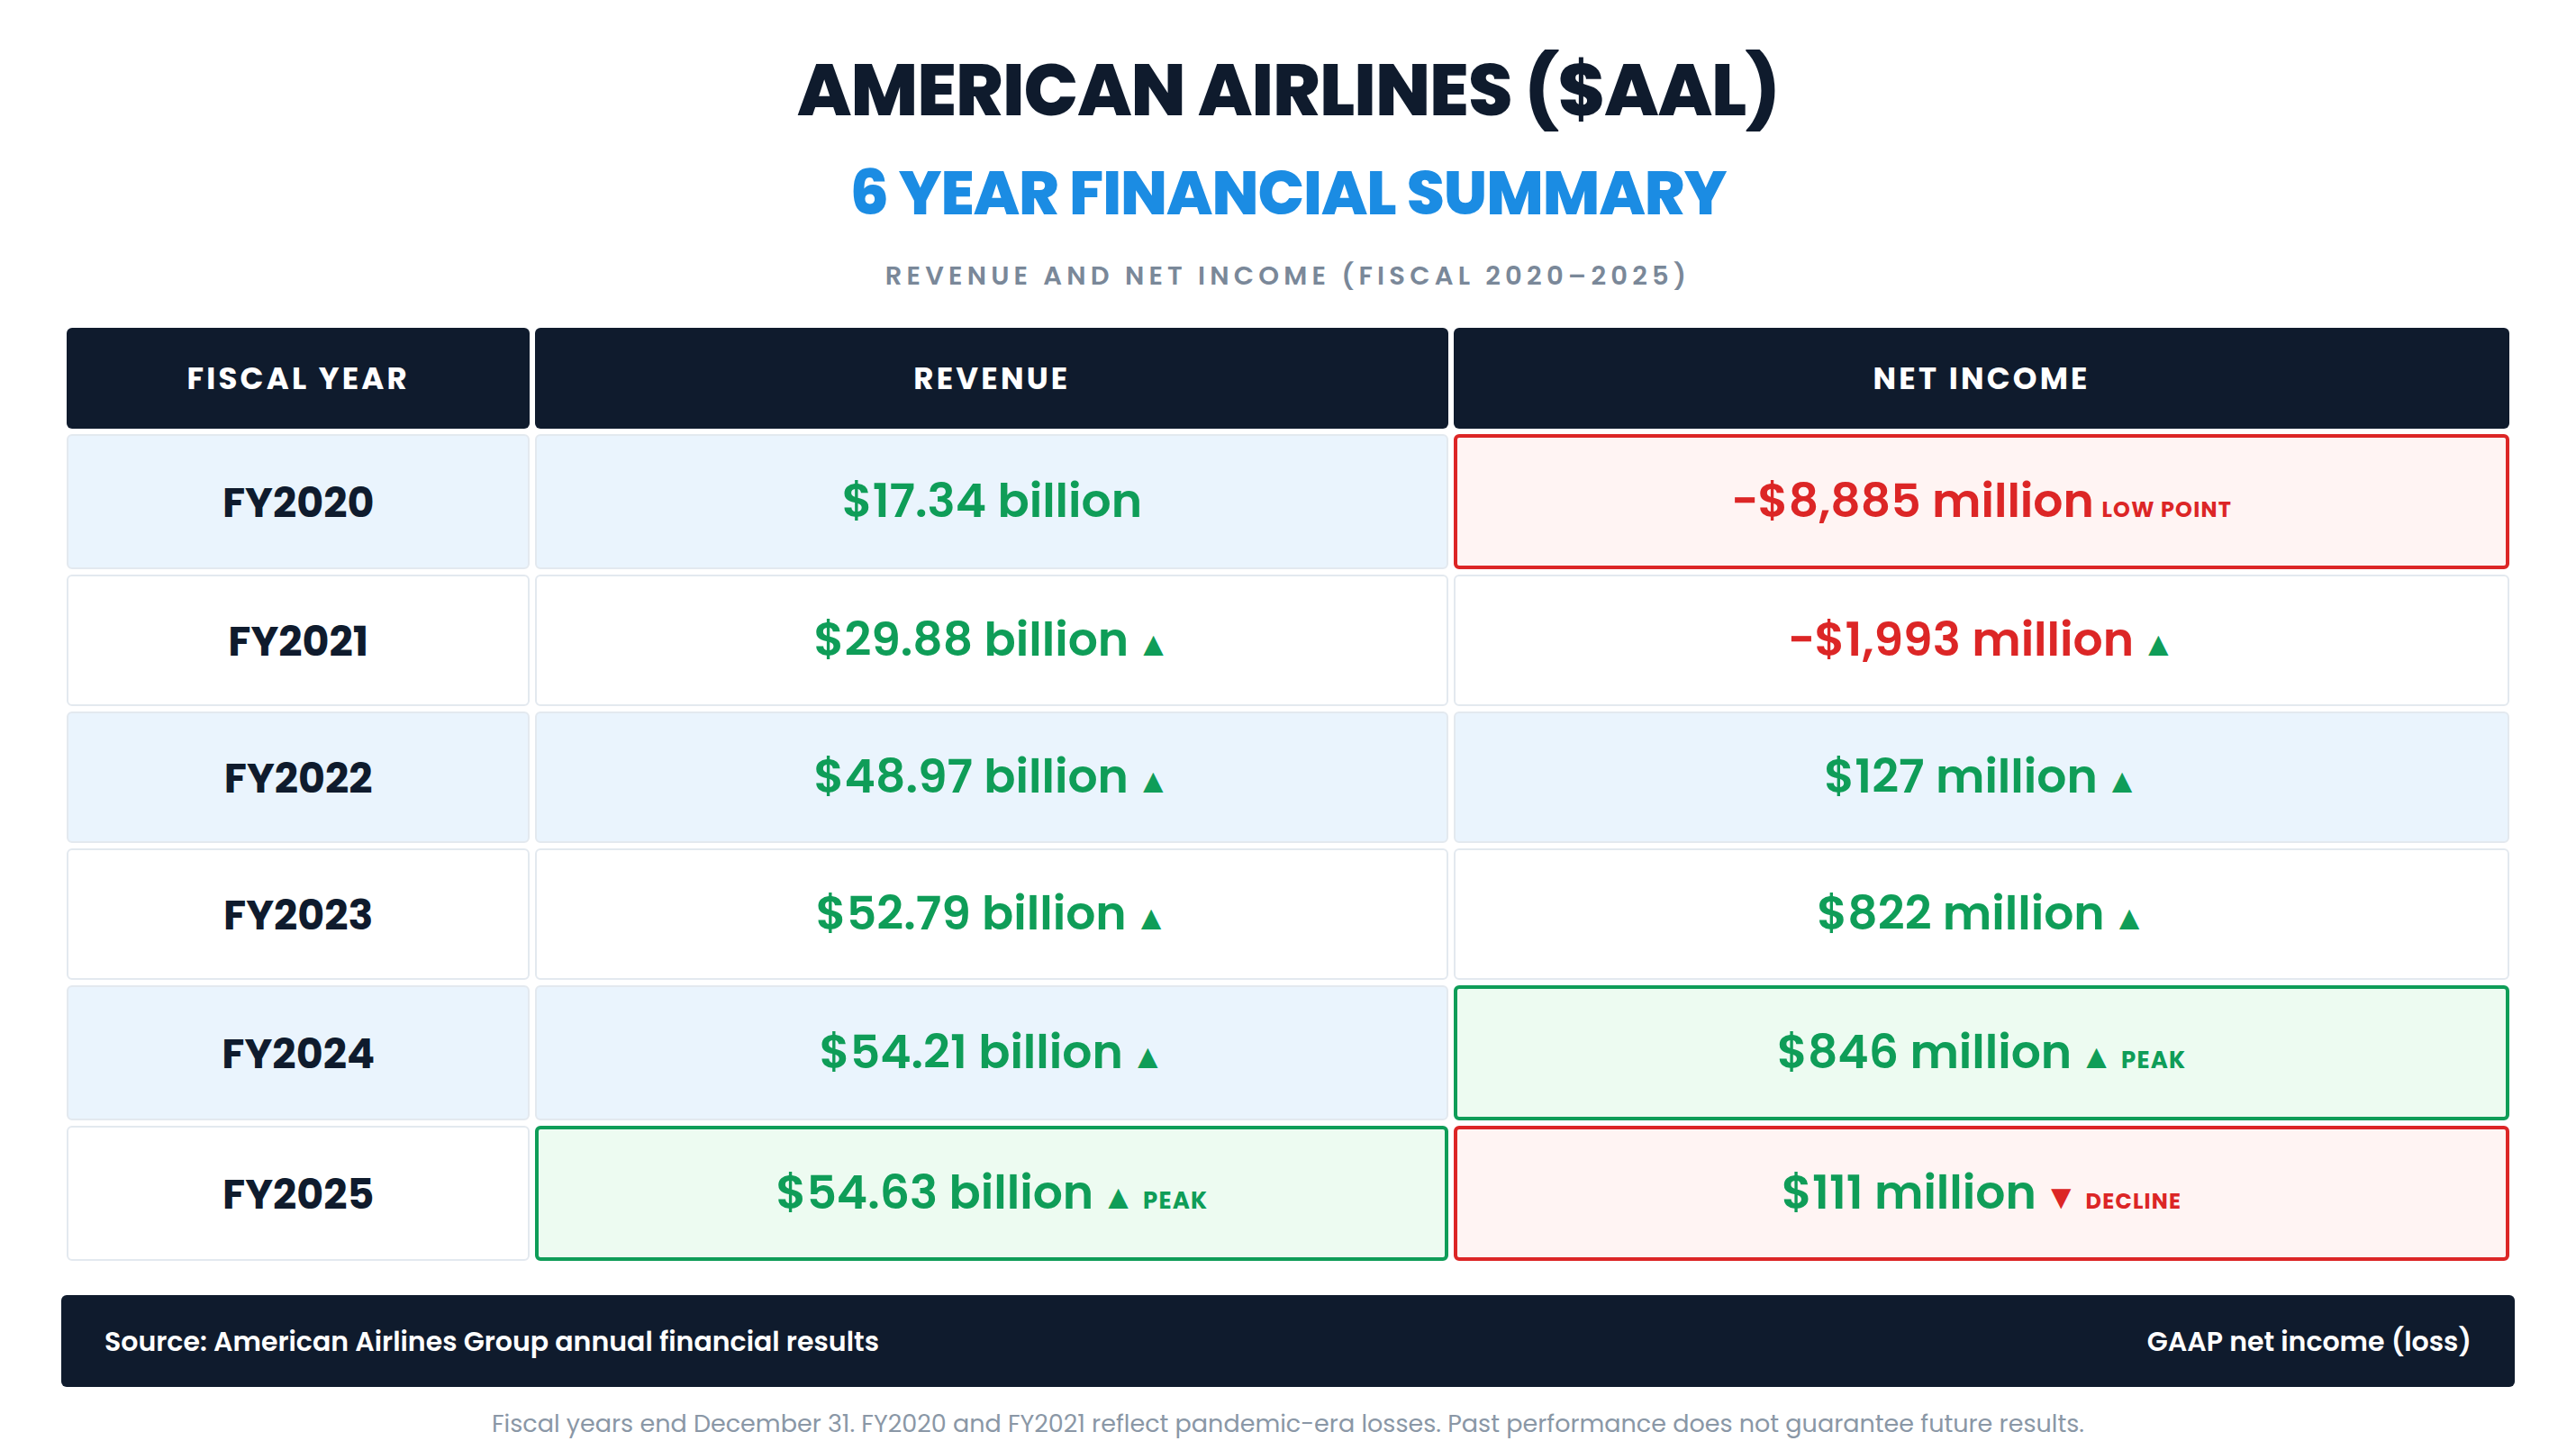
American uses a calendar fiscal year, and its six-year record is a recovery story with a stalled final chapter. Revenue was $17.34 billion in fiscal 2020, the year the pandemic grounded most of the industry, then rose 72.36% to $29.88 billion in fiscal 2021 and 63.88% to $48.97 billion in fiscal 2022. Growth slowed sharply after that, to 7.79% in fiscal 2023 at $52.79 billion, 2.70% in fiscal 2024 at $54.21 billion, and 0.78% in fiscal 2025 at a record $54.63 billion. Over six years, revenue rose 215.12%. Net income followed a different path. The company lost $8.89 billion in fiscal 2020 and $1.99 billion in fiscal 2021, returned to a $127 million profit in fiscal 2022, and earned $822 million in fiscal 2023 and a peak of $846 million in fiscal 2024. In fiscal 2025, net income fell to $111 million, or $0.17 per diluted share.
Here is the number the annual table hides. In fiscal 2025, American paid $1.72 billion in interest expense, about 15.46 times its net income for the year. Interest consumed 3.14% of revenue, while the company kept only 0.20% of revenue as net profit. Its operating margin was 2.69%, less than half the 5.75% it earned in fiscal 2023. The diluted share count rose 36.61% between fiscal 2020 and fiscal 2025, from about 483.9 million to about 661.1 million shares, a reminder of the equity the company issued to survive the pandemic. Stockholders’ equity was still negative at the end of fiscal 2025, at minus $3.73 billion, an improvement from minus $6.87 billion at the end of fiscal 2020. The record revenue figure is real. So is the fact that almost none of it reaches the bottom line.
There is progress hiding in the same table. Interest expense peaked at $2.15 billion in fiscal 2023 and fell 20.00% to $1.72 billion in fiscal 2025. On the third-quarter call, management said total debt has come down from about $54 billion at its pandemic peak to about $36 billion today, and the company’s stated target is net debt of 3.0 times EBITDAR. American does not pay a dividend. Its last regular quarterly dividend of $0.10 per share was paid on February 19, 2020, the program was suspended that year, and the company has not declared any special dividends. The third-quarter release does not describe any share repurchase activity, and management’s capital priority remains debt reduction.
The third quarter of 2026, reported on October 22, delivered a split result. Revenue was a third-quarter record of $16.34 billion, up 19.3% from a year earlier, which Isom called “the strongest year-over-year revenue growth in my career, with premium performance leading the way.” Premium revenue grew 22.9% and Main Cabin revenue grew 19.5%, on capacity that rose only 4.2%. Fuel was the problem. The company spent $4.64 billion on fuel in the quarter, up $1.9 billion or 67.5% from a year earlier, at an average of $3.85 per gallon. Operating income was $115 million, the pretax loss was $334 million, and the net loss was $269 million. Excluding special items, the adjusted net loss was $182 million, or $0.28 per share, in line with the consensus estimate in our earnings dataset. Unit costs excluding fuel rose 3.0%.
The guidance is where the quarter turned. For the fourth quarter, American expects revenue to rise 19.5% to 22.5% from a year earlier on capacity growth of 5.5% to 6.5%, and it expects fuel of about $4.70 per gallon, about $2.8 billion more than a year earlier. It guided to an adjusted loss of $0.50 to $1.10 per share for the quarter and cut its full-year 2026 adjusted guidance to a loss of $1.00 to $1.60 per share, from a prior range of a $0.65 loss to a $0.65 profit. Management also said network growth will slow in 2027. The stock opened lower on October 22 at $11.72 and then reversed to close at $12.60, up 2.94%, on volume of about 86.1 million shares, as traders focused on the revenue guidance rather than the fuel bill.
What the quarter proves is that demand for American’s premium cabins, corporate travel, and loyalty products is strong enough to produce record revenue in a difficult cost environment. What it does not prove is that the company can turn that revenue into profit while fuel stays near $4.70 per gallon. American ended the quarter with total debt of $36.37 billion, including operating leases, net debt of $28.08 billion, and total available liquidity of $11.8 billion, plus more than $26 billion of unencumbered assets. Operating cash flow for the first nine months was $4.54 billion against capital spending of $2.73 billion. The chief financial officer expects to end 2026 with net debt of about $30.5 billion, roughly flat with the end of 2025, which means the fuel spike has paused the deleveraging rather than reversed it.
Traders are really asking two questions now. First, is the record revenue a durable shift toward premium and loyalty income that will show up in earnings once fuel normalizes, or is it a pricing response to fuel costs that could fade if demand softens? Second, with the stock up 18.77% since the October 16 close, how much of the rebound is about American and how much is simply the price of oil falling?
The bullish evidence is concrete. Revenue reached a record, premium revenue grew faster than total revenue, managed corporate revenue posted its sixth straight double-digit quarter, and AAdvantage enrollments rose 27.4%. Fourth-quarter revenue guidance of up to 22.5% growth was strong enough to reverse the stock on earnings day. Debt is roughly $18 billion below its pandemic peak, interest expense is falling, liquidity is $11.8 billion, and the company has more than $26 billion of unencumbered assets. The CFO said American expects to lead the network carriers in the spread between unit revenue growth and unit cost growth. On November 10, the company signed a 10.5-year lease at Charlotte Douglas International Airport with about $2 billion of preapproved projects, and Rothschild & Co Redburn upgraded the stock to a bullish rating with a $17.50 target, according to market reports.
That is also where the market could be wrong. The main risk case has four parts. The first is fuel. American expects to pay about $2.8 billion more for fuel in the fourth quarter than a year earlier, and its full-year guidance moved from a possible profit to a loss of up to $1.60 per share in a single quarter. The second is the balance sheet. Net debt of $28.08 billion against a market value of about $9.35 billion means small changes in profit translate into large changes in equity value. The third is the analyst floor. Goldman Sachs holds a bearish rating with an $11 target, and Morningstar cut its fair value estimate to $6.10. The fourth is the industry itself. Every large carrier cut its outlook on fuel this quarter, and if demand softens while costs stay high, the premium story may not be enough. The biggest risk is that the story is wearing a convincing disguise: a record revenue headline sitting on top of a company that expects to lose money for the full year.
The catalyst calendar has three clear items. The first is the price of oil, which has been driven by developments involving Iran and has moved the airline group more than any company news this quarter. The second is holiday travel demand and any update on fourth-quarter revenue trends. The third is the fourth-quarter report, scheduled for January 26, 2027, where the consensus estimate calls for an adjusted loss of $0.68 per share on revenue of about $16.94 billion, along with the company’s first look at 2027.
This setup suits active swing traders who can manage a volatile, heavily traded stock that responds to oil prices as much as to its own news. Over the past 20 sessions, the average daily range was about $0.58, or 4.09% of the latest close, and daily volume averaged about 64 million shares over the same stretch. Earnings reactions are large in both directions. The stock moved 2.94% on the third-quarter 2026 report, 8.32% lower on the second-quarter 2026 report, 2.43% higher on the first-quarter 2026 report, 7.00% lower on the fourth-quarter 2025 report, 5.62% higher on the third-quarter 2025 report, and 9.62% lower on the second-quarter 2025 report. It is less suited to income investors, since there is no dividend, or to anyone who cannot tolerate sharp single-day moves tied to geopolitical headlines.
The early-warning signal to watch is the gap left on November 9. AAL closed at $13.18 on November 6, with a high of $13.28 that day, and opened at $13.76 on November 9 after crude fell. The November 9 low was $13.75, which left an unfilled gap between about $13.28 and $13.75. The November 10 session held above that gap, with a low of $13.94. A close back inside that zone would say the oil-driven breakout is failing, and a close below $13.28 would fill the gap and return the stock to the range it held from late October through November 6.
So the picture heading into this week is an airline with record revenue, a strong premium and loyalty business, a falling interest bill, and a balance sheet still carrying $28.08 billion of net debt, whose stock has rebounded 21.32% from its October 20 intraday low as oil prices eased. The question for the rest of the analysis is how Wall Street is valuing that mix, and what the charts say about whether the rebound has room to continue.
Wall Street Analysts Annual Forecasts
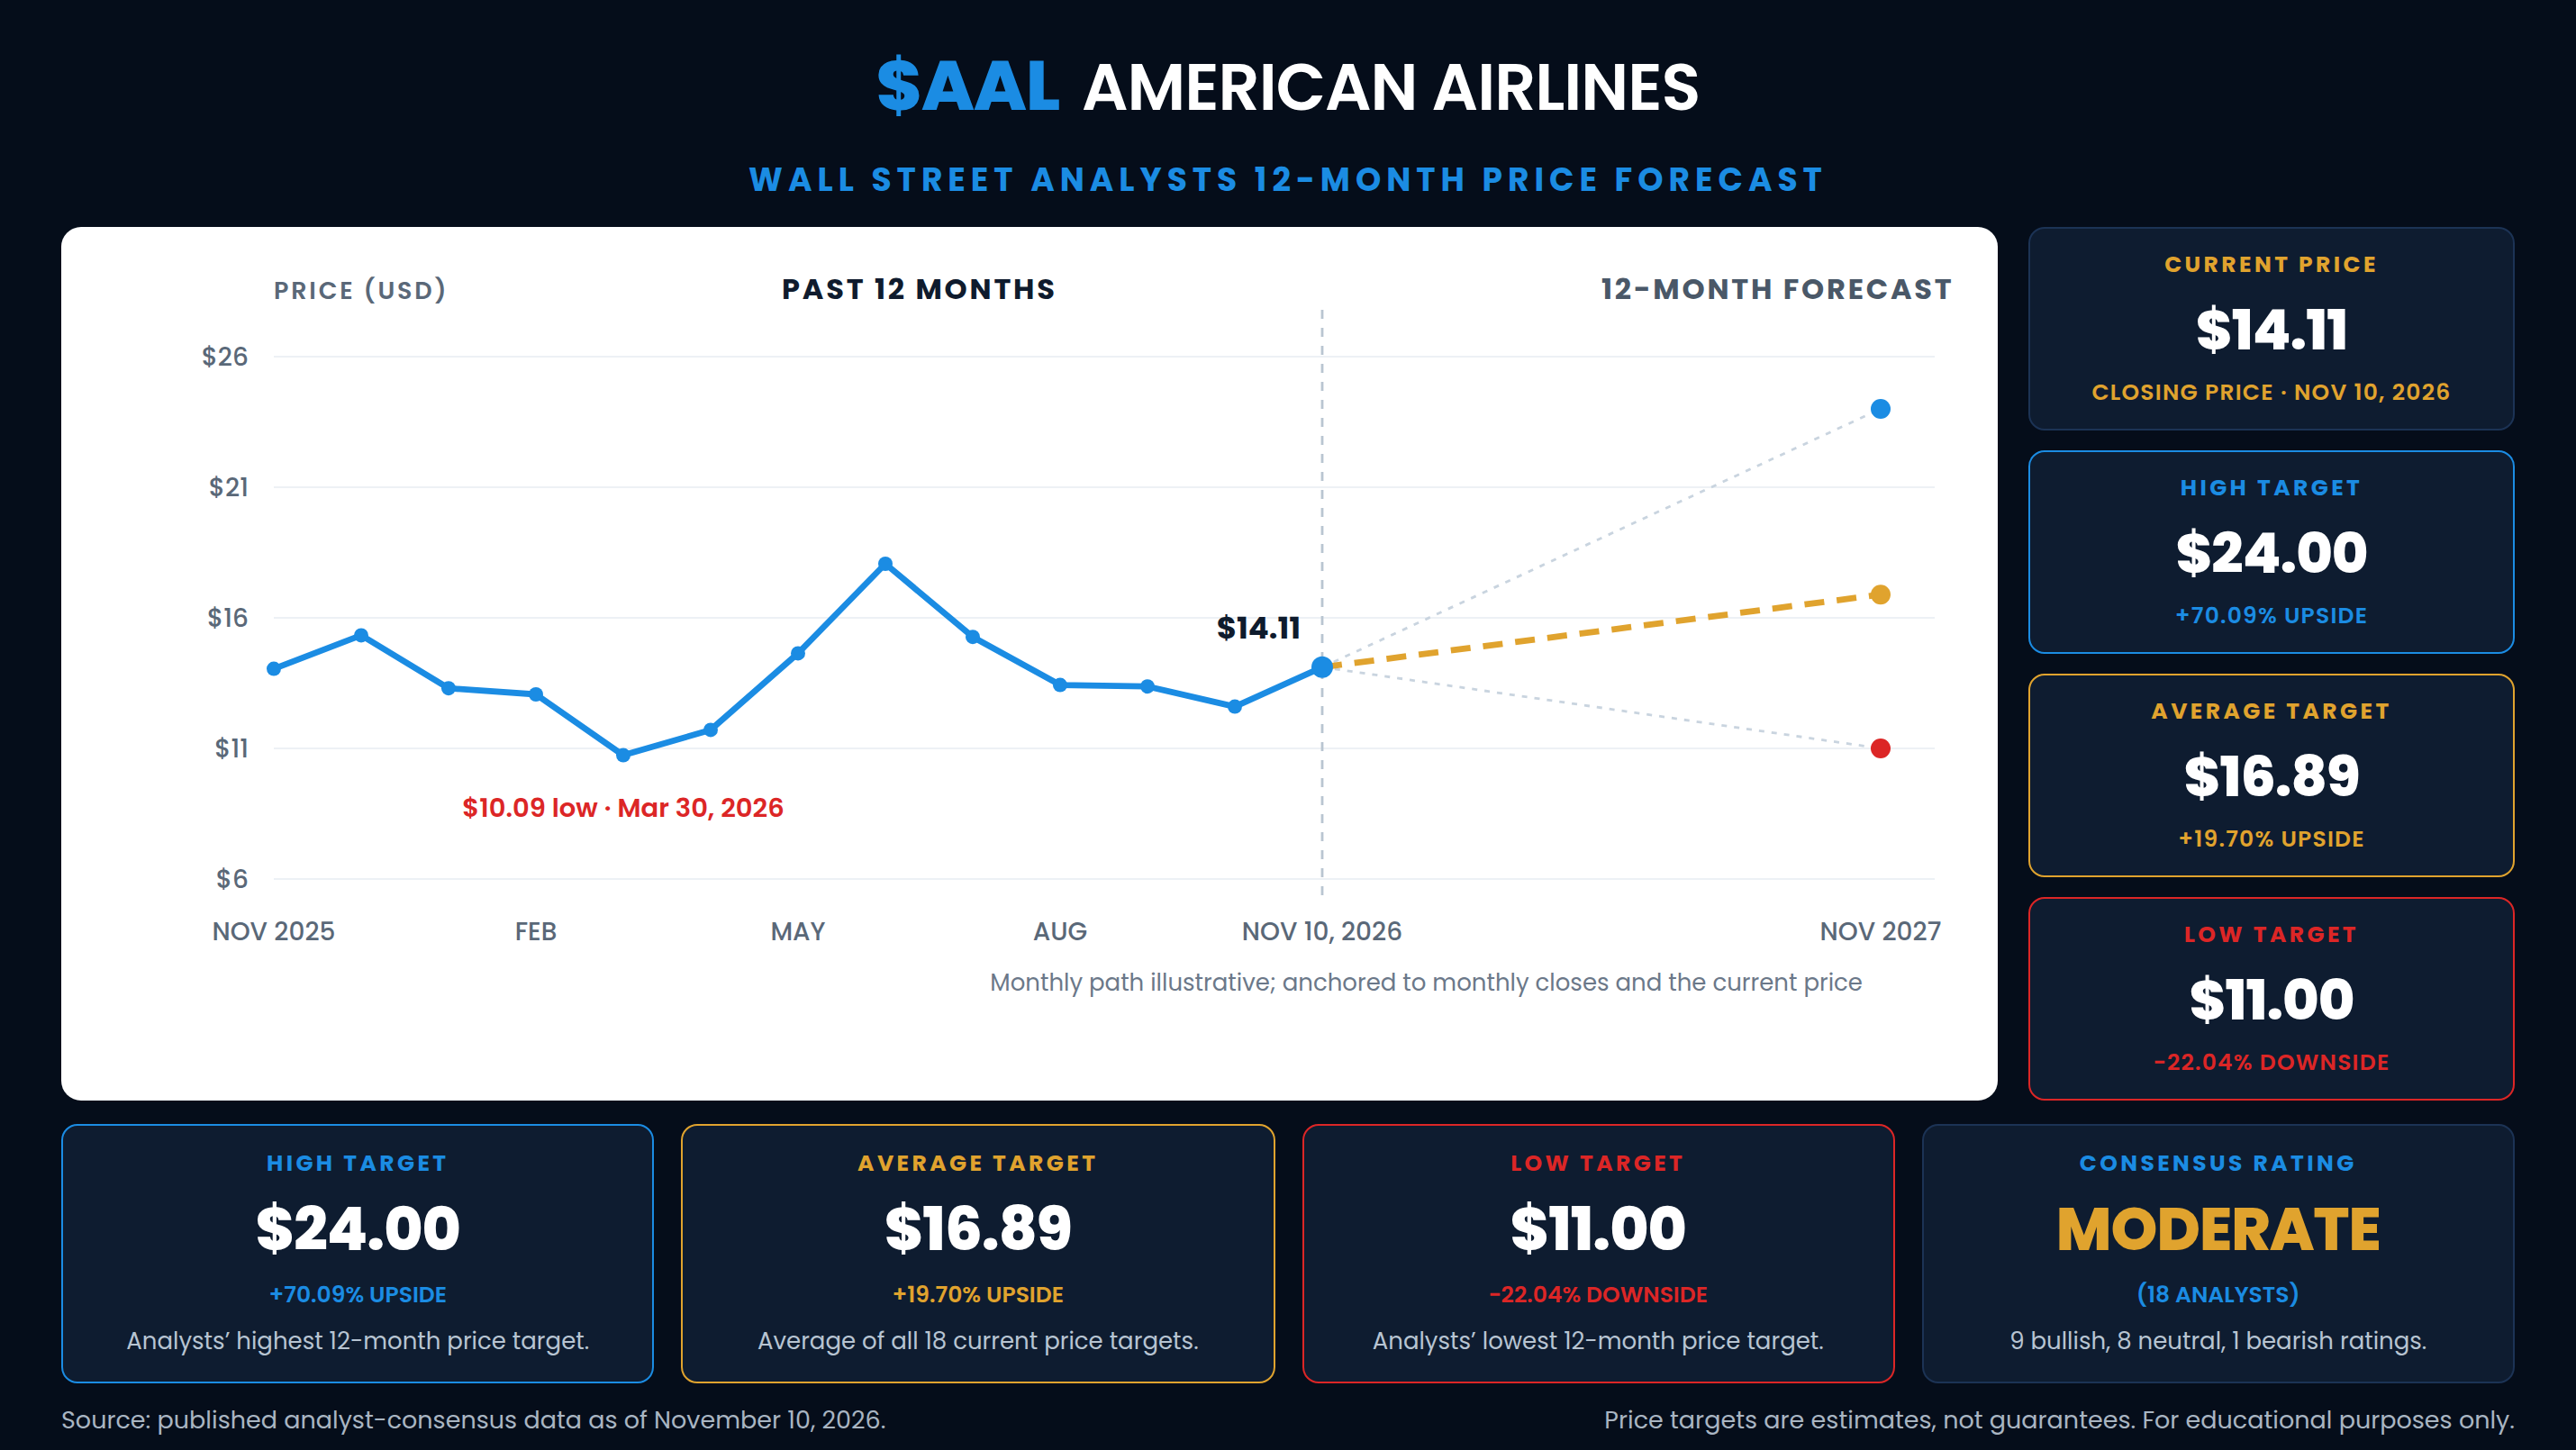
Eighteen analysts are included in the current published consensus for American Airlines, and the consensus is bullish, with nine bullish ratings, eight neutral ratings, and one bearish rating. The average 12-month price target is $16.89, the median target is $16.00, the high target is $24.00, and the low target is $11.00.
Measured against the November 10, 2026 close of $14.11, the average target implies a 19.70% gain. The median target implies a 13.39% gain. The high target implies a 70.09% gain. The low target implies a 22.04% decline. The spread between the high and low target is $13.00, which is 76.97% of the average target and 92.13% of the current share price.
That spread is the story. The high target is JPMorgan’s $24, with an Overweight rating, set on July 24, followed by Bernstein’s $23 with a Market Outperform rating, set on July 1. Morgan Stanley kept its Overweight rating on October 23, the day after the earnings report, but cut its target to $22 from $24. BofA holds a Neutral at $19, Citi a bullish rating at $19, and Melius a Hold at $19 after a downgrade on July 7. Deutsche Bank holds a bullish rating at $18. Freedom Broker kept its bullish rating on October 28 but cut its target to $17 from $18, and UBS kept its bullish rating on October 16 while trimming its target to $16 from $17. Jefferies holds a Hold at $16. BMO holds a Market Perform at $15.50, TD Cowen a bullish rating at $15, and Susquehanna a Positive rating at $15, cut from $20 on October 7. Barclays and Wells Fargo both hold Equal-Weight ratings at $14. Rothschild & Co Redburn held a Neutral at $13.50 in the consensus dataset, and Evercore ISI holds an In-Line rating at $13. The low target is Goldman Sachs’ $11, with a bearish rating set on October 2.
The practical takeaway is that the direction of recent revisions has been lower, even as ratings have mostly held. Morgan Stanley, Freedom Broker, UBS, and Susquehanna all cut targets in October as fuel costs rose, and the two highest targets, JPMorgan’s $24 and Bernstein’s $23, were both set in July. Thirteen of the eighteen targets sit above the current price. The one notable move in the other direction came on November 10, when Rothschild & Co Redburn upgraded the stock to a bullish rating with a $17.50 target, according to market reports. That action is not yet reflected in the consensus figures above. Price targets are estimates of what a security might be worth over a twelve-month horizon under a specific set of assumptions. They are not certainties, and for an airline whose earnings depend on the price of fuel, those assumptions can change quickly.
52-Week High and Low Boundaries Analysis
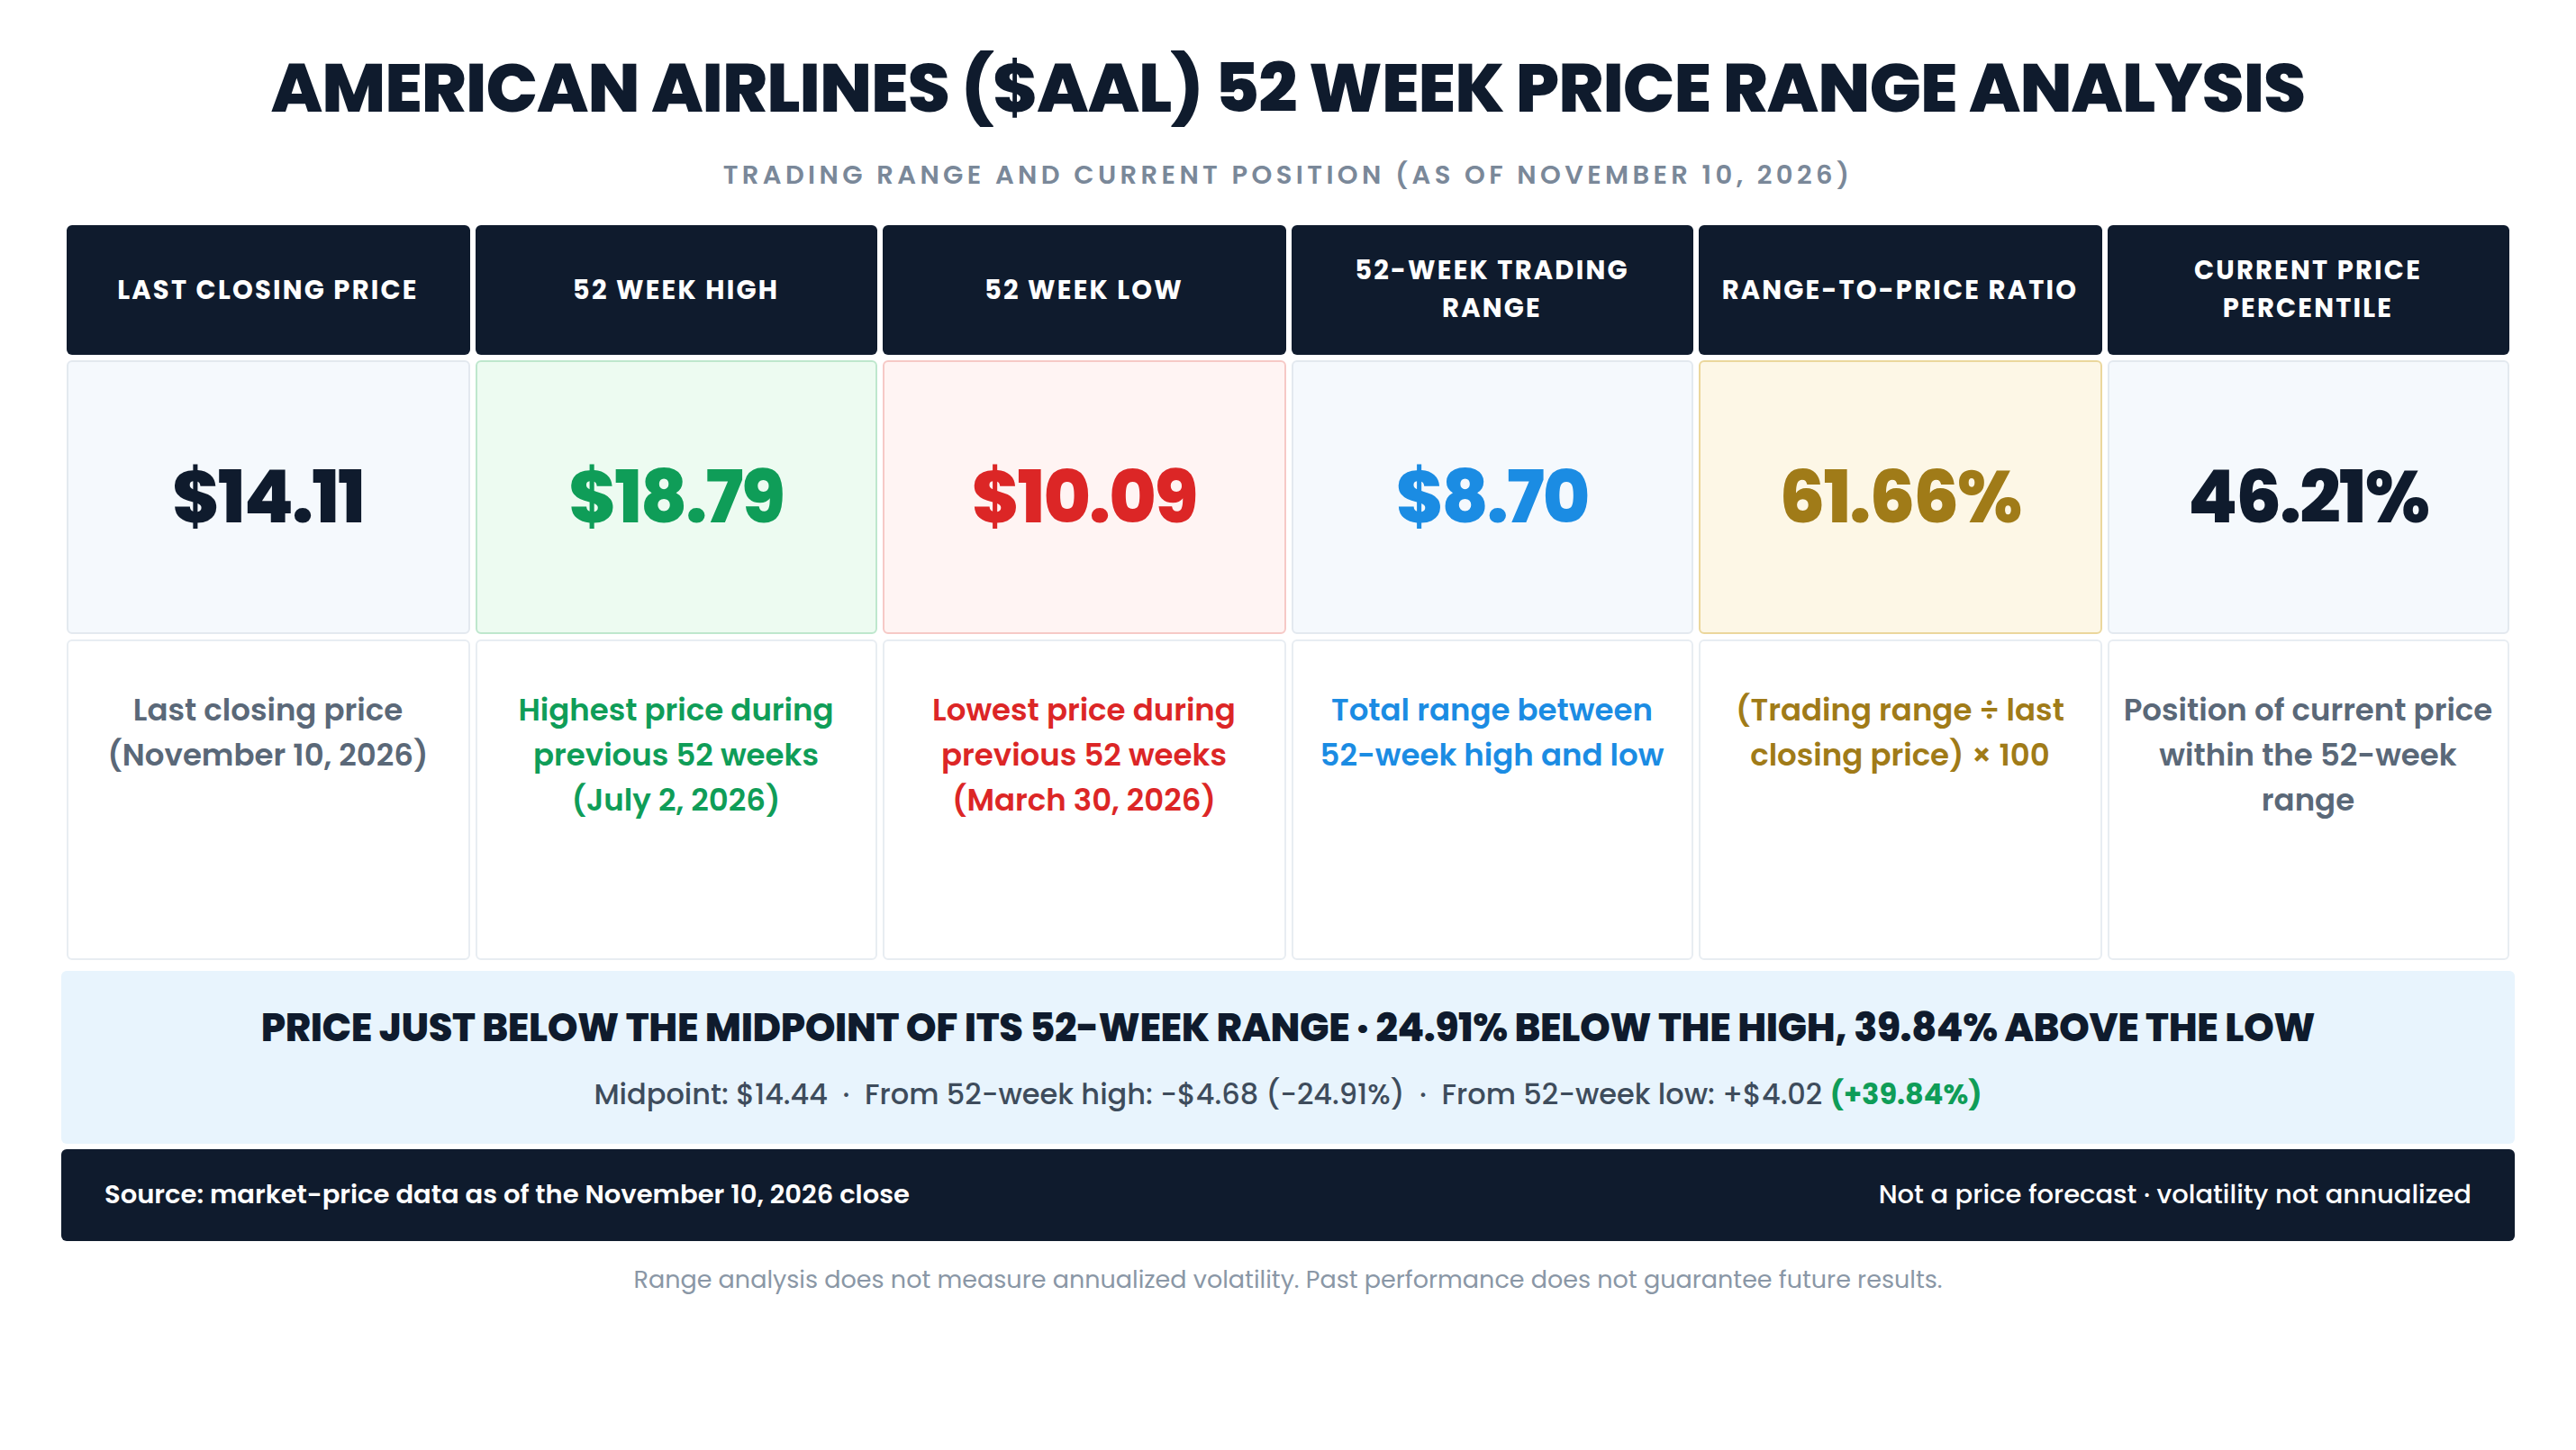
AAL’s 52-week high is $18.79, set on July 2, 2026, and its 52-week low is $10.09, set on March 30, 2026.
The 52-week trading range is $8.70. Divided by the $14.11 closing price, that produces a range-to-price ratio of 61.66%, meaning the distance between the year’s high and low is more than three-fifths of today’s share price. The stock sits at the 46.21st percentile of its range. The midpoint of the range is $14.44, and the November 10 close is 2.29% below that midpoint, a gap of $0.33. The stock needs a 33.17% gain, or $4.68, to reach the 52-week high, and it is 39.84% above the 52-week low. The close is 24.91% below the high.
That combination describes a stock that has climbed back to the middle of a very wide range. A range-to-price ratio above 60% is a sign of extreme volatility for a large company, and both ends of this range were set within about three months of each other. The 52-week high was an intraday level on July 2. The highest close in the window was $18.15, on July 1. The stock is now testing the midpoint from below, and the midpoint sits just above the 100-day moving average of about $14.23, which makes the $14.23 to $14.44 zone the first real test of this rebound.
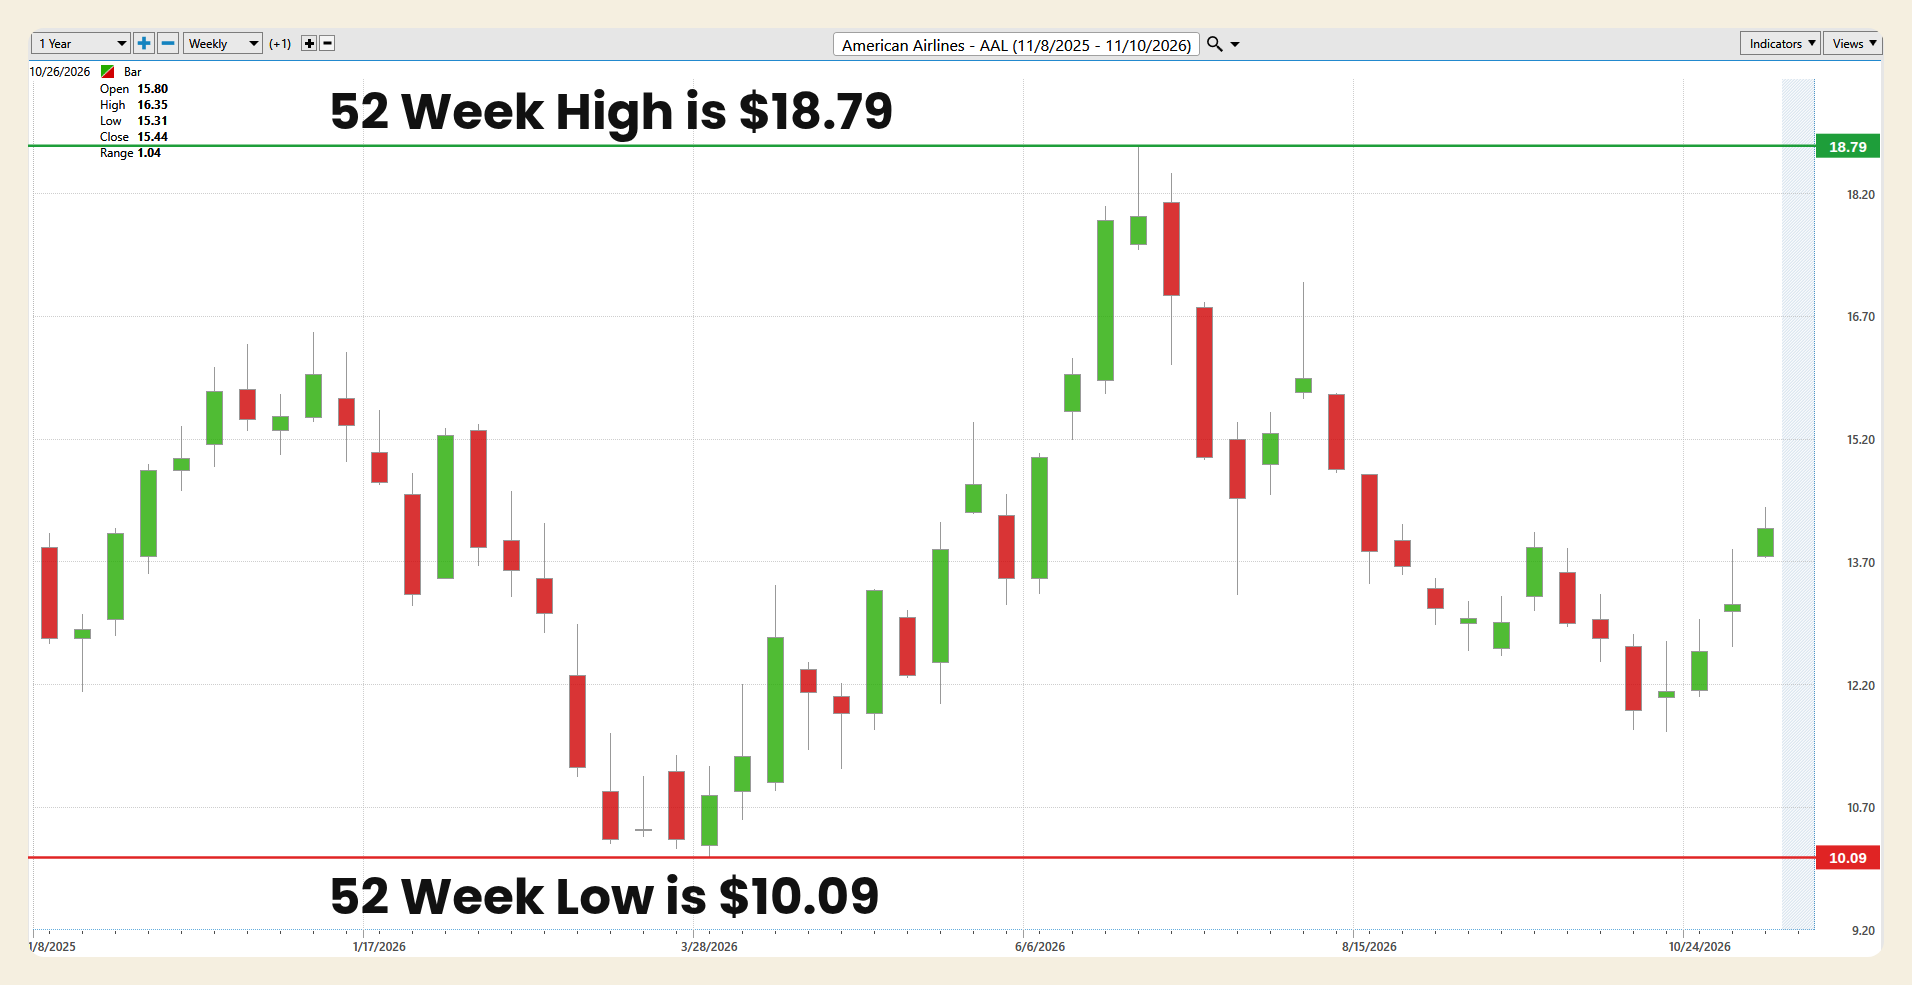
The one-year weekly chart is a series of large swings. The left side shows the stock rising from about $12 in November 2025 to about $16.50 intraday in January 2026. February and March delivered the steepest decline on the chart, a series of red weekly candles that took the stock to the $10.09 low on March 30, a 38.85% drop from the January high. April through June rebuilt the entire loss and more, with large green candles in late June carrying the stock to the $18.79 high on July 2, a gain of 86.22% from the March low in about three months. From July through mid-October, the stock gave back most of that rally, sliding to an intraday low of $11.63 on October 20, a decline of 38.11% from the high. The final three weekly candles are green, rising from about $11.65 to the current week’s high of $14.37. The chart levels described here are approximately read from the weekly candles, and the final candle covers only November 9 and November 10.
Best-Case/Worst-Case Analysis
The best-case historical moves show how quickly this stock can recover. From its May 14, 2020 low of $8.25, AAL rose 216.24% to its March 18, 2021 high of $26.09. Inside the current 52-week window, the stock gained 86.22% from the March 30, 2026 low of $10.09 to the July 2, 2026 high of $18.79, and it has gained 21.32% from the October 20, 2026 intraday low of $11.63 to the November 10 close. The largest single-session gains in the past year were 9.17% on June 11, 2026, 8.05% on June 24, 2026, 8.01% on April 14, 2026, 7.63% on February 6, 2026, and 7.44% on November 9, 2026.
The worst-case historical moves are just as large. From the March 18, 2021 high of $26.09, the stock fell 67.42% to its April 4, 2025 low of $8.50, and the November 10 close is still 45.92% below that 2021 high. Measured from the 52-week high to the 52-week low, the worst-case drawdown is 46.30%. Inside the window, the stock fell 38.85% from its January 2026 high to the March 30 low, and 38.11% from the July 2 high to the October 20 low. The largest single-session declines in the past year were 8.32% on July 23, 2026, the day of the second-quarter report, 7.00% on January 27, 2026, the day of the fourth-quarter 2025 report, 6.24% on February 27, 2026, 5.90% on August 10, 2026, and 5.68% on October 14, 2026.
Historical gains are not forecasts, and historical losses are not predictions. What these figures show is that this stock has real capacity for movement in both directions, with two moves of more than 38% inside a single year and five sessions of more than 7% gains. Position sizing and an exit plan matter, particularly for a stock whose daily direction often depends on the price of oil rather than on anything the company reports.
The condition that keeps the bull case alive is easing fuel prices, fourth-quarter revenue that lands within the 19.5% to 22.5% growth guidance, and a stock that holds above the November 9 gap near $13.75 and, at a minimum, the November 5 low of $12.67. The change of character that would invalidate the thesis is a close back below the October 20 intraday low of $11.63, the low of the entire October decline. That would say the market has rejected the earnings-day reversal and the oil-driven rebound, and returned the stock to the lower third of its range. A nearer warning, short of that break, is a close below $13.28, which would fill the November 9 gap.
The upside opportunity is substantial but contingent.
Relative Strength Comparison
AAL has lagged every major U.S. benchmark over the past year and year to date, and it has led every benchmark over the past month and week. All figures are price returns.
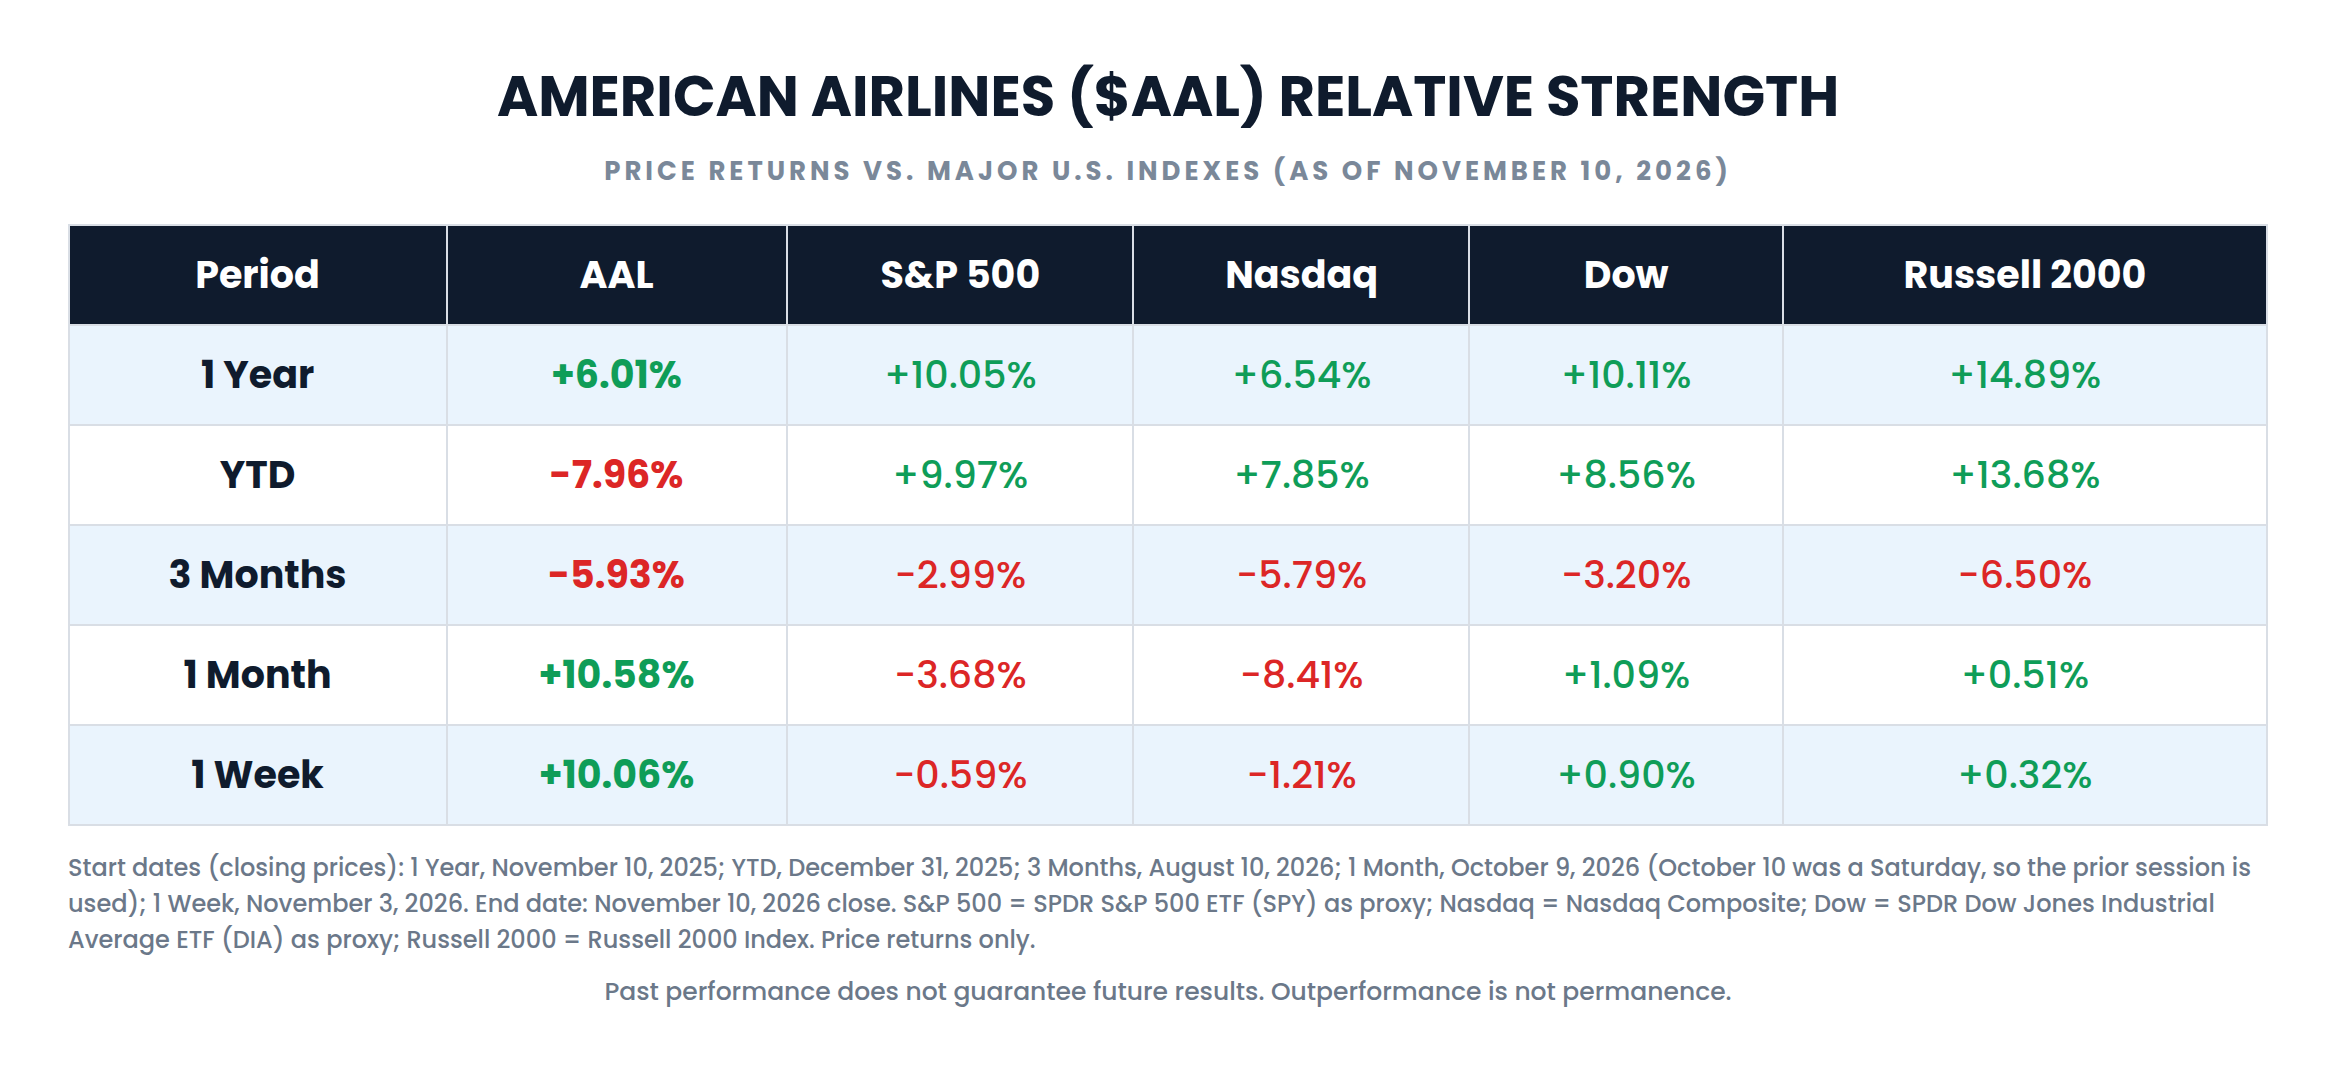
Returns are measured to the November 10, 2026 close from these starting closes: 1 Year, November 10, 2025; YTD, December 31, 2025; 3 Months, August 10, 2026; 1 Month, October 9, 2026; 1 Week, November 3, 2026. October 10, 2026 fell on a Saturday, so the one-month window uses the prior session. S&P 500 refers to the SPDR S&P 500 ETF Trust (SPY), used as a proxy for the index. Nasdaq refers to the Nasdaq Composite. Dow refers to the SPDR Dow Jones Industrial Average ETF Trust (DIA), used as a proxy for the index. Russell 2000 refers to the Russell 2000 Index. All returns exclude dividends.
This is a short-term rebound inside a longer stretch of underperformance. The one-year window starts at the November 10, 2025 close of $13.31. AAL is up 6.01% over that year, behind the S&P 500’s 10.05% and the Russell 2000’s 14.89%, and only roughly level with the Nasdaq’s 6.54%. Year to date, from the December 31, 2025 close of $15.33, AAL is down 7.96% while every index is up, a gap of 21.64 percentage points against the Russell 2000. The three-month figure shows AAL down 5.93%, near the middle of a group of declining benchmarks. The shorter windows are where the strength is concentrated. Over one month, AAL is up 10.58% while the Nasdaq fell 8.41%, a gap of 18.99 percentage points. Over one week, from the November 3 close of $12.82, it is up 10.06% while the S&P 500 and the Nasdaq declined.
The comparison with its own industry is just as important. The table below uses the same windows and closing dates.
| Ticker | 1 Year | YTD | 3 Months | 1 Month | 1 Week |
|---|---|---|---|---|---|
| AAL | +6.01% |
-7.96% |
-5.93% |
+10.58% |
+10.06% |
| DAL | +57.45% |
+32.85% |
+3.35% |
+12.21% |
+10.71% |
| UAL | +25.40% |
+7.82% |
-2.59% |
+12.19% |
+12.45% |
| LUV | +41.82% |
+12.07% |
+3.16% |
+11.19% |
+6.61% |
| ALK | -1.94% |
-17.42% |
-12.10% |
+5.54% |
+12.94% |
| JETS | +20.09% |
+7.55% |
-3.98% |
+9.98% |
+9.34% |
| IYT | +16.09% |
+12.49% |
-3.56% |
+4.58% |
+1.38% |
| XTN | +20.87% |
+12.70% |
-6.69% |
+3.19% |
+2.25% |
DAL is Delta Air Lines, UAL is United Airlines Holdings, LUV is Southwest Airlines, and ALK is Alaska Air Group. JETS is the U.S. Global Jets ETF, IYT is the iShares U.S. Transportation ETF, and XTN is the SPDR S&P Transportation ETF.
Over one year, the transportation sector beat the S&P 500, with the SPDR S&P Transportation ETF up 20.87% and the airline ETF up 20.09%. American captured little of that. Delta is up 57.45% over the same year and Southwest 41.82%, while AAL is up 6.01%. Over one week, the picture changes. American’s 10.06% gain is close to Delta’s 10.71% and the airline ETF’s 9.34%, and behind United’s 12.45% and Alaska’s 12.94%. The past week was an airline rally driven by falling oil, not a rally specific to American. Rallies built on a single input can extend while that input keeps moving in the right direction. They can also reverse in a session when it does not. Outperformance is not permanence.
VantagePoint AI Predictive Blue Line
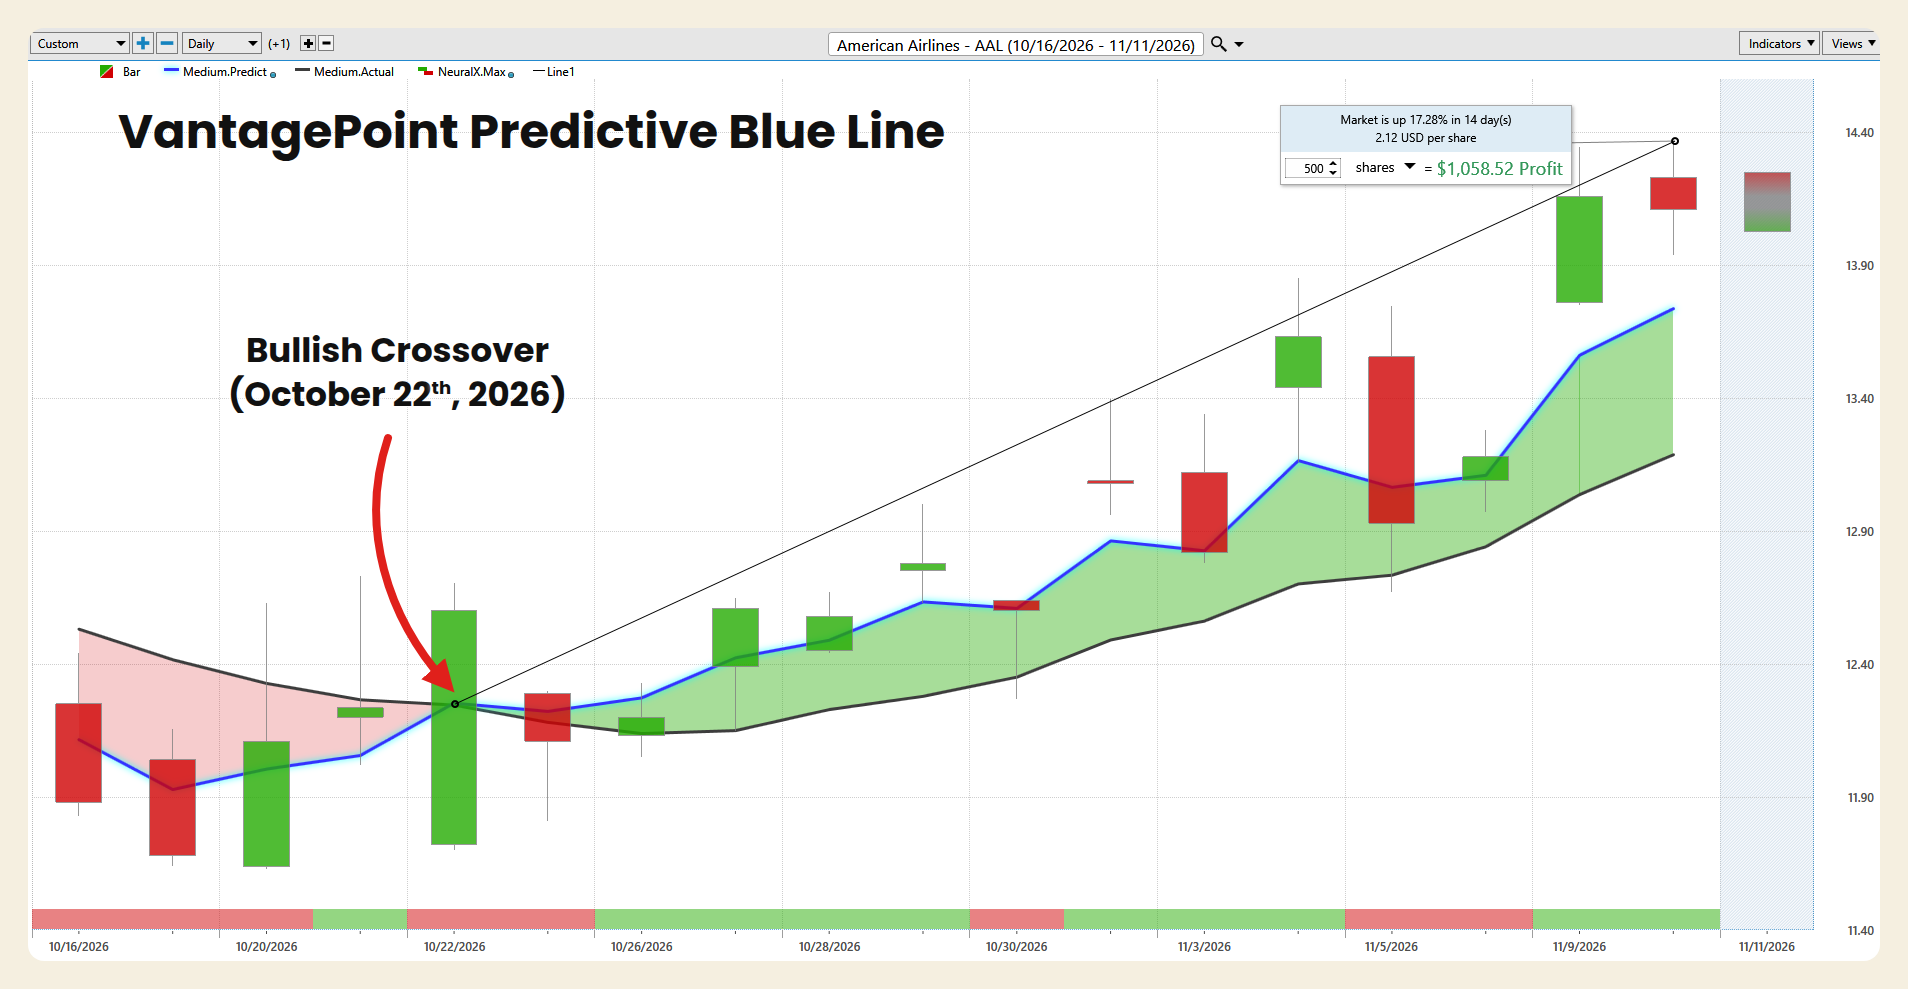
The chart covers October 16 through November 10, 2026, with the November 11 forecast slot on the right edge. From October 16 through October 21, the Predictive Blue Line sat below the black actual moving average, and the band between them was shaded red, as the stock traded between about $11.63 and $12.24 after a series of price-target cuts and rising fuel costs. The blue line crossed above the black line on October 22, the day of the third-quarter report, at approximately $12.27, and the shading turned green. That bullish crossover came on the same session the stock reversed from an early decline to close up 2.94% at $12.60, and two sessions after the October 20 intraday low.
Since the crossover, the blue line has stayed above the black line through the entire window, including the 3.89% decline on October 23 and the 5.14% decline on November 5. It rose in most sessions, with small dips on October 23, October 30, November 3, and November 5, and each time it resumed its climb without crossing back below the black line. At the right edge of the chart, on November 10, the blue line sits at approximately $13.73 and the black line at approximately $13.19, a separation of about $0.54. The November 10 close of $14.11 sits above both lines, about 2.77% above the blue line, which tells you price is running ahead of the forecasted trend after the 7.44% gain on November 9. The platform’s on-chart measurement reads 17.28% over 14 days, or $2.12 per share, for the move it tracks from the crossover to the November 10 high. From the October 22 close, the day of the crossover, the stock is up 11.98% to the November 10 close.
The distinction matters. The Blue Line turned on the day of the earnings reversal and has held through two sharp single-day declines since. The current reading is bullish, with a rising forecast and a separation that has widened through November. It is also a reading covering less than three weeks, built during a period when oil prices have driven the entire airline group. The reading that would change the picture is a flattening of the blue line followed by a cross back below the black line, especially if it arrives while the stock is testing the $14.23 to $14.44 zone around the 100-day moving average and the range midpoint.
VantagePoint AI Neural Index
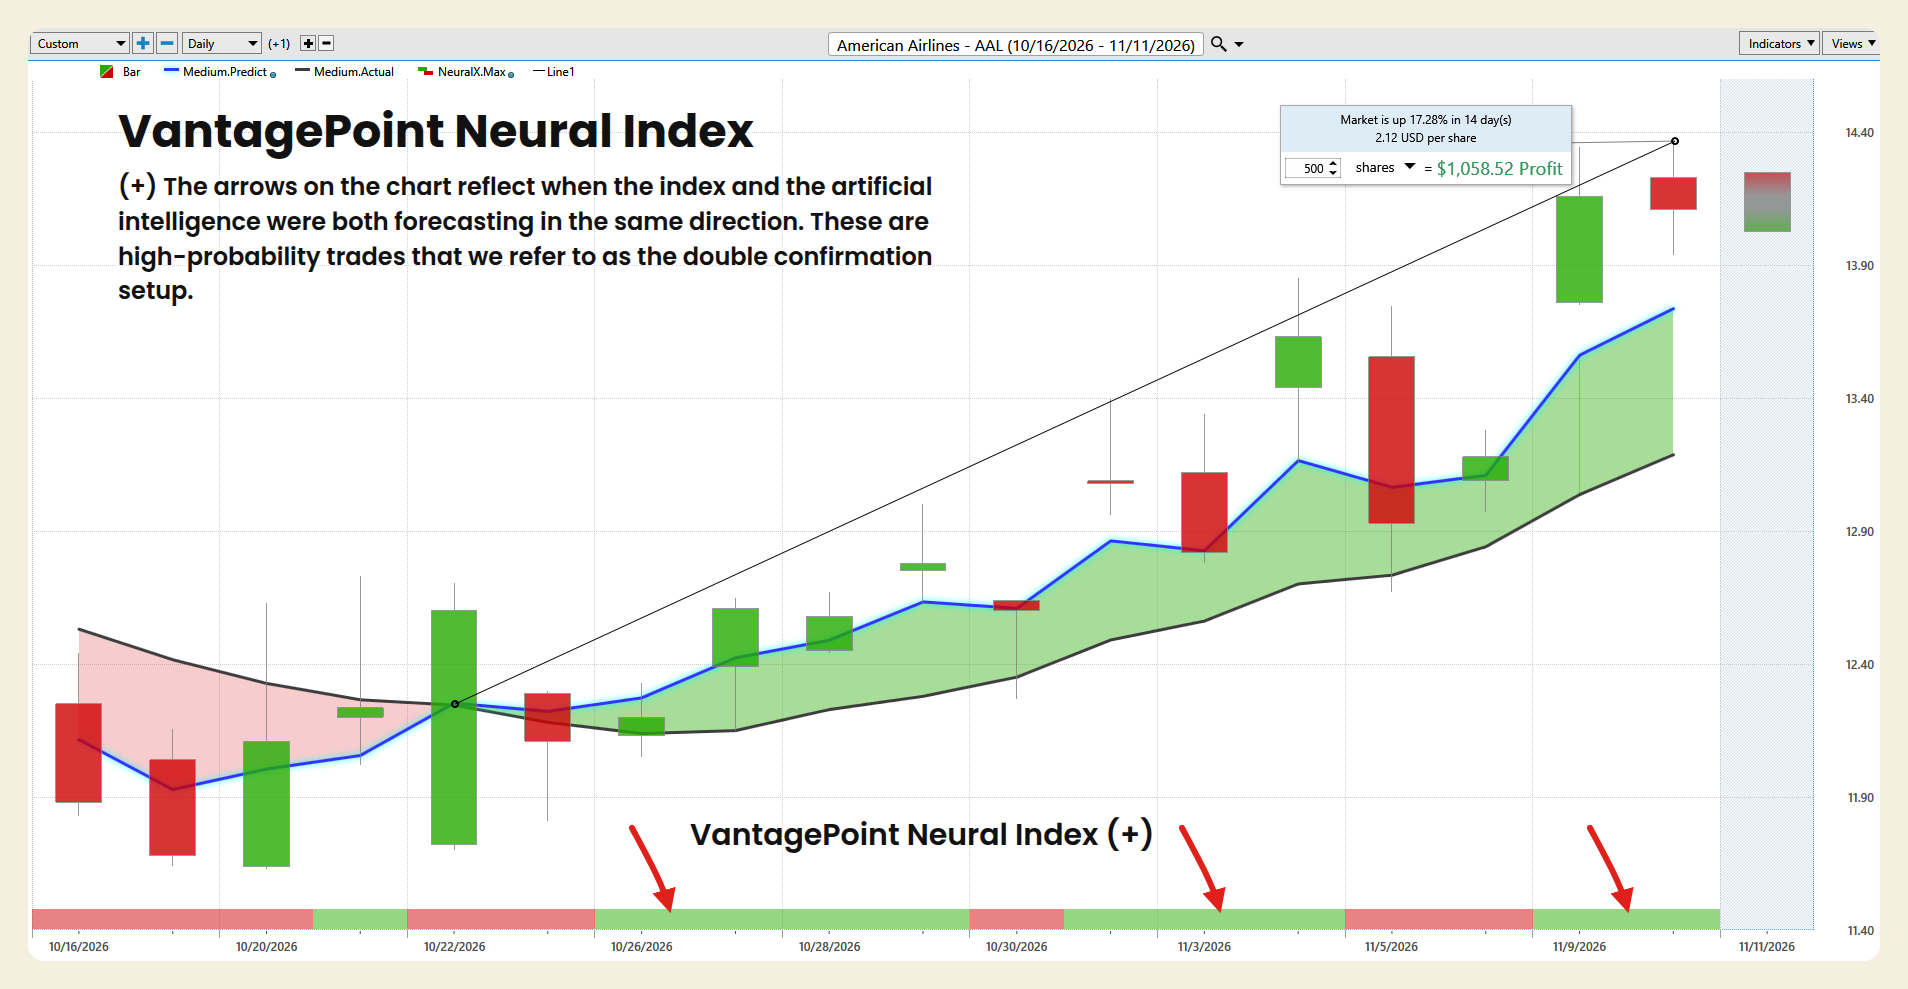
The strip has alternated throughout the window, which fits a stock moving several percent a day on oil headlines. It was red from October 16 through October 20, the sessions around the low, and green on October 21. It turned red on October 22 and October 23, the earnings session and the 3.89% decline that followed. It was green from October 26 through October 29, red on October 30, and green again from November 2 through November 4. It turned red on November 5 and November 6, and the stock fell 5.14% on November 5. It has been green on November 9 and November 10, the sessions of the 7.44% gain and the hold above $14.
When the Neural Index and the Predictive Blue Line agree, VantagePoint refers to the setup as a double confirmation. The blue line crossed above the black line on October 22, so every green reading from that point forward came with the crossover in place. The double confirmation windows on this chart run from October 26 through October 29, from November 2 through November 4, and on November 9 and November 10, and the arrows mark each of the three windows. Each window began after a short red reading, and each red reading came while the Blue Line stayed bullish. The stock dipped during those red stretches without breaking the trend, closing at $12.11 on October 23, $12.60 on October 30, and $13.18 on November 6, each one higher than the last. The item to watch now is the next red reading. After the largest single-day gain of the window, a red print would be the earliest sign that short-term momentum is cooling, even if the Blue Line still points higher.
VantagePoint AI Daily Range Forecast
The VantagePoint AI Daily Range Forecast projects a predicted high and a predicted low for the next trading session. The red line marks the predicted high and the dark line marks the predicted low. Together they frame where price is expected to trade, giving traders a structure for entries, exits, and stop placement.
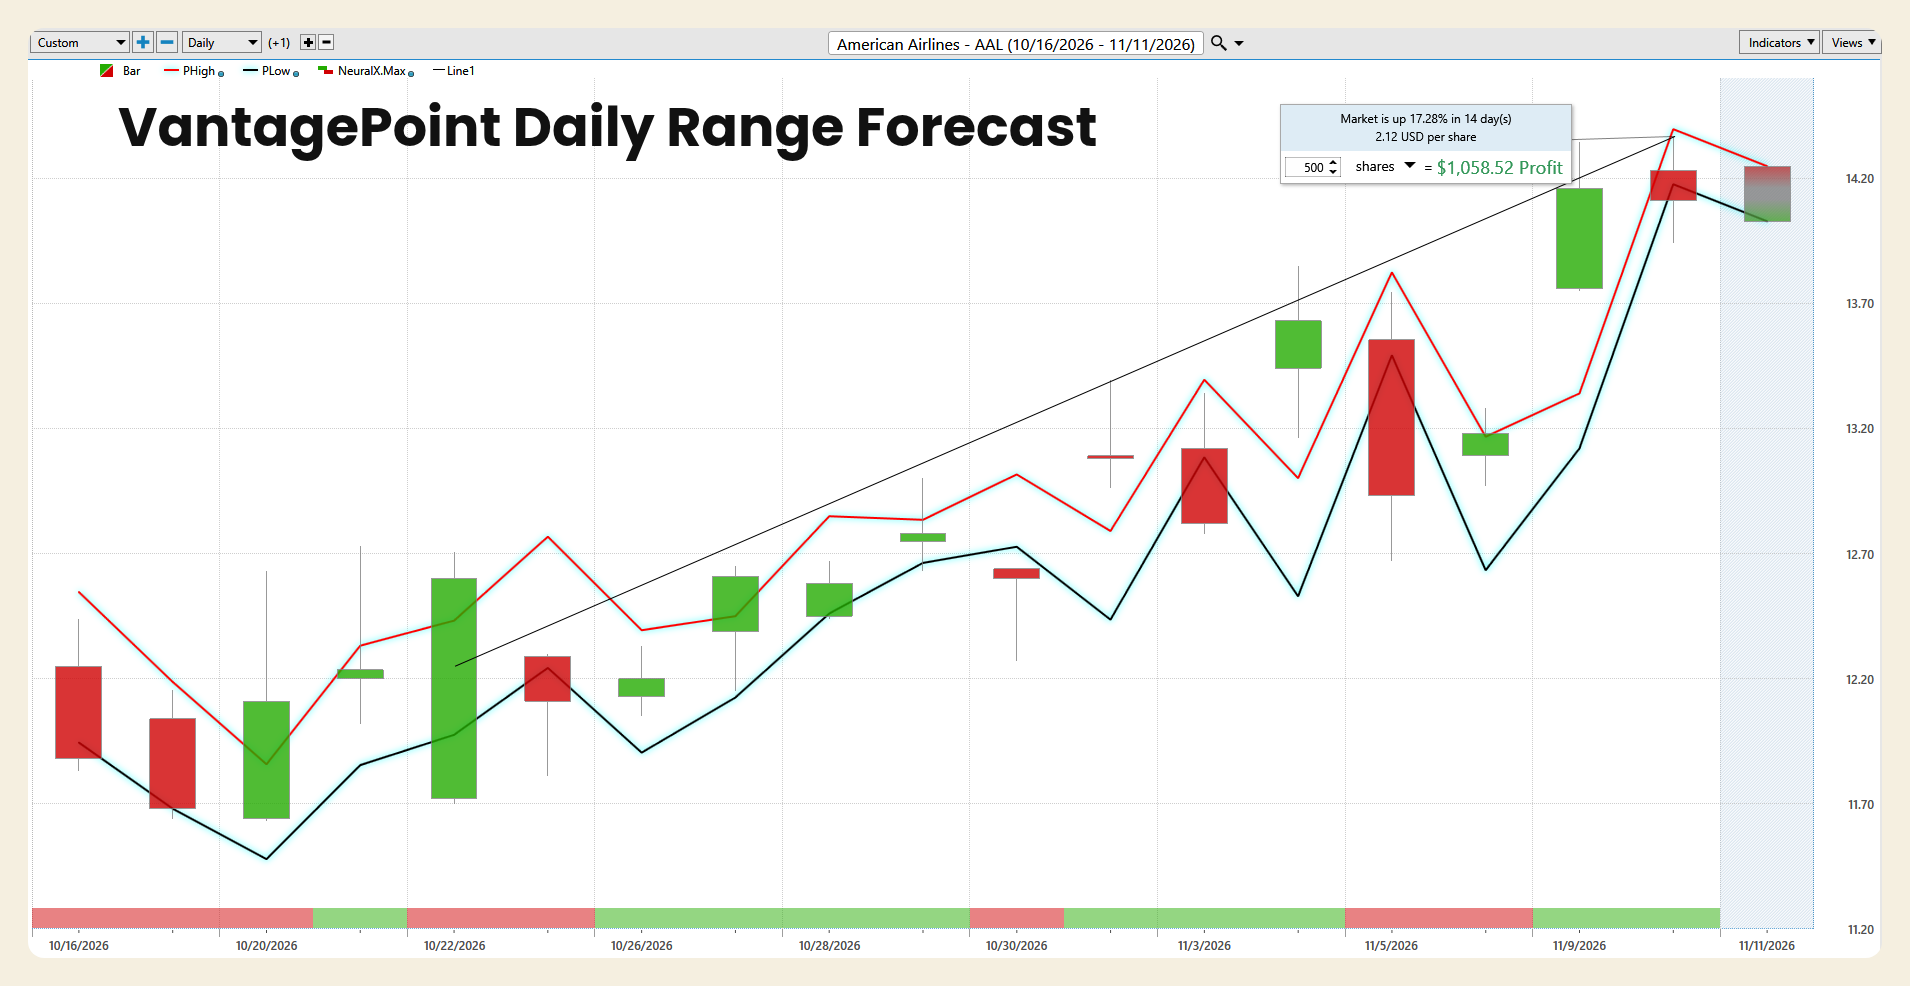
Two recent sessions show how far this stock can travel outside its forecast range when oil moves. The forecast for November 5 had a predicted high of approximately $13.80, and the stock’s actual high was $13.75, right at the upper boundary. It then fell to $12.67 during the broad market decline, well below the predicted low. The forecast for November 9 had a predicted high of approximately $13.34. The stock opened at $13.76 after crude fell and traded as high as $14.35, about $1 above the predicted high. That was a breakout beyond the forecast range.
For November 10, the predicted high was approximately $14.40 and the predicted low was approximately $14.17. The actual high of $14.37 came close to the predicted high, but the low of $13.94 undercut the predicted low by about $0.23, and the close of $14.11 finished just below it. For November 11, the forecast built from the November 10 data shows a predicted high of approximately $14.25 and a predicted low of approximately $14.03, a projected range of about $0.22, or 1.56% of the November 10 close. That is much narrower than the stock’s recent behavior. Across the past 20 sessions, the average daily range was about $0.58, or 4.09% of the latest close.
The more important observation is the direction of both boundaries. The predicted high and the predicted low have been rising since October 20, and both lines stepped higher after November 6. When both boundaries rise together, the forecast is describing a trending market rather than a range-bound one. The November 11 band sits slightly below the November 10 band, which suggests the forecast is pausing after the sharp November 9 move rather than extending it, and it is centered close to the November 10 close.
For a trader, the practical use is straightforward. A move toward the predicted low, near $14.03 for November 11, would be a test of the short-term trend rather than a break of it. A close below the predicted low, especially on a day when the Neural Index turns red, would be the first sign that the rising structure is weakening, and the November 10 session already closed slightly below its own predicted low. Upper-band trading near $14.25 is the zone where short-term traders tend to tighten stops rather than chase, particularly with the 100-day moving average near $14.23 and the range midpoint at $14.44 just above it. With a stock this volatile, the band is a frame for the session, not a wall.
Intermarket Analysis
No stock trades in isolation. VantagePoint’s Intermarket Analysis identifies the related markets whose price behavior has the greatest influence on the forecast for a given stock, and it feeds those relationships into the AI models behind the readings above.
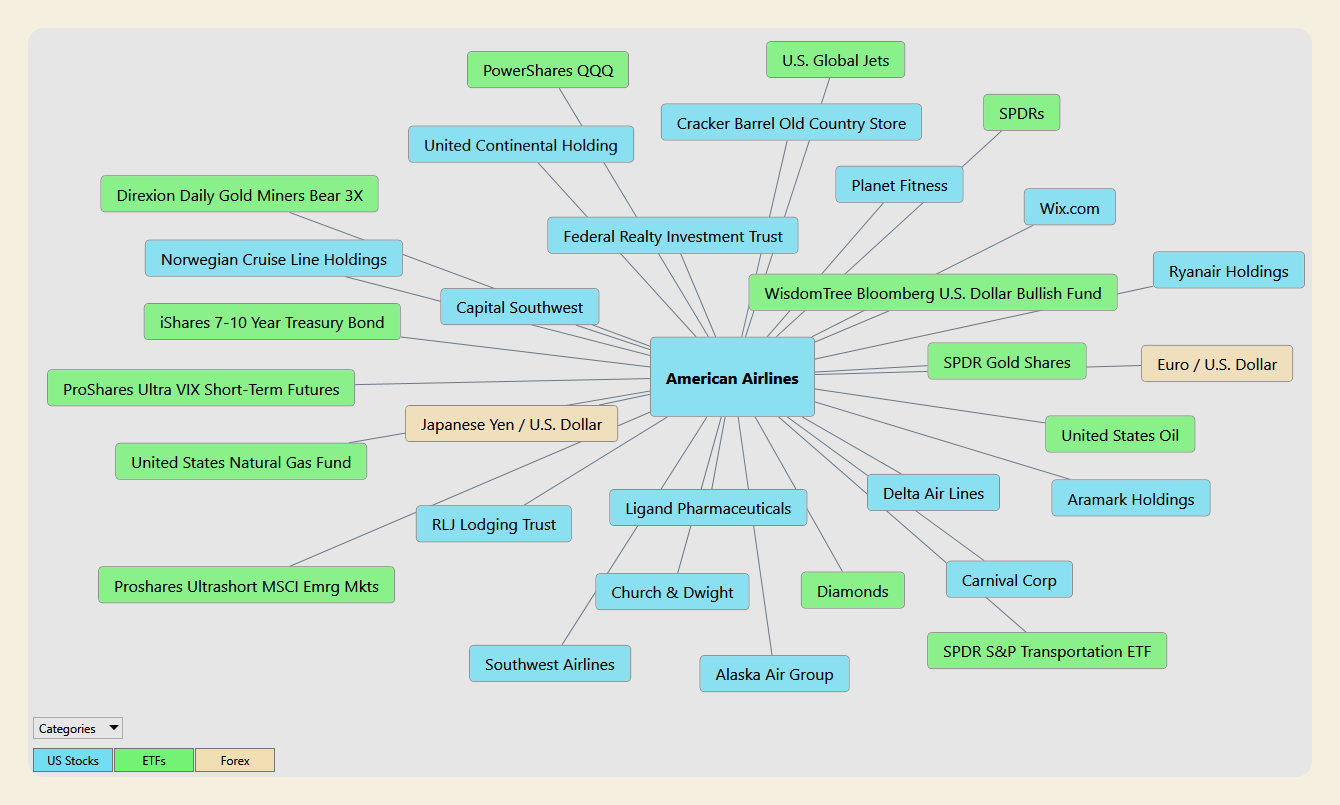
For American Airlines, the map includes 16 U.S. stocks, 13 exchange-traded funds, and 2 currency pairs. The U.S. stocks are United Continental Holdings, Cracker Barrel, Federal Realty, Planet Fitness, Wix.com, Ryanair, Norwegian Cruise Line, Capital Southwest, RLJ Lodging, Ligand Pharmaceuticals, Church & Dwight, Southwest Airlines, Alaska Air Group, Delta Air Lines, Carnival, and Aramark. The ETFs are PowerShares QQQ, the U.S. Global Jets ETF, SPDRs, the Direxion Daily Gold Miners Bear 3X fund, the iShares 7-10 Year Treasury Bond fund, the ProShares Ultra VIX Short-Term Futures fund, the United States Natural Gas Fund, the ProShares UltraShort MSCI Emerging Markets fund, the WisdomTree Bloomberg U.S. Dollar Bullish Fund, SPDR Gold Shares, United States Oil, Diamonds, and the SPDR S&P Transportation ETF. The currency pairs are the Japanese yen against the U.S. dollar and the euro against the U.S. dollar.
What stands out is how heavily the map leans on the airline industry itself. Five airlines appear: United, Delta, Southwest, Alaska Air, and Ryanair, along with the U.S. Global Jets ETF and the SPDR S&P Transportation ETF. That fits a week in which American’s gain tracked Delta’s and the airline ETF’s almost point for point. The model is weighing whether money is moving toward or away from airlines and transportation as a group, which is exactly what happened on November 4 and November 9, when the whole group rallied as oil fell.
The second cluster is travel and leisure demand. Norwegian Cruise Line and Carnival are cruise operators, RLJ Lodging is a hotel owner, and Planet Fitness, Cracker Barrel, and Aramark are tied to consumer spending away from home. These markets reflect the same discretionary travel and leisure spending that fills airline seats, and they help the model read the consumer backdrop. The third cluster is the energy and macro tape. United States Oil connects directly to jet fuel, which cost American $4.64 billion in the third quarter alone. The United States Natural Gas Fund, SPDR Gold Shares, and the Direxion gold miners fund describe the commodity and inflation picture, while the iShares 7-10 Year Treasury Bond fund connects to interest rates, which matter for a company carrying more than $36 billion of debt.
The remaining markets describe the backdrop rather than the business. SPDRs, Diamonds, and PowerShares QQQ capture broad equity direction, and the ProShares Ultra VIX fund captures the volatility that hit the market on November 5. The WisdomTree dollar fund, the ProShares UltraShort emerging markets fund, the yen, and the euro connect to the dollar and to international travel flows, relevant for an airline flying to more than 60 countries. Federal Realty, Wix.com, Capital Southwest, Ligand Pharmaceuticals, and Church & Dwight are not business peers. They are correlation inputs. Their presence on the map does not mean shopping centers or a consumer products company move airline demand. It means those markets have had a statistical relationship with AAL’s price that the model treats as useful.
The distinction matters. Intermarket Analysis does not claim that any one of these markets moves AAL on a given day. It recognizes that an airline is exposed to oil, its competitors, consumer travel demand, interest rates, the dollar, and the broader equity tape all at once, and it lets the AI weigh those influences together rather than asking a trader to track 31 charts by hand.
Our Suggestion
American Airlines is a company where two honest stories are true at the same time. The first is an airline that earned only $111 million on $54.63 billion of revenue in fiscal 2025, paid about 15.46 times that amount in interest, still carries negative stockholders’ equity and $28.08 billion of net debt, expects to lose $1.00 to $1.60 per share in 2026 because of fuel, and trades 45.92% below its 2021 high and well behind Delta, United, and Southwest over the past year. The second is a company that just reported record quarterly revenue up 19.3%, guided to as much as 22.5% revenue growth in the fourth quarter, is growing premium, corporate, and loyalty revenue at double-digit rates, has cut its debt by roughly $18 billion from the pandemic peak, and holds $11.8 billion of liquidity. Most of the period from July through mid-October gave more weight to the first story. The past three weeks, helped by falling oil, gave more weight to the second.
That is the trade in one sentence: $AAL is a bet that American’s record revenue and premium growth survive long enough for fuel costs to ease, and the bet holds only if oil keeps cooperating and the fourth-quarter report confirms the revenue guidance.
The weekly chart frames the opportunity and the risk. AAL sits at the 46.21st percentile of its 52-week range, 2.29% below the $14.44 midpoint, with 33.17% of room to the $18.79 high and 39.84% of room down to the $10.09 low. The stock has repaired about a third of its July through October decline, and it has not yet cleared the midpoint or the 100-day moving average just below it.
Taken together, the VantagePoint readings are constructive on a short window. The Predictive Blue Line crossed above the black line on October 22, the day of the earnings reversal, and has held above it through two sharp declines. The Neural Index has produced three double confirmation windows since the crossover, from October 26 through October 29, from November 2 through November 4, and on November 9 and November 10, with each pullback in between closing higher than the last. The Daily Range Forecast shows both boundaries rising since October 20, with a narrow projected band of approximately $14.03 to $14.25 for November 11. The trend says stay interested. The volatility says stay alert.
The risks are clear. Recent analyst revisions have mostly been cuts, the low target sits 22.04% below the current price, and Morningstar’s fair value estimate is $6.10. The past week’s gain was an industry-wide move tied to oil prices, and the November 10 session already closed slightly below its own predicted low. The stock fell 5.14% in a single session as recently as November 5, and it has fallen more than 38% twice in the past year. Momentum is not safety, and a heavily indebted airline whose full-year outlook swung from a possible profit to a loss in one quarter has shown how quickly fuel can change the picture.
For traders, the disciplined approach is to let the VantagePoint readings define the risk rather than the headline alone. A Neural Index turning red, a flattening Predictive Blue Line, or a close below the predicted low would each be a reason to tighten risk. A close back inside the November 9 gap, below about $13.75, would signal that the oil-driven breakout is fading, a close below the November 5 low of $12.67 would undo most of the November advance, and a close below the October 20 low of $11.63 would indicate that the character of the trend has changed. Until then, the evidence favors respecting the short-term uptrend while keeping position size modest enough to absorb an oil-driven reversal in a stock that routinely moves 4% in a day.
Historical returns and technical signals are not guarantees of future results. They are tools for framing probability and managing risk.
Practice great money management on every trade, and use the VantagePoint AI Daily Range Forecast to identify short-term trading opportunities while keeping risk firmly under control.
It’s not magic.
It’s machine learning.
Disclaimer: THERE IS A HIGH DEGREE OF RISK INVOLVED IN TRADING. IT IS NOT PRUDENT OR ADVISABLE TO MAKE TRADING DECISIONS THAT ARE BEYOND YOUR FINANCIAL MEANS OR INVOLVE TRADING CAPITAL THAT YOU ARE NOT WILLING AND CAPABLE OF LOSING.
EXAMPLES ARE SUCCESS STORIES AND ATYPICAL. PAST RESULTS DO NOT GUARANTEE FUTURE PERFORMANCE.
VANTAGEPOINT’S MARKETING CAMPAIGNS, OF ANY KIND, DO NOT CONSTITUTE TRADING ADVICE OR AN ENDORSEMENT OR RECOMMENDATION BY VANTAGEPOINT AI OR ANY ASSOCIATED AFFILIATES OF ANY TRADING METHODS, PROGRAMS, SYSTEMS OR ROUTINES. VANTAGEPOINT’S PERSONNEL ARE NOT LICENSED BROKERS OR ADVISORS AND DO NOT OFFER TRADING ADVICE.