











This week’s AI stock spotlight is Extra Space Storage ($EXR).
Extra Space Storage is a self-storage real estate investment trust based in Salt Lake City, Utah. Founder Ken Woolley started the company in 1977, it went public in August 2004, and it is a member of the S&P 500. It employs about 8,393 people. The company is the second-largest owner and operator of self-storage in the United States and the largest self-storage management company in the country. At September 30, 2026, it owned or operated 4,411 stores across 43 states and Washington, D.C. Its Chief Executive Officer is Joe Margolis, who has led the company since January 2017 and retires at the end of 2026. President Noah Springer, who joined the company in 2006, becomes the fourth chief executive in the company’s history on January 1, 2027.
The business model is simple to describe and hard to copy. Extra Space rents storage units by the month to households and small businesses, and most of its revenue comes from those rents at stores it owns outright or through joint ventures. The second engine is management. Extra Space runs 1,963 stores for third-party owners and 408 stores held in unconsolidated joint ventures, 2,371 stores in all, and collects fees and tenant insurance revenue on that platform without owning the real estate. Its main competitors are Public Storage, the largest owner in the industry, and CubeSmart. The differentiation Extra Space claims is its operating platform: a centralized pricing, digital marketing and customer acquisition system that it applies to every store it owns or manages. The clearest test of that platform was the Life Storage merger, an all-stock deal that closed on July 20, 2023. The company onboarded about 1,200 Life Storage locations onto its systems in 19 days.
On November 3, 2026, EXR closed at $156.23, up 0.16%, after trading between $154.16 and $156.25 on volume of about 1.35 million shares. That close came one session after a 3.08% gain on November 2, when the self-storage group rallied on read-throughs from strong third-quarter results across the sector. From the October 27 close of $144.55, the last close before the third-quarter report, the stock is up 8.08%. From the October 2 close of $133.25, it is up 17.25%. The stock is relevant this week because it has climbed from the bottom of its 52-week range to within 1.67% of the top in one month, it now sits almost exactly on the average analyst price target, and the 10-year Treasury yield near 5% remains the dominant backdrop for every rate-sensitive real estate stock.
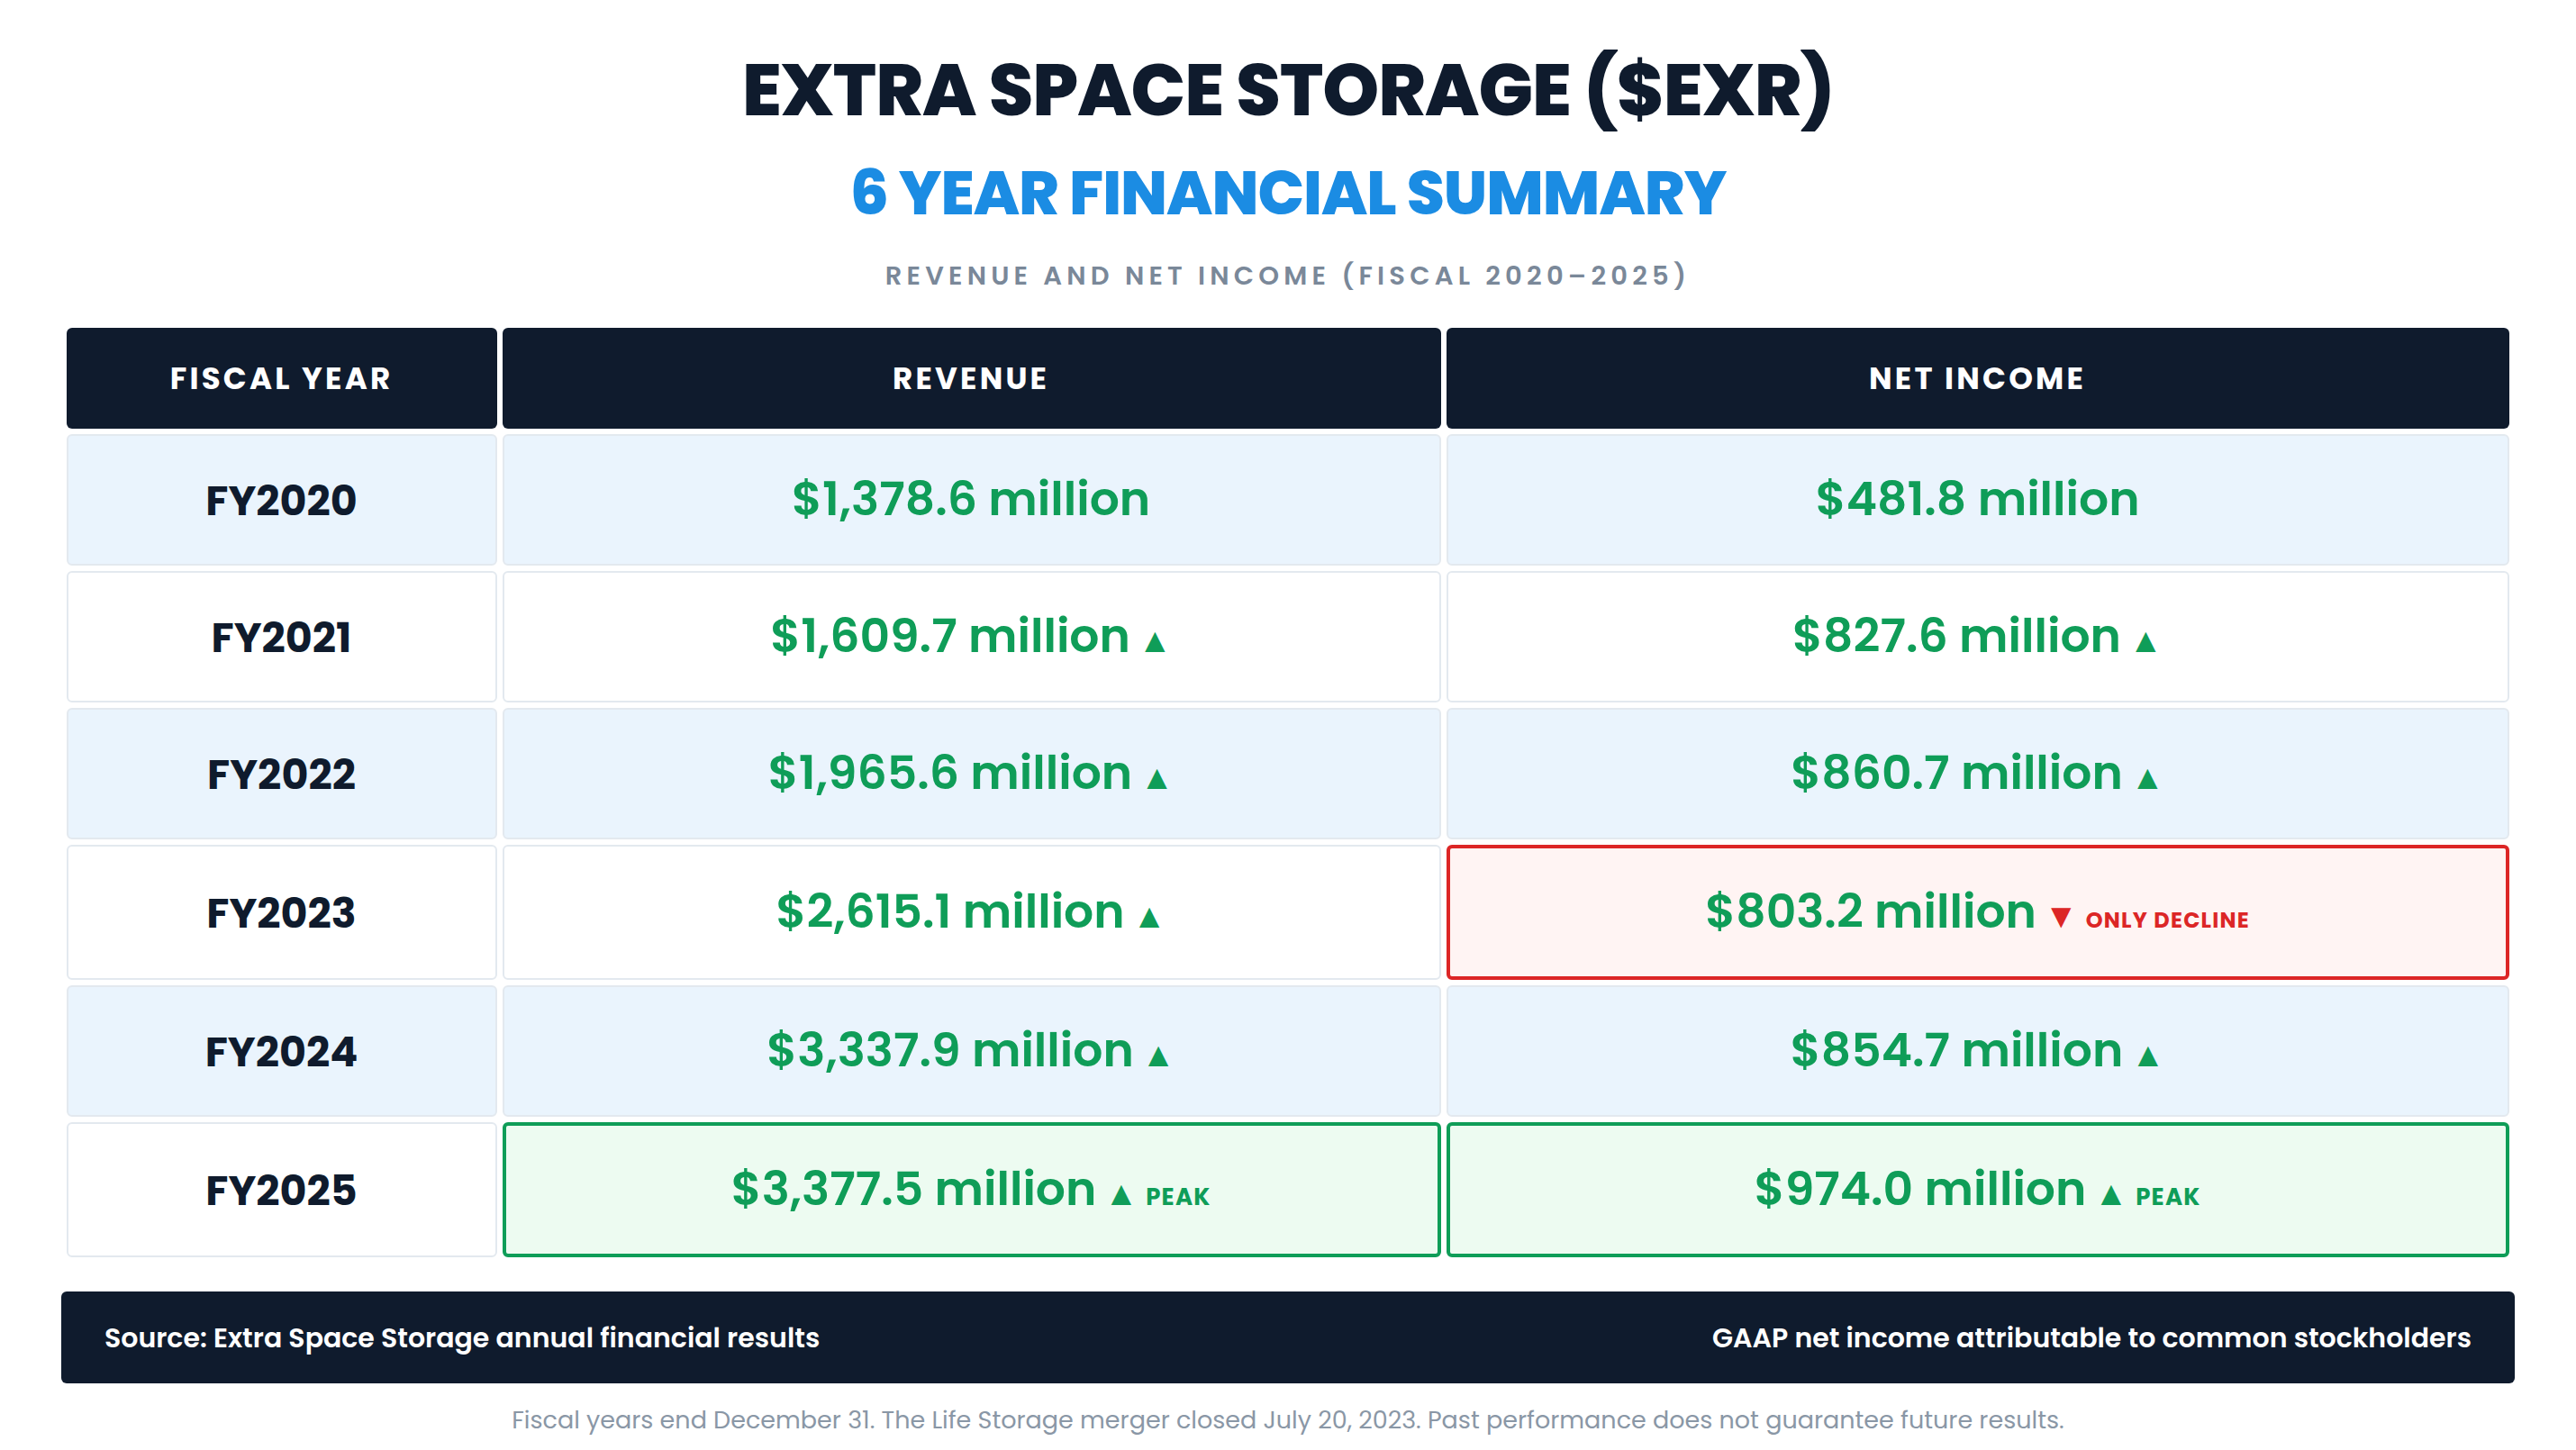
Extra Space uses a calendar fiscal year. Revenue grew every year in the table, from $1,378.6 million in fiscal 2020 to $1,609.7 million in fiscal 2021, $1,965.6 million in fiscal 2022, $2,615.1 million in fiscal 2023, $3,337.9 million in fiscal 2024, and $3,377.5 million in fiscal 2025. Across the six years, revenue rose 145.00%. The pattern is two steps. Growth of 16.77% and 22.11% in fiscal 2021 and 2022 came from a strong storage market, and growth of 33.04% and 27.64% in fiscal 2023 and 2024 came mostly from the Life Storage merger. Growth then slowed to 1.19% in fiscal 2025, once the merger had a full year in both comparisons. Net income rose from $481.8 million in fiscal 2020 to $827.6 million in fiscal 2021 and $860.7 million in fiscal 2022, dipped to $803.2 million in fiscal 2023, the only decline in the table, and then rose to $854.7 million in fiscal 2024 and a six-year high of $974.0 million in fiscal 2025.
Here is the number the annual table hides. Net income in fiscal 2025 was 13.17% higher than in fiscal 2022, but diluted earnings per share fell from $6.41 to $4.59, a decline of 28.39%. The reason is the merger. The diluted share count rose from about 141.7 million in fiscal 2022 to about 211.9 million in fiscal 2025, an increase of 49.52%, and total debt rose from $7.56 billion to $14.97 billion. Interest expense rose from $219.2 million to $635.1 million over the same three years, an increase of 189.79%, and it consumed 18.80% of fiscal 2025 revenue. The distinction matters. The company got much bigger, but each share did not get proportionally richer, and the cost of carrying the larger balance sheet rose much faster than the profit it supports.
The cash flow line is steadier than the per-share line. Operating cash flow rose from $771.2 million in fiscal 2020 to $1,887.4 million in fiscal 2024 and $1,850.2 million in fiscal 2025. Regular dividends paid to common stockholders were $1,374.3 million in fiscal 2025, about 74.28% of operating cash flow. Extra Space pays a regular quarterly dividend of $1.62 per share, $6.48 on an annual basis, which is a yield of about 4.15% at the November 3 close. It has paid $1.62 in every quarter of 2025 and 2026, most recently on September 30, 2026, to stockholders of record on September 15. None of those payments was a special dividend, and the company has not declared a special dividend in that period. The company also repurchases stock. It repurchased $149.5 million in fiscal 2025, then 2,390,497 shares for $327.1 million in the third quarter of 2026 at an average of $136.85, and another 164,724 shares for $21.8 million after the quarter ended, at an average of $132.45. That used up its prior $500 million program, and the board authorized a new $500 million program on October 15, 2026. At the November 3 close, the company’s market value was about $33.0 billion.
The third quarter of 2026, reported after the close on October 27, was the strongest operating report the company has delivered in some time. Revenue was $889.8 million, up 3.6% from a year earlier and ahead of the $880.3 million Zacks consensus. Core funds from operations, the per-share cash earnings measure REIT investors watch most closely, were $2.17 per share, up 4.3% and above the $2.10 estimate. GAAP net income was $1.17 per diluted share, up 50.0%, partly because the prior-year quarter included a loss on assets sold. Same-store revenue rose 2.7%, the fifth straight quarter of sequential improvement, while same-store expenses fell 1.8%, which lifted same-store net operating income 4.6% to $504.7 million. Same-store occupancy ended the quarter at 94.0%, up from 93.7%. Management said 27 of its top 30 markets posted positive revenue growth, compared with 12 a year earlier.
The company raised its full-year guidance for the second time this year. Core funds from operations guidance moved to $8.40 to $8.50 per share from $8.25 to $8.40. Same-store revenue guidance moved to 2.0% to 2.5% growth from 1.0% to 2.0%, same-store expense guidance moved to 0% to 0.5% from 1% to 2%, and same-store net operating income guidance moved to 2.5% to 3.5% from 0.5% to 2.5%. Acquisition guidance rose to $400 million from $300 million. “Our platform, portfolio and people continue to outperform, with Core FFO per share growth of 4.3% and accelerating same-store performance,” Margolis said. “Extra Space is entering its leadership transition from a position of strength, and I am confident in the opportunities ahead.”
What the quarter proves is that same-store results are accelerating while expenses are falling. What it does not prove is that the stock can outrun interest rates. At September 30, 79.6% of the company’s debt carried a fixed rate, with a weighted average rate of 4.4% and a weighted average maturity of about 4.0 years. That fixed-rate share protects the near-term numbers. It also means about a fifth of the debt reprices with the market, and every new note the company issues in a 5% Treasury market costs more than the debt it replaces. In July 2026, the company issued $550 million of 4.90% notes due 2032.
Traders are really asking two questions now. First, is the improvement in same-store revenue the start of a real recovery in storage demand and pricing, strong enough to keep raising guidance through 2027, or is it a cyclical bounce aided by cost control? Second, after a 17.25% run in one month that has carried the price to the average analyst target and near the 52-week high, how much of that recovery is already in the price?
The bullish evidence is concrete. Same-store revenue growth has improved for five straight quarters, same-store expenses are falling, and occupancy is higher than a year ago. Full-year guidance has been raised twice. Core funds from operations have beaten the consensus estimate in each of the last five quarters, including this one. Management repurchased $327.1 million of stock in the third quarter near $136.85, well below the current price, and the board immediately authorized another $500 million. BofA said after the third-quarter reports that CubeSmart, Extra Space and Public Storage all beat expectations, pointing to moderating new supply and lower customer churn. The stock is up 19.08% over the past year and has outperformed every major index over one week, one month, three months, one year and year to date.
That is also where the market could be wrong. The main risk case has four parts. The first is rates. The 10-year Treasury yield has spent October near 5%, briefly touching its highest level since 2002 on October 7, and EXR’s daily moves this month have tracked the bond market almost as closely as its own results. The second is housing. Moves drive storage demand, and weak home sales and mortgage rates near 7.4% have limited household moves. The third is valuation. At $156.23, the stock trades at about 18.49 times the midpoint of its 2026 core funds from operations guidance, and it already sits above the median analyst target. The fourth is history. The last time the stock ran to this level, on July 29, 2026, it touched $158.88 intraday and then fell 17.84% to an intraday low of $130.54 on October 8. The biggest risk is that the story is wearing a convincing disguise: a sector-wide earnings rally on a falling-yield week can look like a durable recovery, when the stock’s direction may still depend on a bond market that has not settled.
The catalyst calendar has three clear dates. Joe Margolis retires on December 31, 2026, and Noah Springer becomes chief executive on January 1, 2027. Extra Space reports fourth-quarter results on February 16, 2027, after the market close, with consensus calling for core funds from operations of $2.08 per share on revenue of about $888.4 million. The board declared the fourth-quarter 2025 dividend on November 20, 2025, so the next quarterly dividend declaration is also close. Between those dates, traders should watch the 10-year Treasury yield, the pace of repurchases under the new $500 million program, and any follow-through in the sector merger speculation that began on October 13, when activist investor Ancora named Extra Space and Public Storage among potential bidders for UK operator Big Yellow.
This setup suits swing traders and position traders who want exposure to a large, liquid, dividend-paying REIT with improving fundamentals, and who can manage a stock that responds to the bond market as much as to its own news. Over the past 20 sessions, the average daily range was $2.84, or 2.01% of the prior close. Earnings reactions have been mixed: the stock fell 10.03% the session after its second-quarter 2025 report and 4.91% after its third-quarter 2025 report, then rose 4.56% after its fourth-quarter 2025 report. It is a poor fit for anyone looking for a fast-moving growth story or for a stock insulated from interest rates.
The early-warning signal to watch is the October 28 high of $151.12. The session after the earnings report ran to that level intraday and then closed at its low of $144.75, a sharp rejection on about 2.5 million shares. The stock did not close above $151.12 until October 30, when it finished at $151.32, and it has held above it since. A close back below that level would say the post-earnings breakout has failed. A close below the October 27 close of $144.55 would erase the entire earnings move, and a close below the October 14 close of $134.08 would return the stock to the range it held for the first half of October. On the upside, the 52-week high of $158.88 is the level to watch. That level is $2.65 away.
So the picture heading into this week is a large, dividend-paying storage REIT with accelerating same-store results, twice-raised guidance, an active repurchase program, a planned leadership transition, and a share price that has gone from the bottom of its range to the top in a month. The trend says stay interested. The volatility says stay alert. With that in mind, here is what the professional analyst community currently expects.
Wall Street Analysts Annual Forecasts
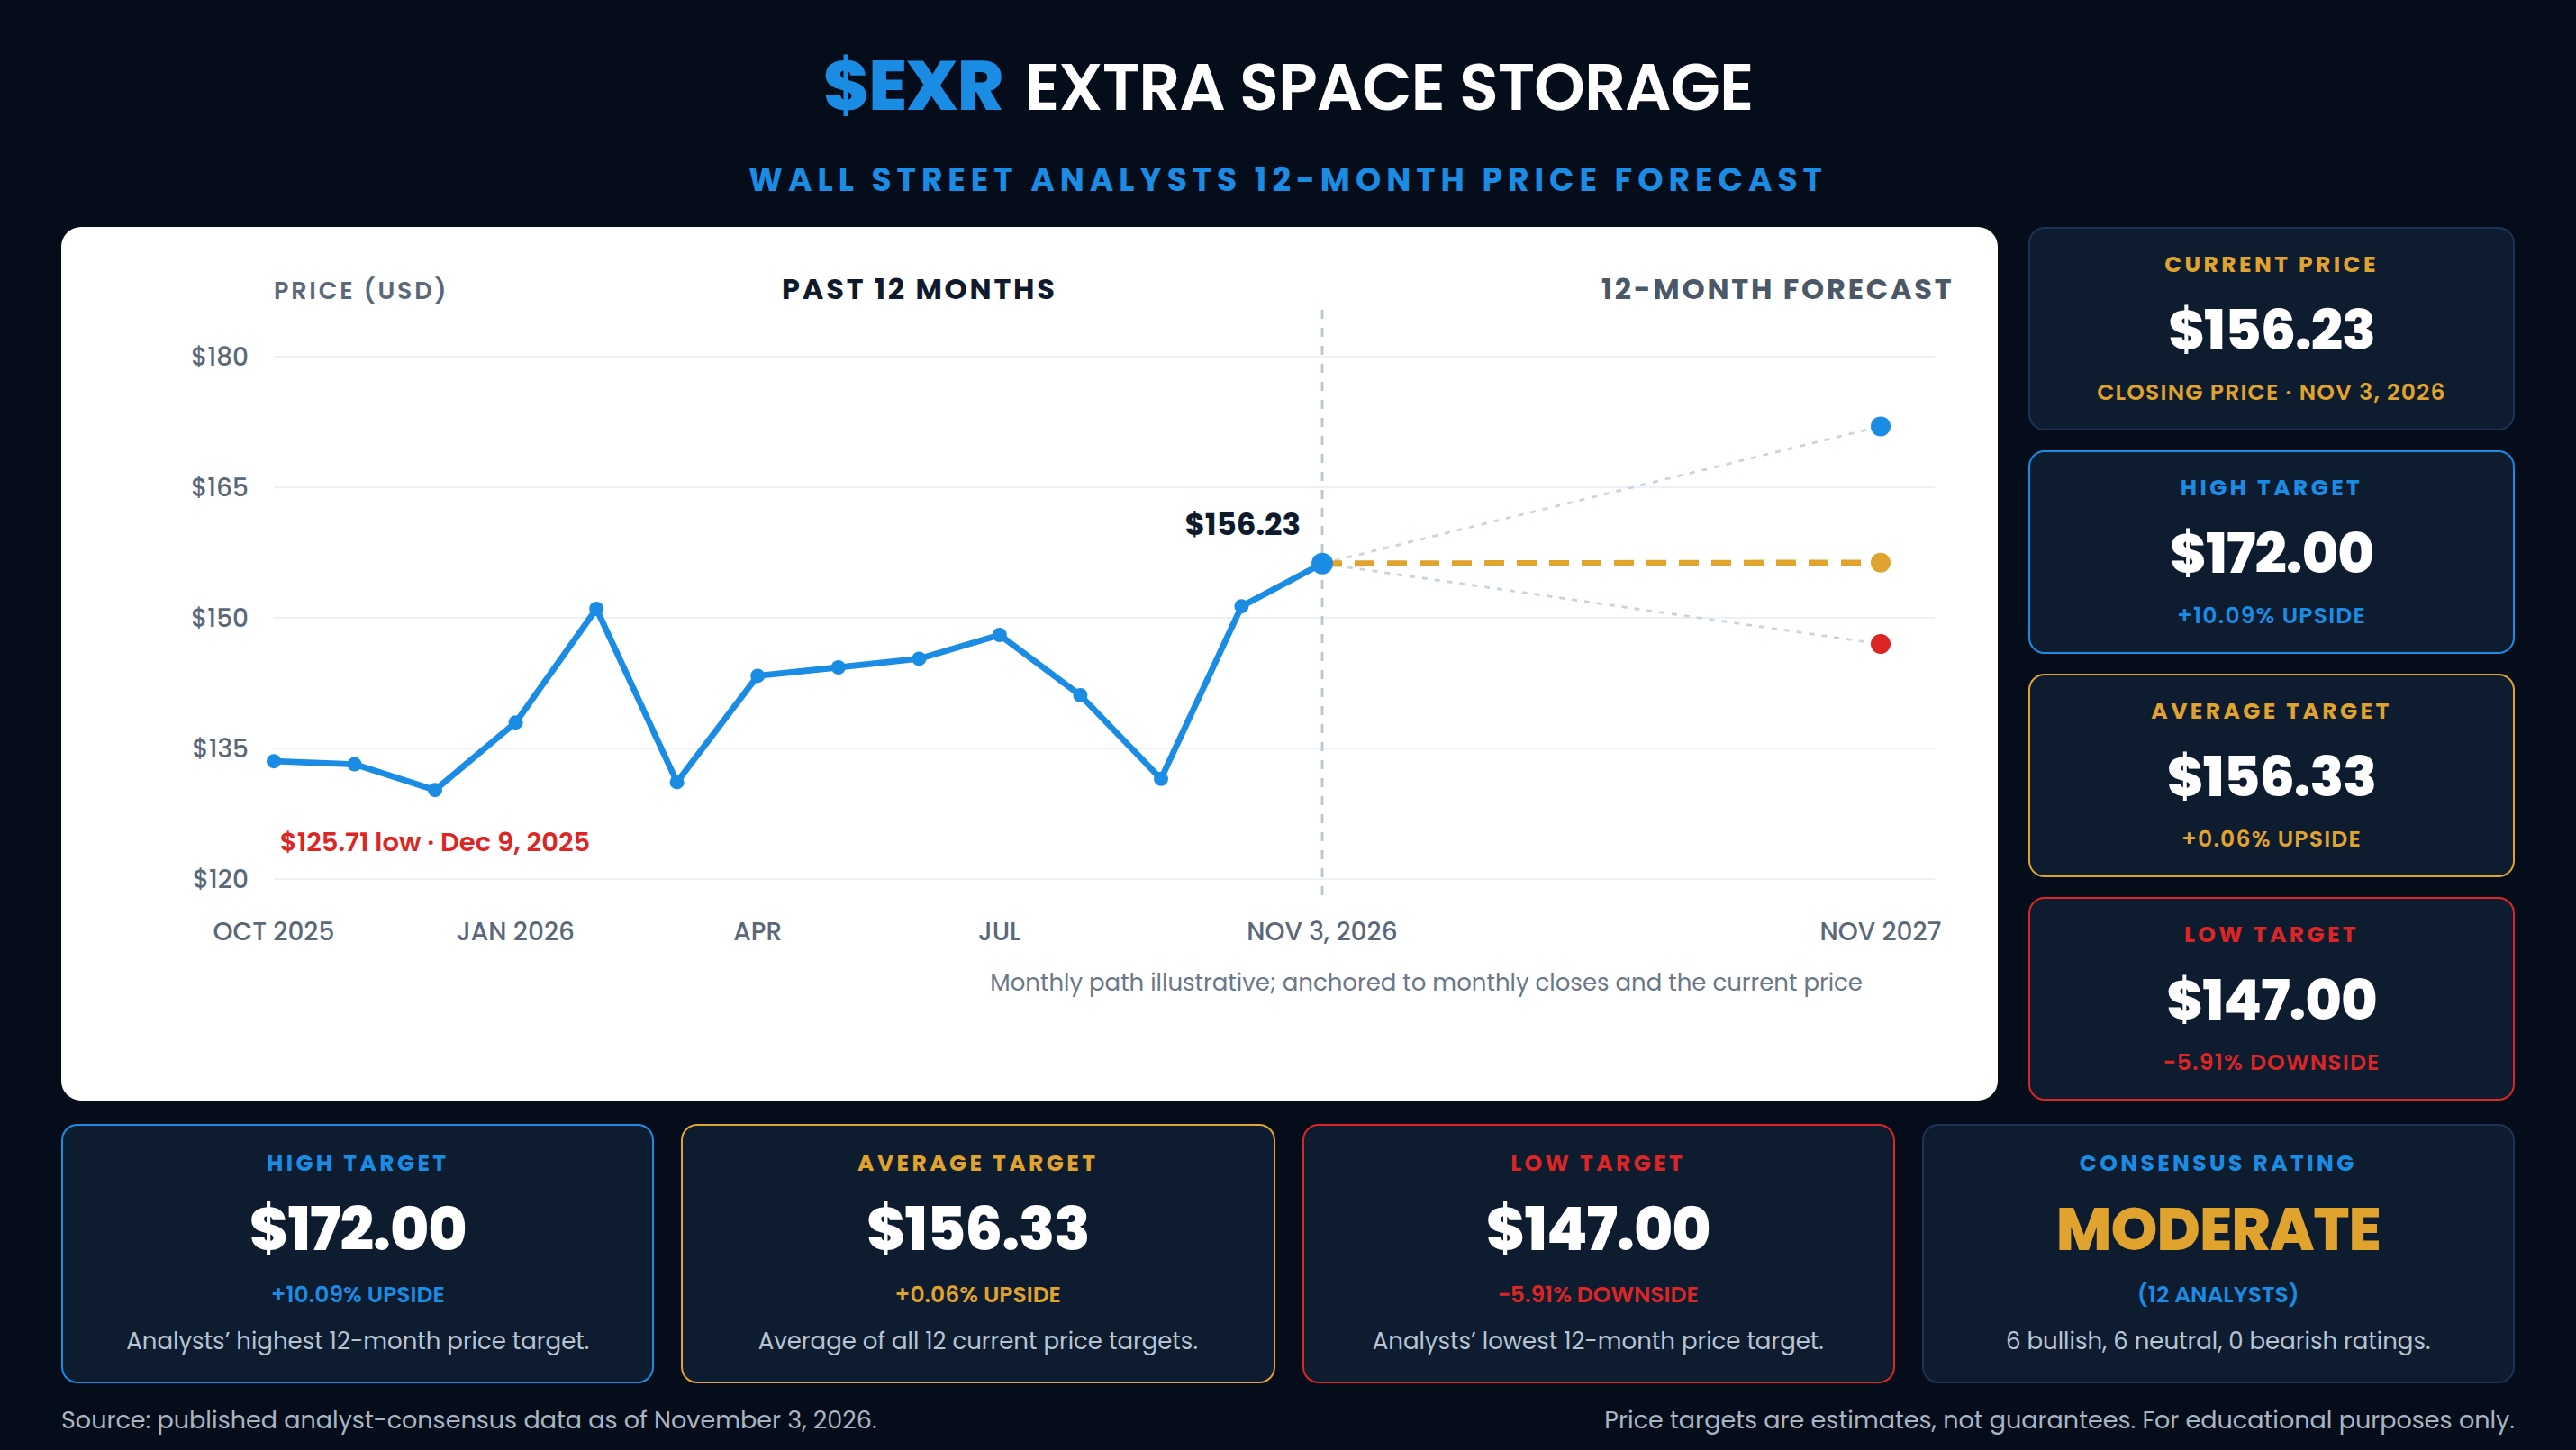
Measured against the November 3, 2026 close of $156.23, the average target implies a 0.06% gain. The median target implies a 1.11% decline. The high target implies a 10.09% gain. The low target implies a 5.91% decline. The spread between the high and low target is $25.00, which is 15.99% of the average target and 16.00% of the current share price.
The consensus is notable for how tightly it is grouped and how closely the market has caught up with it. The high target is Barclays’ $172, with an Overweight rating, set on July 10, followed by BMO’s $170, set when it upgraded the stock to Outperform on August 27. Scotiabank holds a Sector Perform rating at $158, Wells Fargo an Overweight at $157, RBC Capital a Sector Perform at $156, trimmed from $157 on October 29, and BofA a Neutral at $156. JPMorgan holds a Neutral at $153. UBS kept its bullish rating on October 16 but cut its target to $152 from $163, and Mizuho holds an Outperform at $152. Morgan Stanley’s Equal-Weight rating at $152 dates to December 5, 2025. The two actions closest to the data date point in different directions. Evercore ISI kept its In-Line rating on November 2 but raised its target to $151 from $142, after the third-quarter report. Truist upgraded the stock to a bullish rating on October 2 with a $147 target, the low target, when the stock closed at $133.25.
The practical takeaway is that the stock has already reached the average target, and only two of the twelve targets, Barclays’ $172 and BMO’s $170, sit more than 2% above the current price. Ten of the twelve targets were set before the third-quarter report and the guidance raise, most of them when the stock traded in the $130s and low $140s. Either the targets move higher to reflect the stronger outlook, or the price has run ahead of what the analysts are modeling. Price targets are estimates of what a security might be worth over a twelve-month horizon under a specific set of assumptions. They are not certainties.
52-Week High and Low Boundaries Analysis
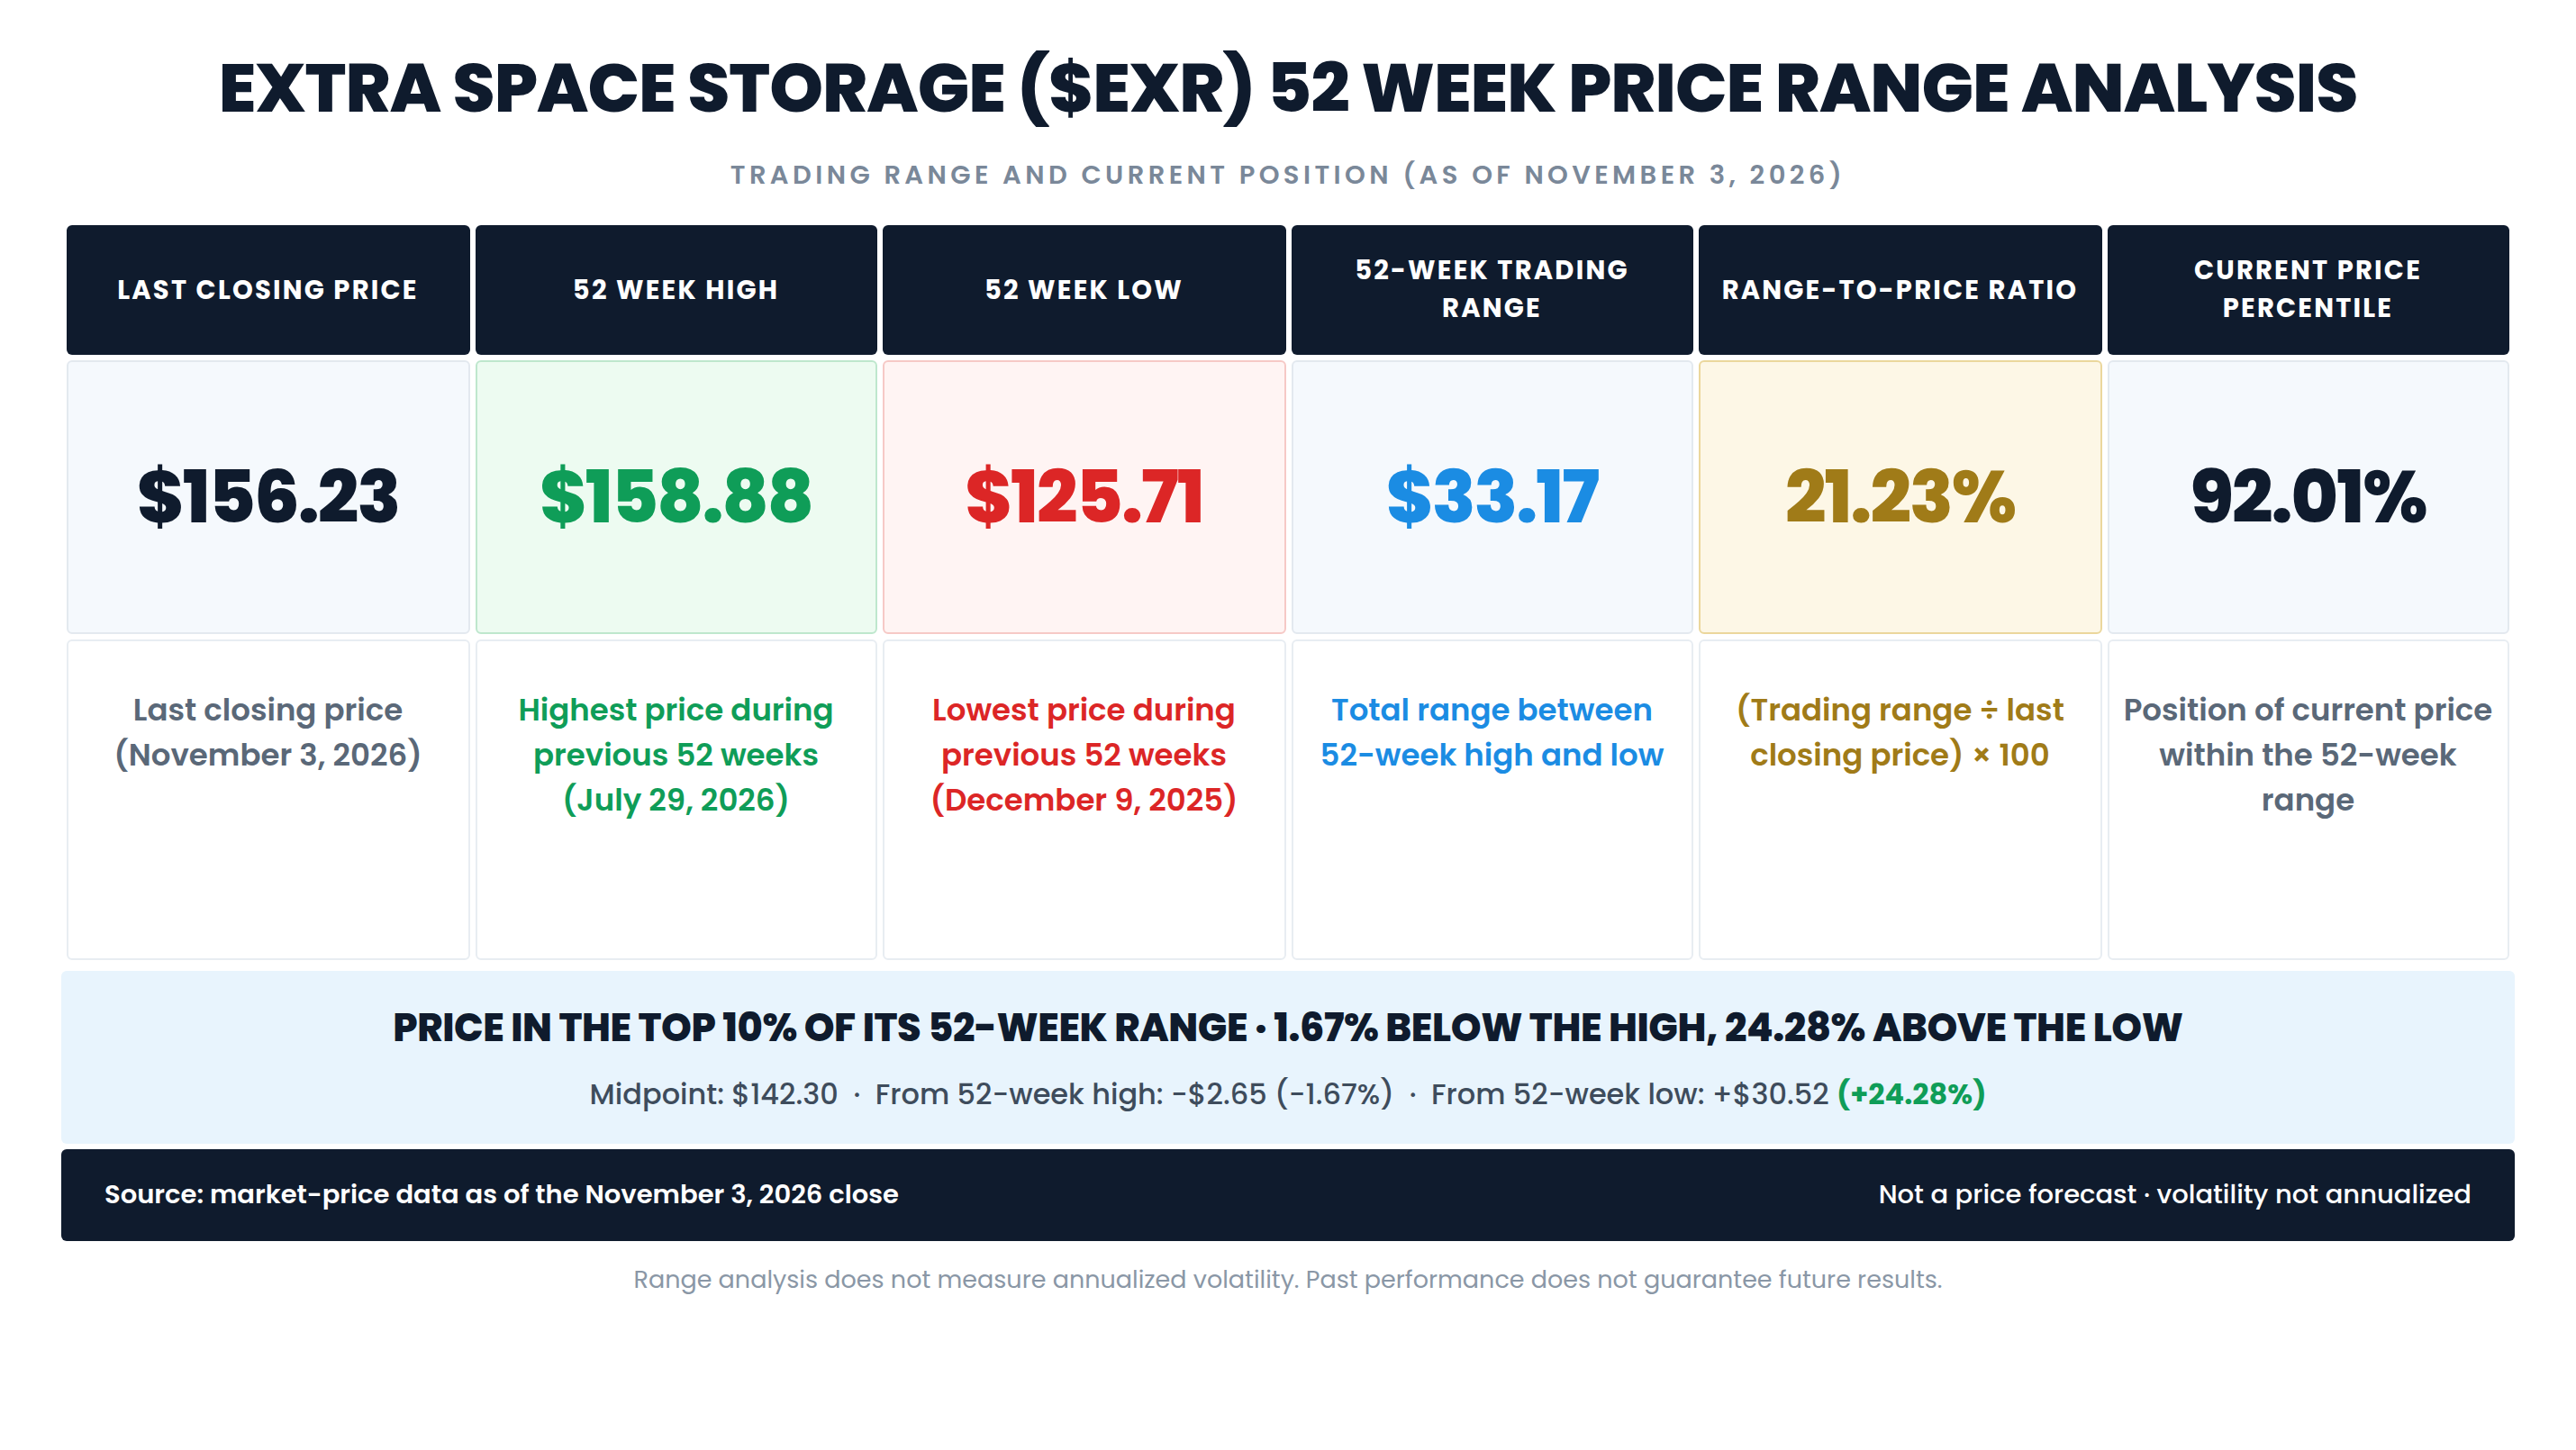
EXR’s 52-week high is $158.88, set on July 29, 2026, and its 52-week low is $125.71, set on December 9, 2025.
The 52-week trading range is $33.17. Divided by the $156.23 closing price, that produces a range-to-price ratio of 21.23%, meaning the distance between the year’s high and low is about a fifth of today’s share price. The stock sits at the 92.01st percentile of its range. The midpoint of the range is $142.30, and the November 3 close is 9.79% above that midpoint, a gap of $13.94. The stock needs a 1.70% gain, or $2.65, to reach the 52-week high, and it is 24.28% above the 52-week low.
That combination describes a stock pressing against its ceiling. The 52-week high was not a closing level. It was an intraday spike on July 29, the session after the second-quarter report, and the stock closed that day at $152.85. The November 2 and November 3 closes of $155.98 and $156.23 are already the two highest closes in the window. A stock in the top tenth of its range with a narrow range-to-price ratio is not a deep-value setup. It is a test of whether the July high was a ceiling or a preview.
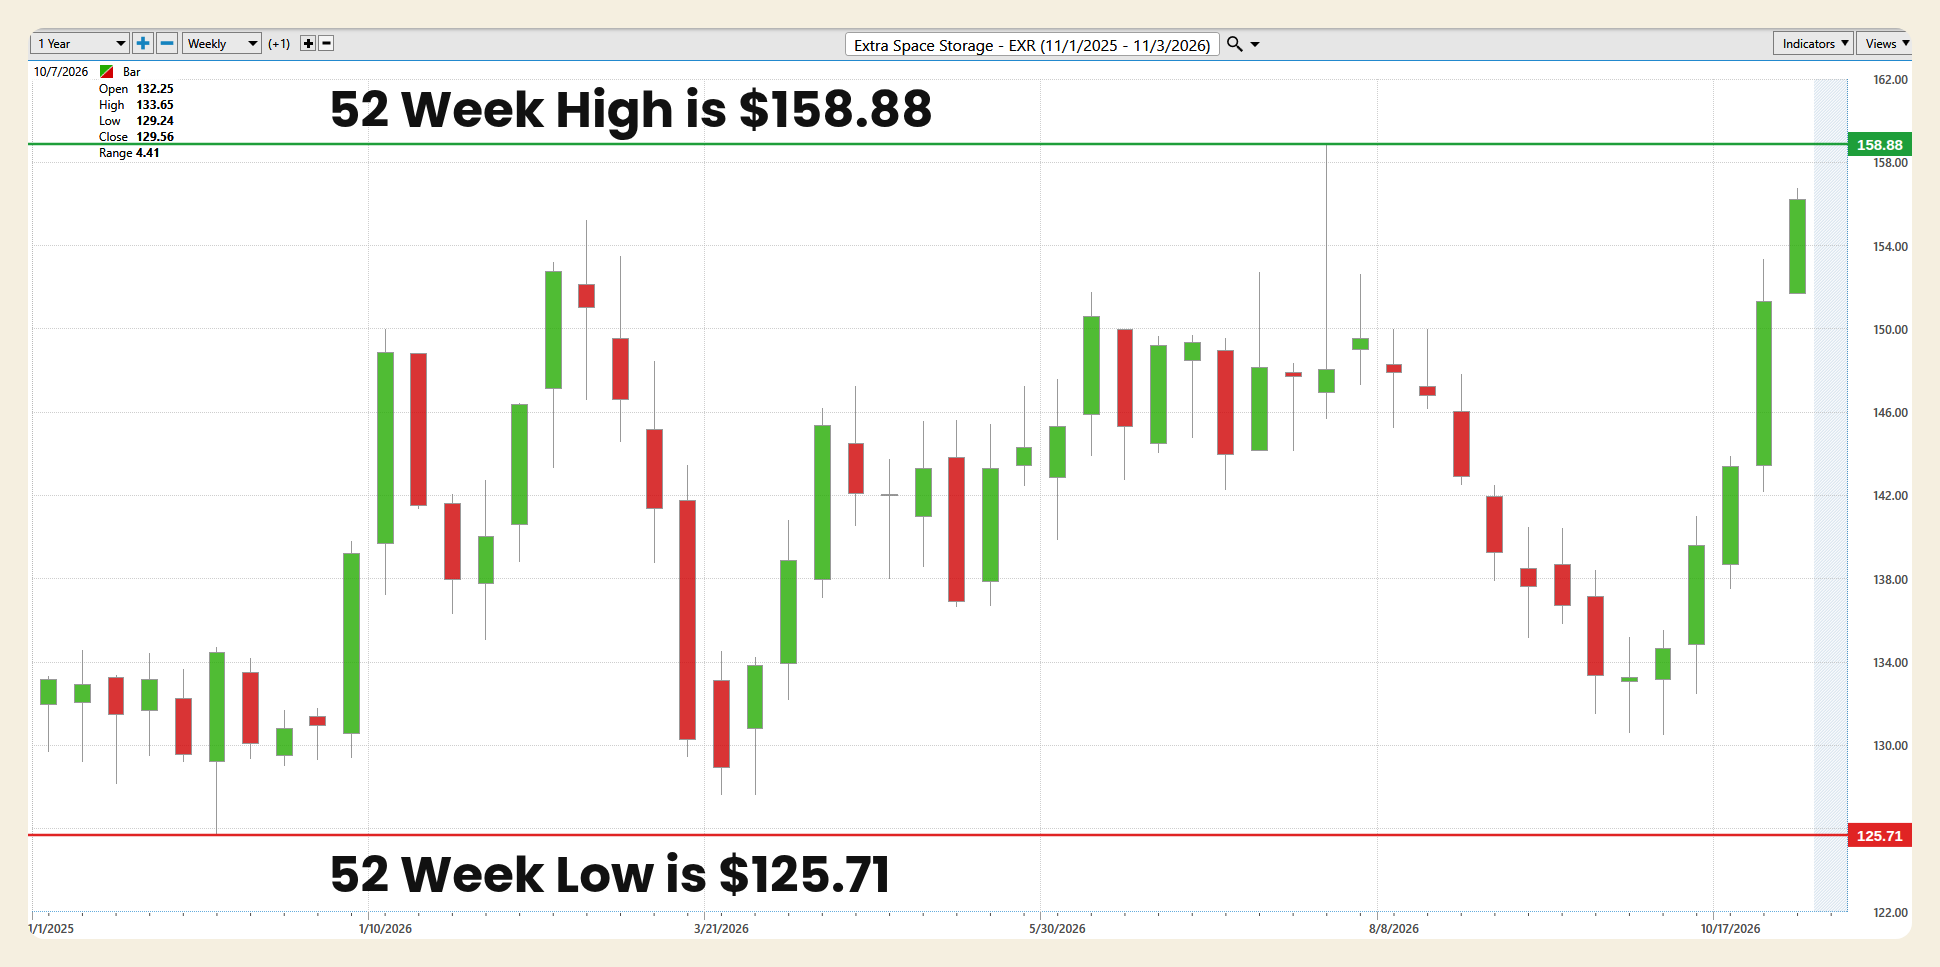
The one-year weekly chart is a wide range with a sharp exit at the top. The left side shows the stock trading in the low $130s through November and early December 2025, with the long lower wick in the week of December 9 marking the $125.71 low. A strong green candle in early January 2026 lifted the stock toward $150, and February carried it to $155.19 intraday after the fourth-quarter report. March delivered the largest red candles on the chart, two weeks that took the stock back to about $127.65 intraday on March 25. April through July rebuilt the range in the $140s, ending with the long upper wick of the July 29 high. August and September gave all of that back, with the stock sliding into the low $130s by early October. The final four weekly candles are green and stacked, rising from about $135 to the current week’s high of $156.74. The chart levels described here are approximately read from the weekly candles, and the final candle covers only November 2 and November 3.
Best-Case/Worst-Case Analysis
The best-case historical moves are meaningful for a large REIT. From the March 23, 2020 low of $72.70, EXR rose 214.77% to its December 31, 2021 all-time high of $228.84. Inside the current 52-week window, the stock gained 26.39% from the December 9, 2025 low of $125.71 to the July 29, 2026 high of $158.88, and it has gained 19.68% from the October 8, 2026 intraday low of $130.54 to the November 3 close. The largest single-session gains in the past year were 4.56% on February 20, 2026, after the fourth-quarter report, 3.93% on July 16, 2026, 3.60% on April 8, 2026, and 3.56% on October 29, 2026.
The worst-case historical moves are just as instructive. From the December 31, 2021 high of $228.84, the stock fell 55.78% to its November 1, 2023 low of $101.19, and the November 3 close is still 31.73% below that all-time high. Inside the 52-week window, the stock fell 17.84% from the July 29 high to the October 8 intraday low. The largest single-session declines in the past year were 4.21% on March 20, 2026, 3.72% on May 15, 2026, 3.52% on March 11, 2026, and 3.04% on July 30, 2026, the session after the stock touched its 52-week high. Before the current window, the stock fell 10.03% in the session after its second-quarter 2025 report.
Historical gains are not forecasts, and historical losses are not predictions. What these figures show is that this stock has real capacity for movement in both directions, even as a large, dividend-paying REIT, and that it has already given back nearly 18% from the same price zone it is testing now. Position sizing and an exit plan matter, particularly with the price within 1.70% of the level where the last advance reversed.
The condition that keeps the bull case alive is continued improvement in same-store revenue, guidance that holds or rises again in February, and a stable or falling 10-year Treasury yield, while the stock holds above the October 28 high of $151.12 and, at a minimum, the October 27 close of $144.55. The change of character that would invalidate the thesis is a close back below the October 14 close of $134.08, the last close before the current advance began. That would say the market has rejected the third-quarter recovery and returned the stock to the bottom of its range. A nearer warning, short of that break, is a close below $144.55, which would erase the entire earnings move.
The upside opportunity is substantial but contingent.
Relative Strength Comparison
EXR has outperformed every major U.S. benchmark over every period in the table. All figures are price returns.
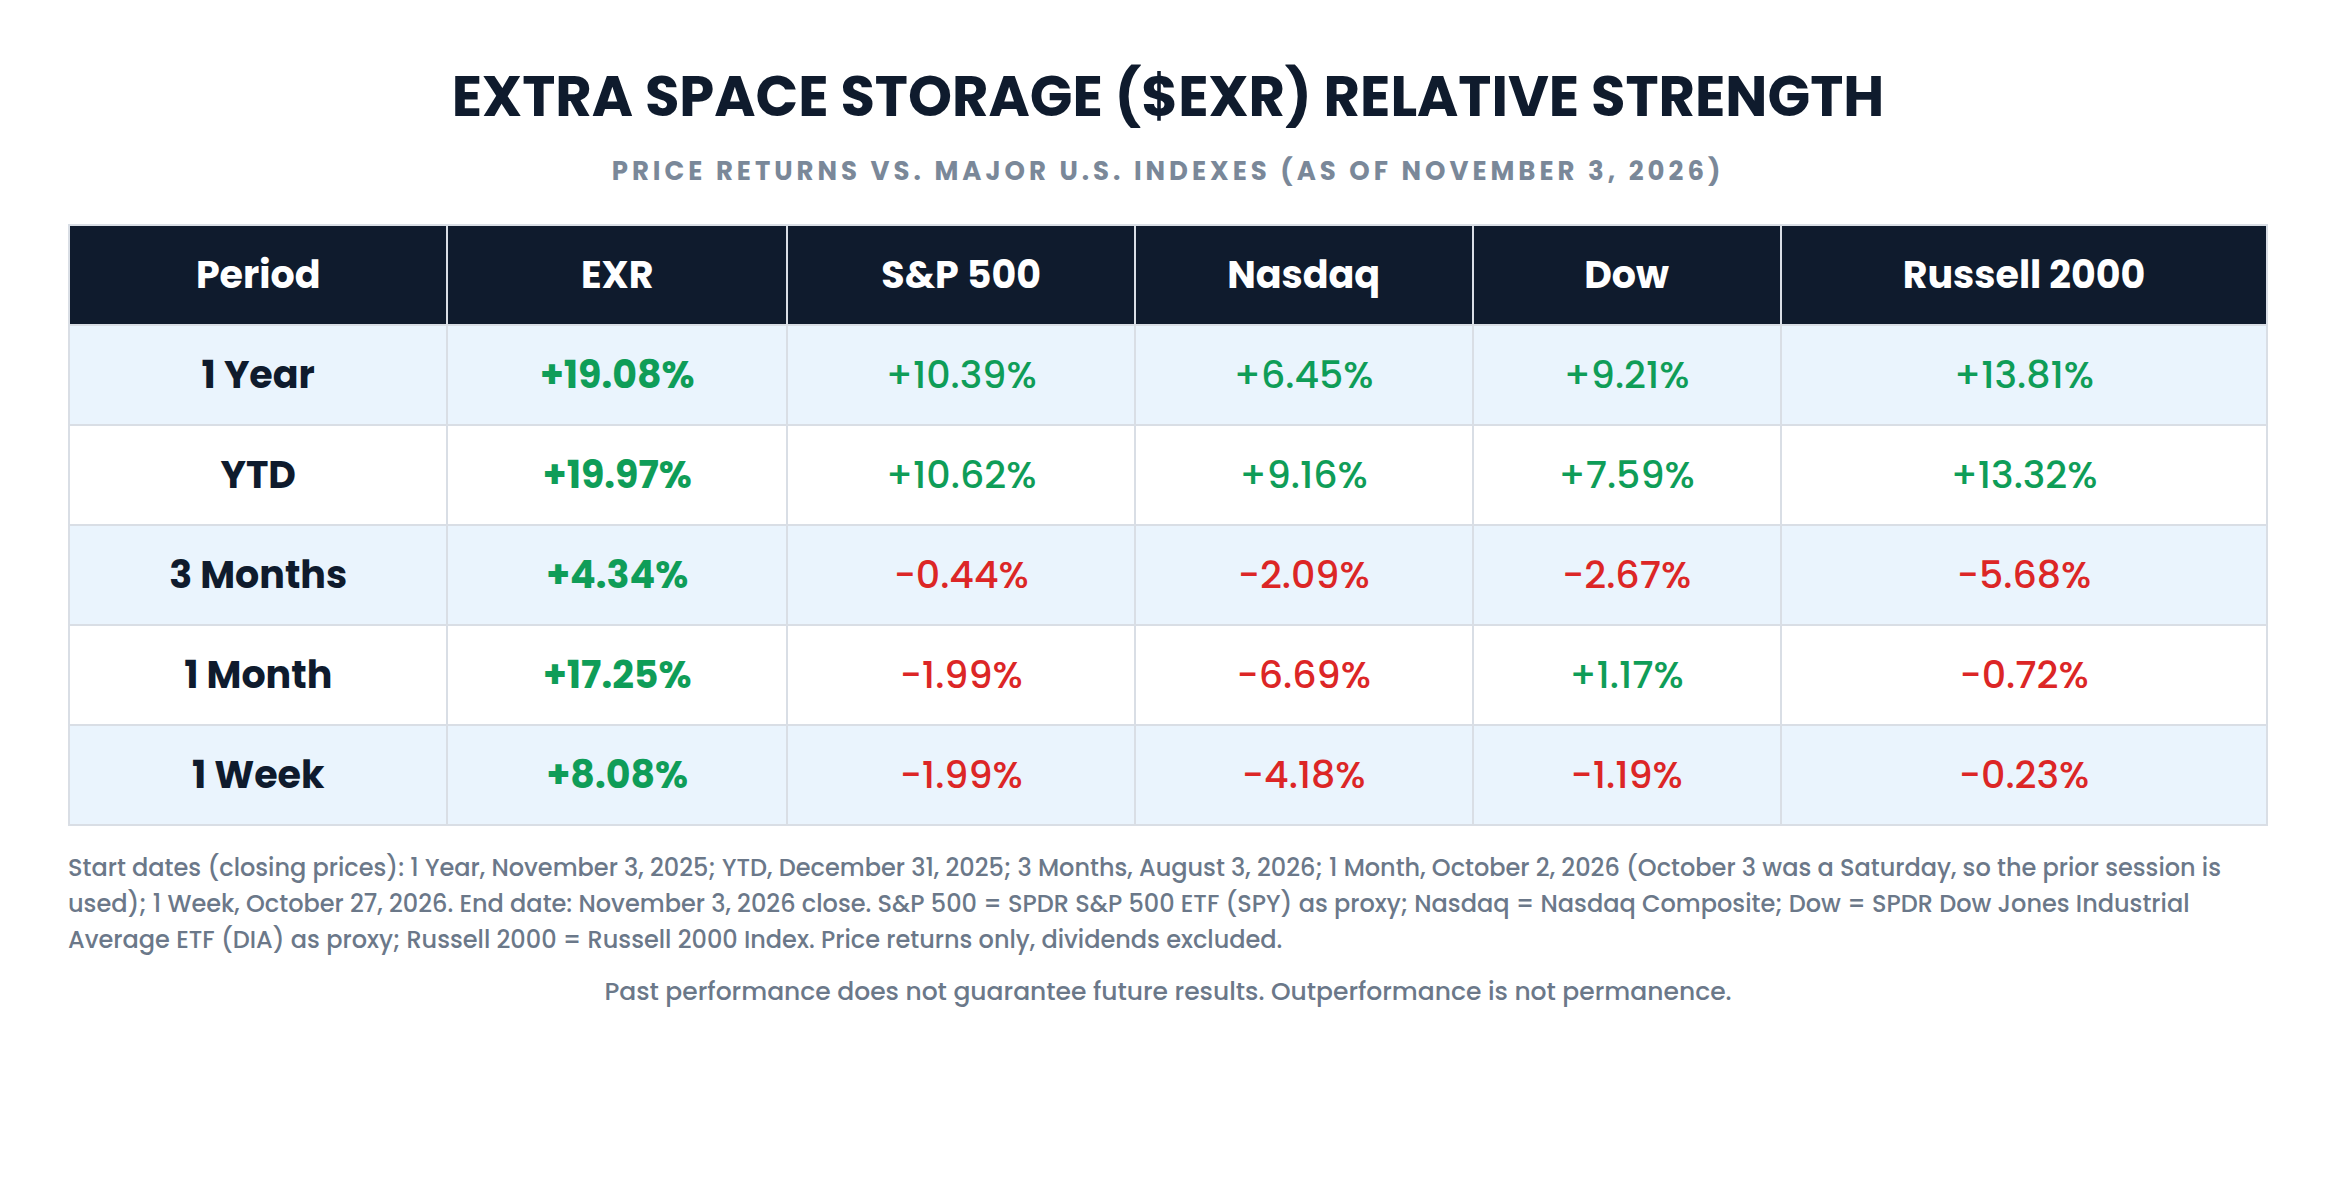
Returns are measured to the November 3, 2026 close from these starting closes: 1 Year, November 3, 2025; YTD, December 31, 2025; 3 Months, August 3, 2026; 1 Month, October 2, 2026; 1 Week, October 27, 2026. October 3, 2026 fell on a Saturday, so the one-month window uses the prior session. S&P 500 refers to the SPDR S&P 500 ETF Trust (SPY), used as a proxy for the index. Nasdaq refers to the Nasdaq Composite. Dow refers to the SPDR Dow Jones Industrial Average ETF Trust (DIA), used as a proxy for the index. Russell 2000 refers to the Russell 2000 Index. All returns exclude dividends.
This is leadership that has arrived late and fast. The one-year window starts at the November 3, 2025 close of $131.20. EXR is up 19.08% over that year while the S&P 500 is up 10.39%, a lead of 8.69 percentage points, and the Russell 2000’s 13.81% is the closest any index comes. Year to date, from the December 31, 2025 close of $130.22, EXR is up 19.97% against 10.62% for the S&P 500. The three-month figure is smaller, because the window starts at the August 3 close of $149.73, near the summer high. EXR is up only 4.34% over that span, but every index is down. The shorter windows are where the strength is concentrated. Over one month, EXR is up 17.25% while the Nasdaq fell 6.69%, a gap of 23.94 percentage points. Over one week, it is up 8.08% while every index declined.
It is worth being precise about what this kind of relative strength means. A large part of the one-month lead came on days when technology stocks fell and investors moved money into defensive, rate-sensitive sectors. On October 22, for example, EXR rose 2.37% while the Nasdaq fell about 2.6% and Treasury yields dropped. That is a rotation into real estate as much as a vote for Extra Space alone. Rotations can become trends, especially when they are supported by improving results, as they were here after October 27. They can also reverse when yields rise or when money returns to technology. Outperformance is not permanence.
VantagePoint AI Predictive Blue Line
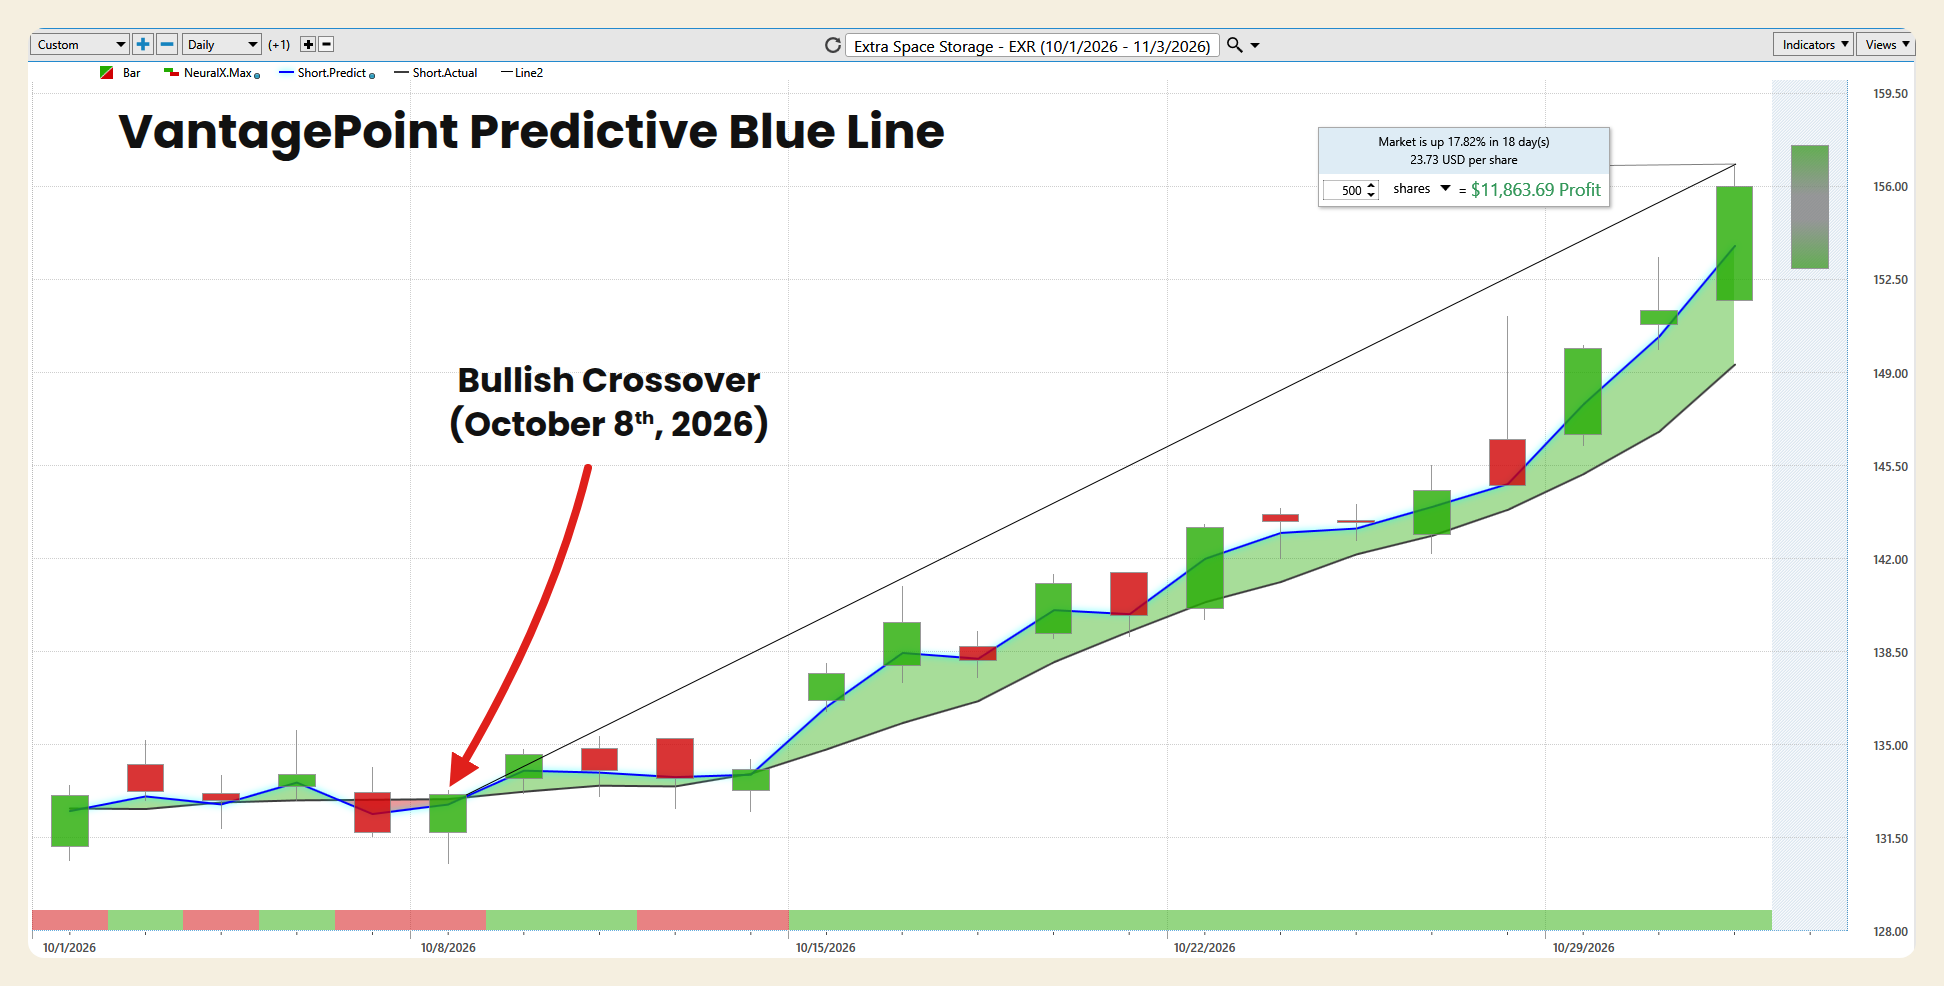
The VantagePoint AI Predictive Blue Line is a forecasted moving average that uses artificial intelligence to anticipate where the trend is heading, rather than simply reporting where it has been. The key reading is the relationship between the blue line and the black line, which represents the actual moving average of price. When the blue line is above the black line and rising, the forecast is pointing to strength ahead. When it crosses below, the forecast is warning of weakness.
The chart covers October 1 through November 2, 2026, with the November 3 forecast slot on the right edge. Through the first week of October, the Predictive Blue Line and the black actual moving average ran nearly flat and close together while the stock traded between about $131 and $134. On October 7, when the 10-year Treasury yield reached its highest level since 2002 and the stock fell 1.64% to $131.70, the blue line dipped below the black line and the narrow band between them was shaded red. The blue line crossed back above the black line on October 8, as the stock rose 1.08% to $133.12, and the shading turned green. That bullish crossover came within the same session as the intraday low of the entire move, $130.54, and nearly three weeks before the earnings report.
Since the crossover, the blue line has stayed above the black line through the entire window, including the flat stretch from October 12 through October 14 and the pullbacks on October 19 and October 21. The two lines ran nearly together through mid-October, then the blue line turned up steeply on October 15 and again from October 28 onward, while the black line rose more gradually. At the right edge of the chart, on November 2, the blue line sits at approximately $153.85 and the black line at approximately $149.30, a separation of about $4.55, the widest of the window. The November 3 close of $156.23 sits above both lines, about 1.55% above the blue line, which tells you price is running slightly ahead of the forecasted trend but has not detached from it. The platform’s on-chart measurement reads 17.82% over 18 days, or $23.73 per share, for the move it tracks. From the October 8 close, the day of the crossover, the stock is up 17.36% to the November 3 close.
The distinction matters. The Blue Line turned on the day of the low, long before the earnings report, and it held through every pullback since. The current reading is bullish, with a rising forecast and a widening separation. It is also a reading covering about four weeks rather than a long, established trend. The reading that would change the picture is a flattening of the blue line followed by a cross back below the black line, especially if that cross arrives near the 52-week high.
VantagePoint AI Neural Index
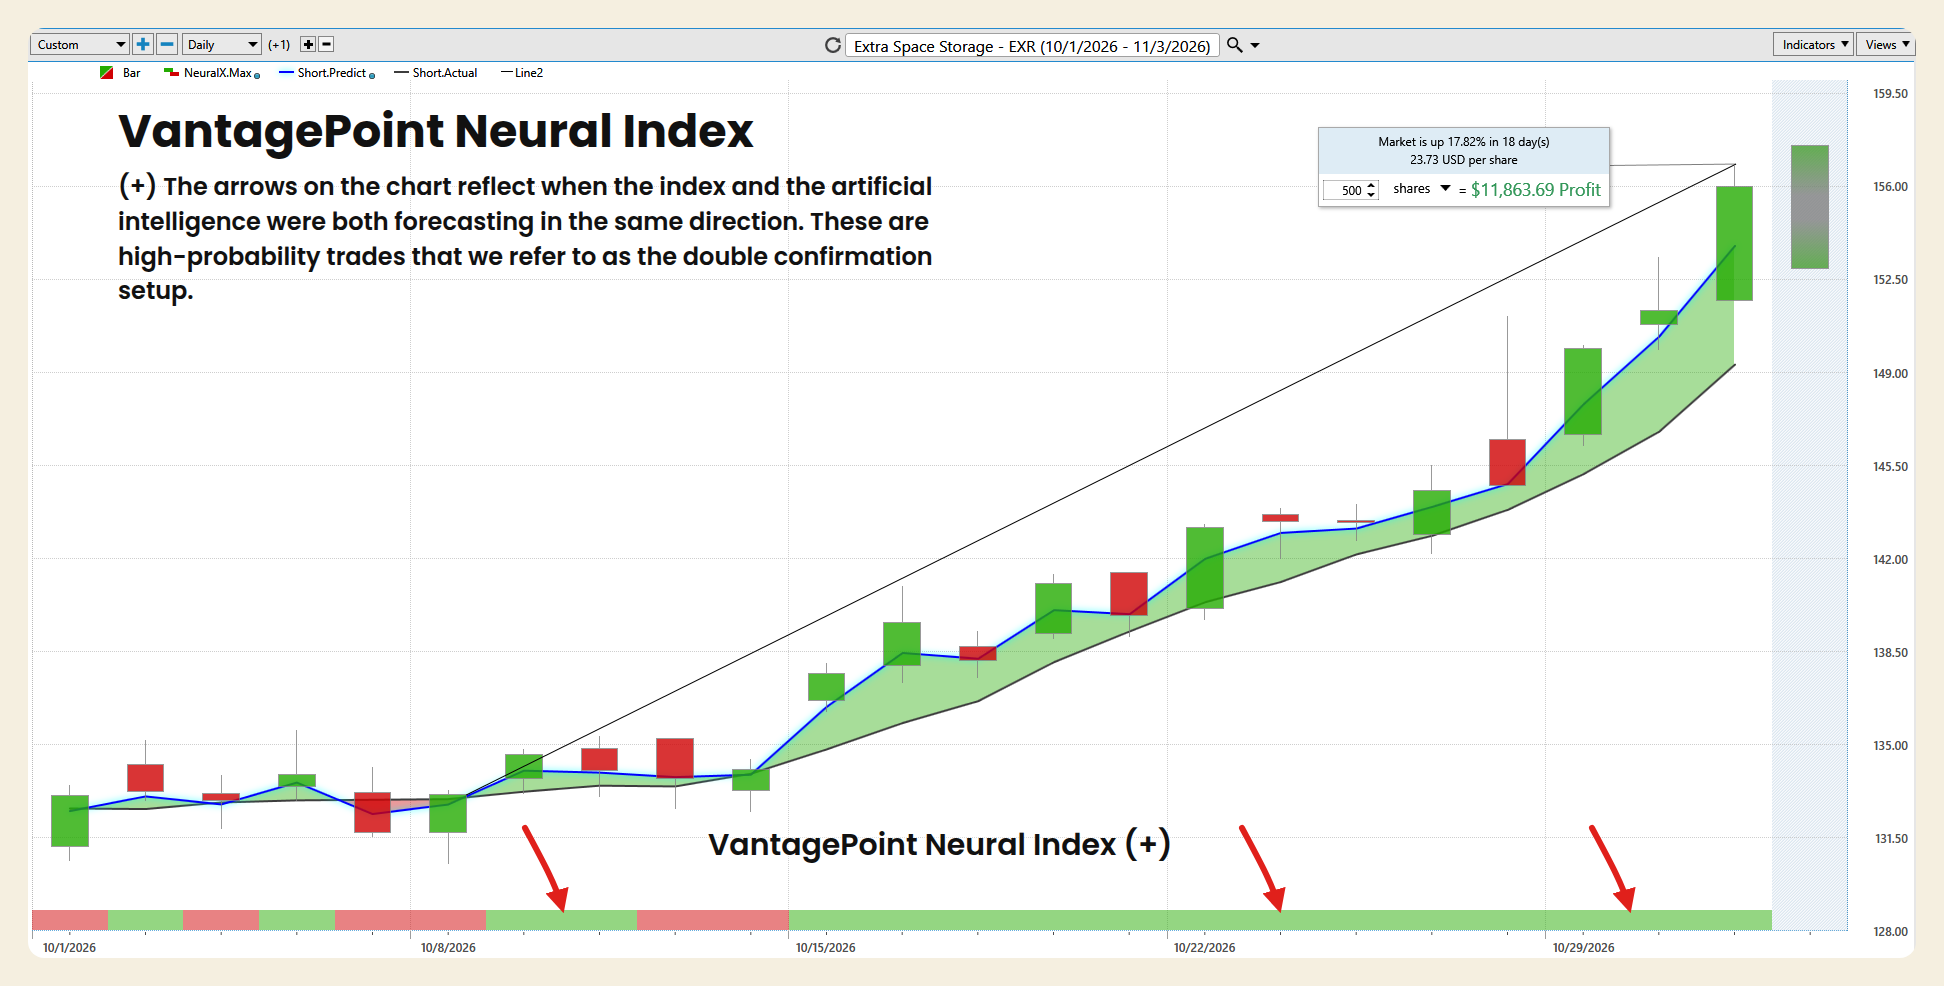
The VantagePoint AI Neural Index is a short-term strength indicator that forecasts whether the market is likely to be higher or lower over the next 48 hours. It appears as the colored strip along the bottom of the chart: green indicates predicted short-term strength and red indicates predicted short-term weakness.
The strip alternated in the first half of the window and then turned decisively green. It was red on October 1, green on October 2, red on October 5, and green on October 6. It was red on October 7 and October 8, the two sessions around the low. It turned green from October 9 through October 12, red on October 13 and October 14, and then green on October 15. It has stayed green from October 15 through November 2, 13 sessions in a row, covering the entire move from the October 14 close of $134.08 to the November 2 close of $155.98, a gain of 16.33%.
When the Neural Index and the Predictive Blue Line agree, VantagePoint refers to the setup as a double confirmation. The blue line crossed above the black line on October 8, so every green reading from October 9 onward came with the crossover in place. The double confirmation windows on this chart run from October 9 through October 12 and from October 15 through November 2, and the arrows mark the first window and two points inside the longer run. The red reading on October 13 and October 14 is a useful reminder of how the indicator behaves. It flagged short-term weakness while the Blue Line stayed bullish, and the stock held flat between $133.74 and $134.08 during those sessions without breaking the trend. The item to watch now is the next red reading. After a 13-session green run that has carried the stock to the edge of its 52-week high, a red print would be the earliest sign that short-term momentum is cooling, even if the Blue Line still points higher.
VantagePoint AI Daily Range Forecast
The VantagePoint AI Daily Range Forecast projects a predicted high and a predicted low for the next trading session. The red line marks the predicted high and the dark line marks the predicted low. Together they frame where price is expected to trade, giving traders a structure for entries, exits, and stop placement.
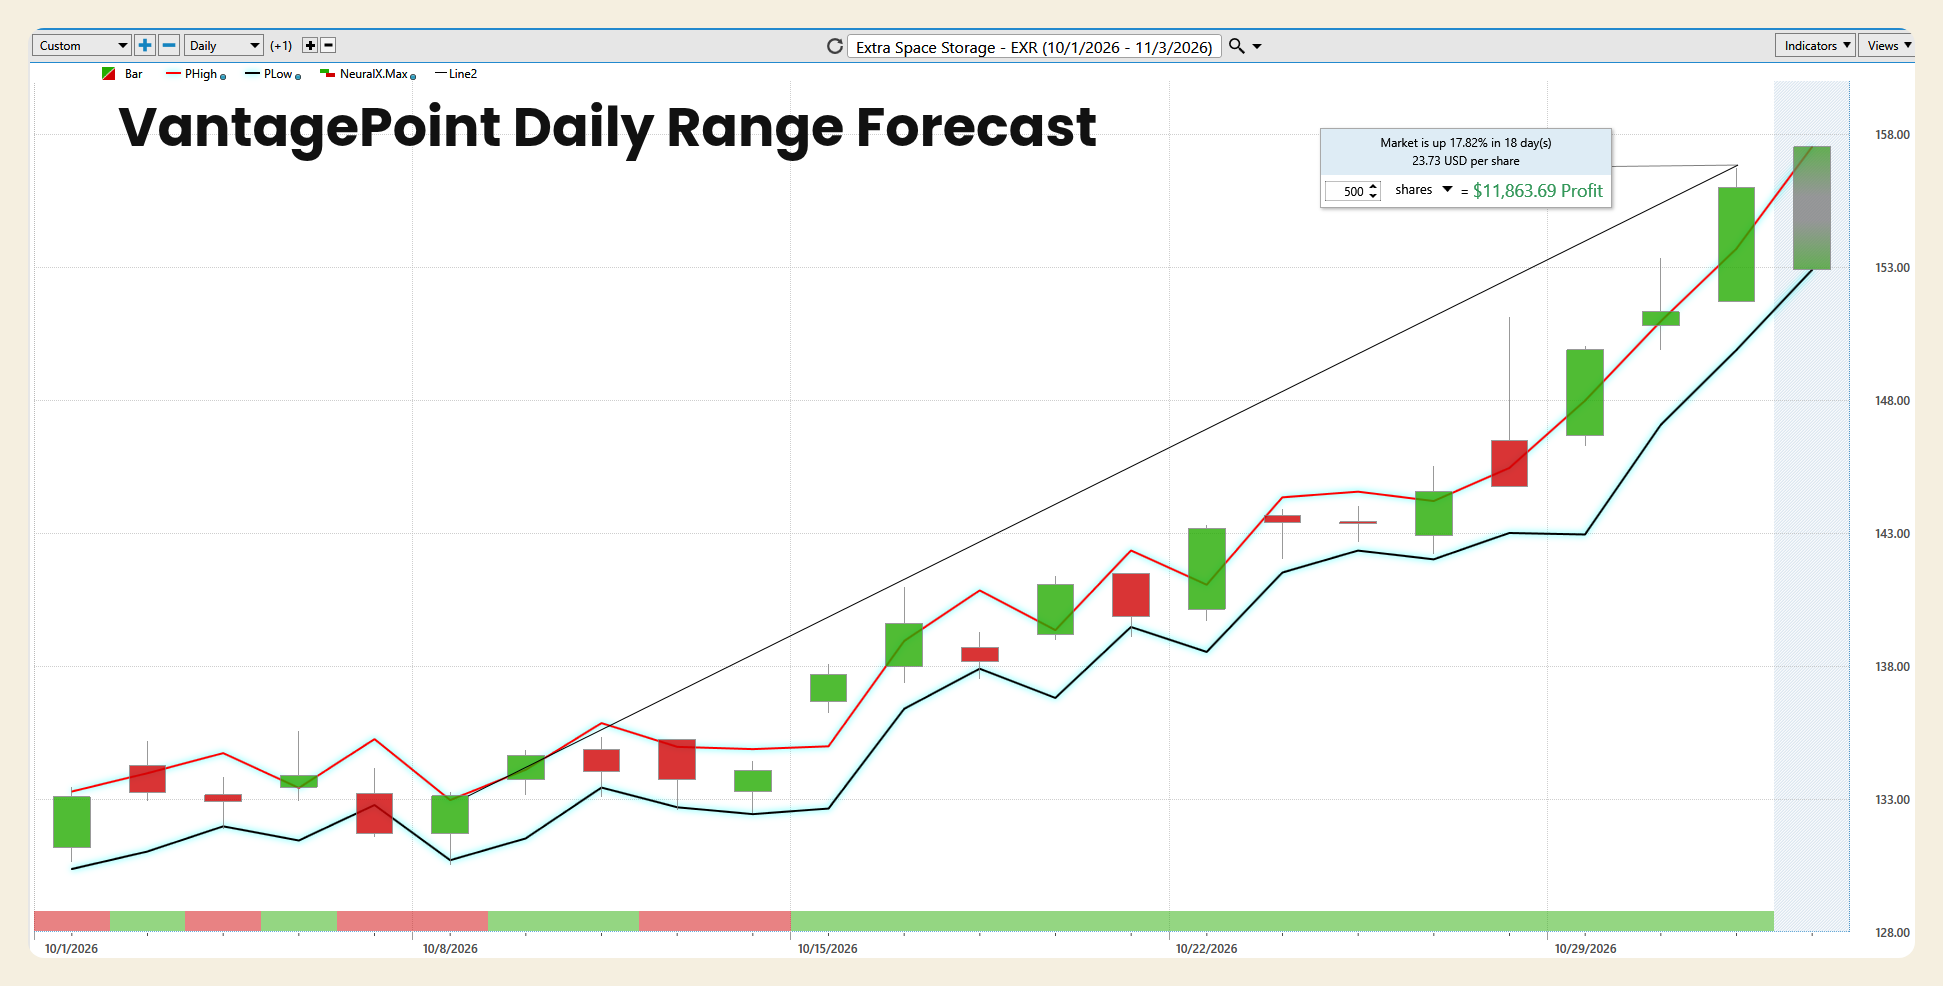
The November 2 session shows why the boundaries matter. The forecast for that day had a predicted high of approximately $153.75. The stock opened at $151.70 and traded as high as $156.74, about $3 above the predicted high, as the whole self-storage group rallied on sector read-throughs. That was a breakout beyond the forecast range.
For November 3, the forecast built from the November 2 data reset higher, with a predicted high of approximately $157.60 and a predicted low of approximately $152.95, a projected range of about $4.65, or 2.98% of the November 2 close. That is wider than the stock’s recent behavior. Across the past 20 sessions, the average daily range was $2.84, or 2.01% of the prior close. The actual November 3 session stayed inside the band, trading between $154.16 and $156.25, and closed at $156.23, about $1.37 below the predicted high and about $3.28 above the predicted low.
The more important observation is the direction of both boundaries. The predicted high and the predicted low have been rising since mid-October, and both lines turned up more steeply after the October 28 session. When both boundaries rise together, the forecast is describing a trending market rather than a range-bound one. The projected band for November 3 sits entirely above the October 30 close of $151.32, which means the forecast is framing the next session around the new, higher price level rather than a return to the post-earnings range.
For a trader, the practical use is straightforward. A pullback toward the predicted low, near $152.95 for November 3, would be a test of the short-term trend rather than a break of it. A close below the predicted low, especially on a day when the Neural Index turns red, would be the first sign that the rising structure is weakening. Upper-band trading near $157.60 is the zone where short-term traders tend to tighten stops rather than chase, particularly with the 52-week high of $158.88 just above it.
Intermarket Analysis
No stock trades in isolation. VantagePoint’s Intermarket Analysis identifies the related markets whose price behavior has the greatest influence on the forecast for a given stock, and it feeds those relationships into the AI models behind the readings above.
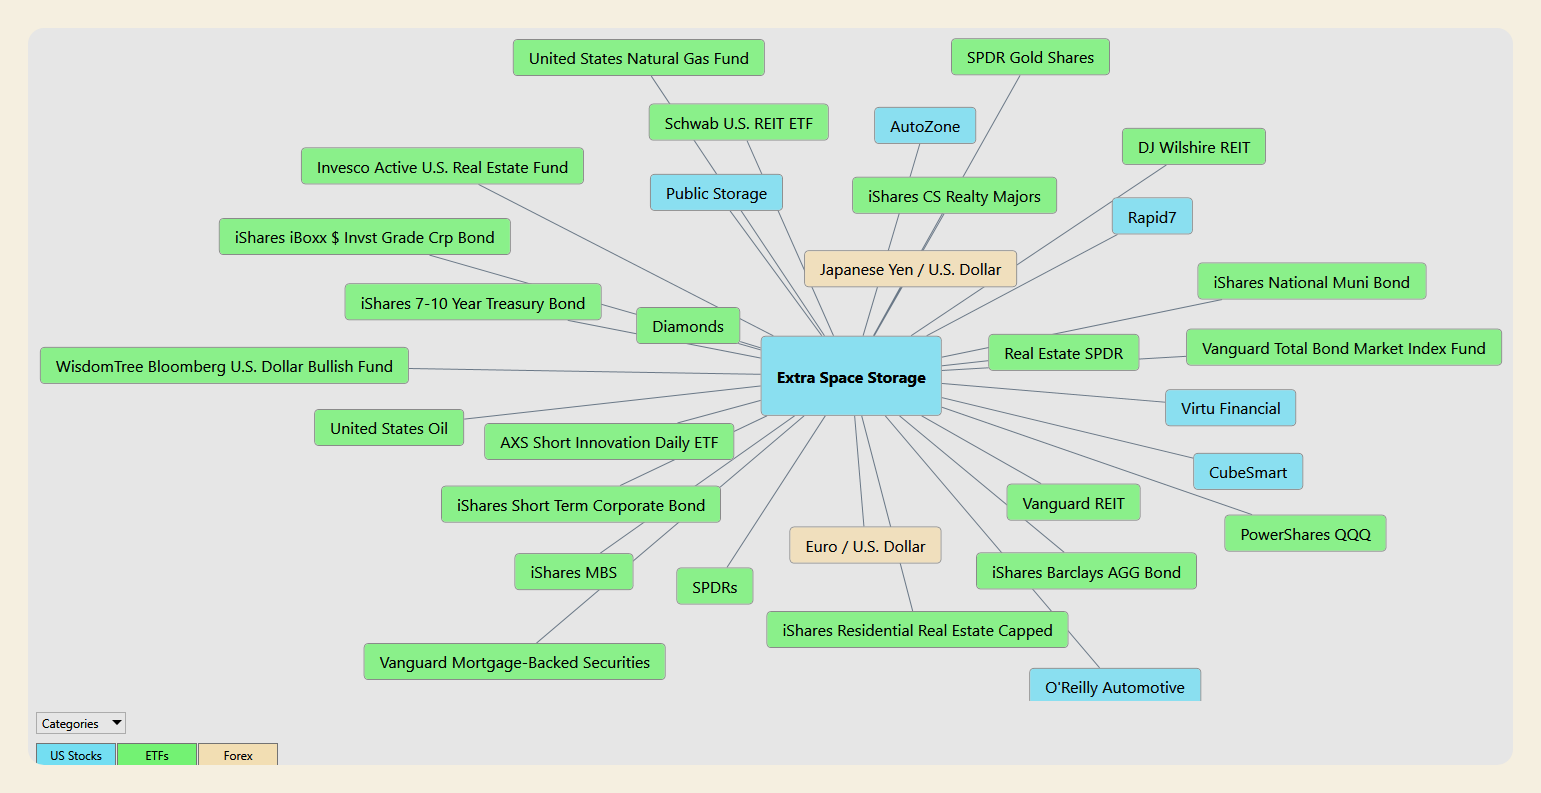
For Extra Space Storage, the map includes 6 U.S. stocks, 23 exchange-traded funds, and 2 currency pairs. The U.S. stocks are AutoZone, CubeSmart, O’Reilly Automotive, Public Storage, Rapid7, and Virtu Financial. The ETFs are the AXS Short Innovation Daily ETF, Diamonds, DJ Wilshire REIT, the Invesco Active U.S. Real Estate Fund, the iShares 7-10 Year Treasury Bond fund, iShares Barclays AGG Bond, iShares CS Realty Majors, the iShares iBoxx $ Investment Grade Corporate Bond fund, iShares MBS, the iShares National Muni Bond fund, iShares Residential Real Estate Capped, the iShares Short Term Corporate Bond fund, PowerShares QQQ, the Real Estate SPDR, the Schwab U.S. REIT ETF, SPDR Gold Shares, SPDRs, the United States Natural Gas Fund, United States Oil, Vanguard Mortgage-Backed Securities, Vanguard REIT, the Vanguard Total Bond Market Index Fund, and the WisdomTree Bloomberg U.S. Dollar Bullish Fund. The currency pairs are the euro against the U.S. dollar and the Japanese yen against the U.S. dollar.
What stands out is how heavily the map leans on interest rates. Eight of the 23 funds are bond funds: the iShares 7-10 Year Treasury Bond fund, iShares Barclays AGG Bond, the iShares iBoxx investment grade corporate fund, iShares MBS, the iShares National Muni Bond fund, the iShares Short Term Corporate Bond fund, Vanguard Mortgage-Backed Securities, and the Vanguard Total Bond Market Index Fund. Two of them track mortgage-backed securities, which connect directly to the mortgage rates and housing activity that drive storage demand. That fits a stock whose October moves tracked the 10-year Treasury yield session by session.
The second cluster is the company’s own industry. CubeSmart and Public Storage, Extra Space’s two closest competitors, are on the map, along with seven real estate funds: DJ Wilshire REIT, the Invesco Active U.S. Real Estate Fund, iShares CS Realty Majors, iShares Residential Real Estate Capped, the Real Estate SPDR, the Schwab U.S. REIT ETF, and Vanguard REIT. Taken together, the model is weighing whether money is moving toward or away from real estate and self-storage as a group, which is exactly what happened on November 2, when all three storage REITs rallied together on sector results.
The other clusters describe the backdrop rather than the business. Diamonds, SPDRs, PowerShares QQQ, and the AXS Short Innovation Daily ETF capture broad equity direction and the rotation between technology and defensive sectors. SPDR Gold Shares, United States Oil, and the United States Natural Gas Fund describe the commodity and inflation tape, which feeds into rate expectations. The WisdomTree dollar fund, the euro, and the yen connect to the dollar. AutoZone, O’Reilly Automotive, Rapid7, and Virtu Financial are not business peers. They are correlation inputs. Their presence on the map does not mean auto parts retailers or a security software company move storage demand. It means those markets have had a statistical relationship with EXR’s price that the model treats as useful.
The distinction matters. Intermarket Analysis does not claim that any one of these markets moves EXR on a given day. It recognizes that a large storage REIT is exposed to interest rates, housing, sector rotation, and the broader equity tape all at once, and it lets the AI weigh those influences together rather than asking a trader to track 31 charts by hand.
Our Suggestion
Extra Space Storage is a company where two honest stories are true at the same time. The first is a REIT whose earnings per share are still 28.39% below their 2022 peak after a merger that nearly doubled its debt and raised its interest expense by 189.79%, whose stock is 31.73% below its 2021 high, which trades at about 18.49 times the midpoint of its 2026 guidance, and whose share price depends heavily on a 10-year Treasury yield sitting near 5%. The second is a company with five straight quarters of improving same-store revenue, falling expenses, rising occupancy, twice-raised guidance, a 4.15% regular dividend yield, and a management team that repurchased $327.1 million of stock near $136.85 and immediately authorized $500 million more. Most of August and September gave more weight to the first story. October, and especially the week after the earnings report, gave more weight to the second.
That is the trade in one sentence: EXR is a bet that the storage recovery visible in the third-quarter report keeps building into 2027, and the bet holds only if same-store growth keeps improving and interest rates do not reverse the rotation into real estate.
The weekly chart frames the opportunity and the risk. EXR sits at the 92.01st percentile of its 52-week range, 9.79% above the $142.30 midpoint, with 1.70% of room to the $158.88 high and 19.54% of room down to the $125.71 low. The stock has recovered the entire August and September decline, and the remaining gap to the high is small enough that the next few sessions could decide whether the July high becomes a ceiling or a launch point.
Taken together, the VantagePoint readings are aligned. The Predictive Blue Line crossed above the black line on October 8, the day of the low, and has widened its lead since. The Neural Index has been green from October 15 through November 2, producing a double confirmation across that entire run, after an earlier double confirmation from October 9 through October 12. The Daily Range Forecast shows both boundaries rising, with a projected band of approximately $152.95 to $157.60 for November 3, and the actual session stayed inside it. The short-term forecasting tools are pointing in the same direction as the relative strength data and the third-quarter results.
The risks are clear. The stock already sits on the average analyst target and above the median, and only two of the twelve targets sit more than 2% above the current price. The 52-week high it is approaching was an intraday spike followed by a 17.84% decline over about ten weeks. A large share of the one-month outperformance came from rotation and falling yields rather than from company news alone. The November 2 session ran about $3 past its own predicted high. Momentum is not safety, and a stock that gave back nearly 18% from this same price zone a few months ago has shown how quickly the market can change its mind about rate-sensitive real estate.
For traders, the disciplined approach is to let the VantagePoint readings define the risk rather than the headline alone. A Neural Index turning red, a flattening Predictive Blue Line, or a close below the predicted low would each be a reason to tighten risk. A close back below the October 28 high of $151.12 would signal a failed breakout, a close below the October 27 close of $144.55 would erase the entire earnings move, and a close below the October 14 close of $134.08 would indicate that the character of the trend has changed. Until then, the evidence favors respecting the uptrend while keeping position size modest enough to absorb a rate-driven reversal near the 52-week high.
Historical returns and technical signals are not guarantees of future results. They are tools for framing probability and managing risk.
Practice great money management on every trade, and use the VantagePoint AI Daily Range Forecast to identify short-term trading opportunities while keeping risk firmly under control.
It’s not magic.
It’s machine learning.
Disclaimer: THERE IS A HIGH DEGREE OF RISK INVOLVED IN TRADING. IT IS NOT PRUDENT OR ADVISABLE TO MAKE TRADING DECISIONS THAT ARE BEYOND YOUR FINANCIAL MEANS OR INVOLVE TRADING CAPITAL THAT YOU ARE NOT WILLING AND CAPABLE OF LOSING.
EXAMPLES ARE SUCCESS STORIES AND ATYPICAL. PAST RESULTS DO NOT GUARANTEE FUTURE PERFORMANCE.
VANTAGEPOINT’S MARKETING CAMPAIGNS, OF ANY KIND, DO NOT CONSTITUTE TRADING ADVICE OR AN ENDORSEMENT OR RECOMMENDATION BY VANTAGEPOINT AI OR ANY ASSOCIATED AFFILIATES OF ANY TRADING METHODS, PROGRAMS, SYSTEMS OR ROUTINES. VANTAGEPOINT’S PERSONNEL ARE NOT LICENSED BROKERS OR ADVISORS AND DO NOT OFFER TRADING ADVICE.