






This week’s AI stock spotlight is Coty Inc. ($COTY).
Coty is one of the oldest names in the beauty business. The company was founded in Paris in 1904, is headquartered in New York, and has been publicly traded since its initial public offering in June 2013, with shares listed on the New York Stock Exchange and in Paris. JAB, the investment group that controls the company through JAB Beauty B.V., owns about 54% of the shares. Markus Strobel, a three-decade Procter & Gamble veteran who most recently ran P&G’s global skin and personal care division, became Executive Chairman and Interim Chief Executive Officer on January 1, 2026, succeeding Sue Nabi after her five years as CEO. Soraya Benchikh, formerly finance chief at British American Tobacco and president of Europe at Diageo, became Chief Financial Officer on September 1, 2026. Coty employs about 11,335 people, distributes its products in more than 130 countries and territories, and had a market value of about $3.59 billion at the November 17 close.
The business model is built largely on licenses. Coty does not own most of the fashion names on its bottles. It holds long-term agreements to develop, manufacture, market, and distribute fragrances and cosmetics under designer brands, and it earns its living by turning those names into products that move through department stores, specialty beauty retailers such as Sephora and Ulta, travel retail, drugstores, and mass merchants. The company reports two segments. Prestige, which produced 68% of first-quarter fiscal 2027 sales, is the luxury fragrance and cosmetics business, with brands including Burberry, Calvin Klein, Chloé, Davidoff, Escada, Etro, Hugo Boss, Jil Sander, Joop!, Kylie Cosmetics, Lancaster, Marc Jacobs, philosophy, Tiffany & Co., and the company’s own Infiniment Coty Paris line. Consumer Beauty, the other 32%, is the mass-market business, built around CoverGirl, Rimmel, Sally Hansen, Max Factor, Bourjois, adidas, Beckham, Nautica, Vera Wang, and the Brazilian brand Monange, among others. Coty concentrates its investment on six core Prestige brands, Hugo Boss, Burberry, Calvin Klein, Marc Jacobs, Chloé, and Kylie Cosmetics, which together make up about 73% of Prestige sales, and on four core Consumer Beauty brands, CoverGirl, Rimmel, Sally Hansen, and adidas.
Coty competes with L’Oréal, the industry’s largest company, Estée Lauder in prestige fragrance and cosmetics, Inter Parfums in licensed designer fragrance, Procter & Gamble in mass personal care, and e.l.f. Beauty in value cosmetics. Its differentiation is concentration in fragrance. Coty is one of the world’s largest fragrance companies, and fragrance has been the strongest category in beauty for several years, with global fragrance growing about 5% in the first quarter, according to management. The company also has unusual reach across price tiers, from a Burberry Prorsum ultra-premium launch at select retailers to Sally Hansen nail polish in the drugstore aisle.
The beauty sector has been a useful place to stand this fall. Consumer staples stocks rallied as investors rotated toward defensive sectors in October, with the Consumer Staples Select Sector SPDR Fund rising 10.94% for the month. Procter & Gamble reported 5% organic growth in beauty on October 22, L’Oréal and Unilever both pointed to strength in their beauty businesses, and Estée Lauder raised its guidance on November 9. The pressure points have been costs. Reckitt cut its guidance, Clorox flagged cost inflation, and the conflict in the Middle East pushed oil above $100 a barrel in October, raising freight and packaging costs across the industry. Coty sits in the middle of both trends: a fragrance-heavy portfolio in a category still growing, and a cost structure exposed to oil.
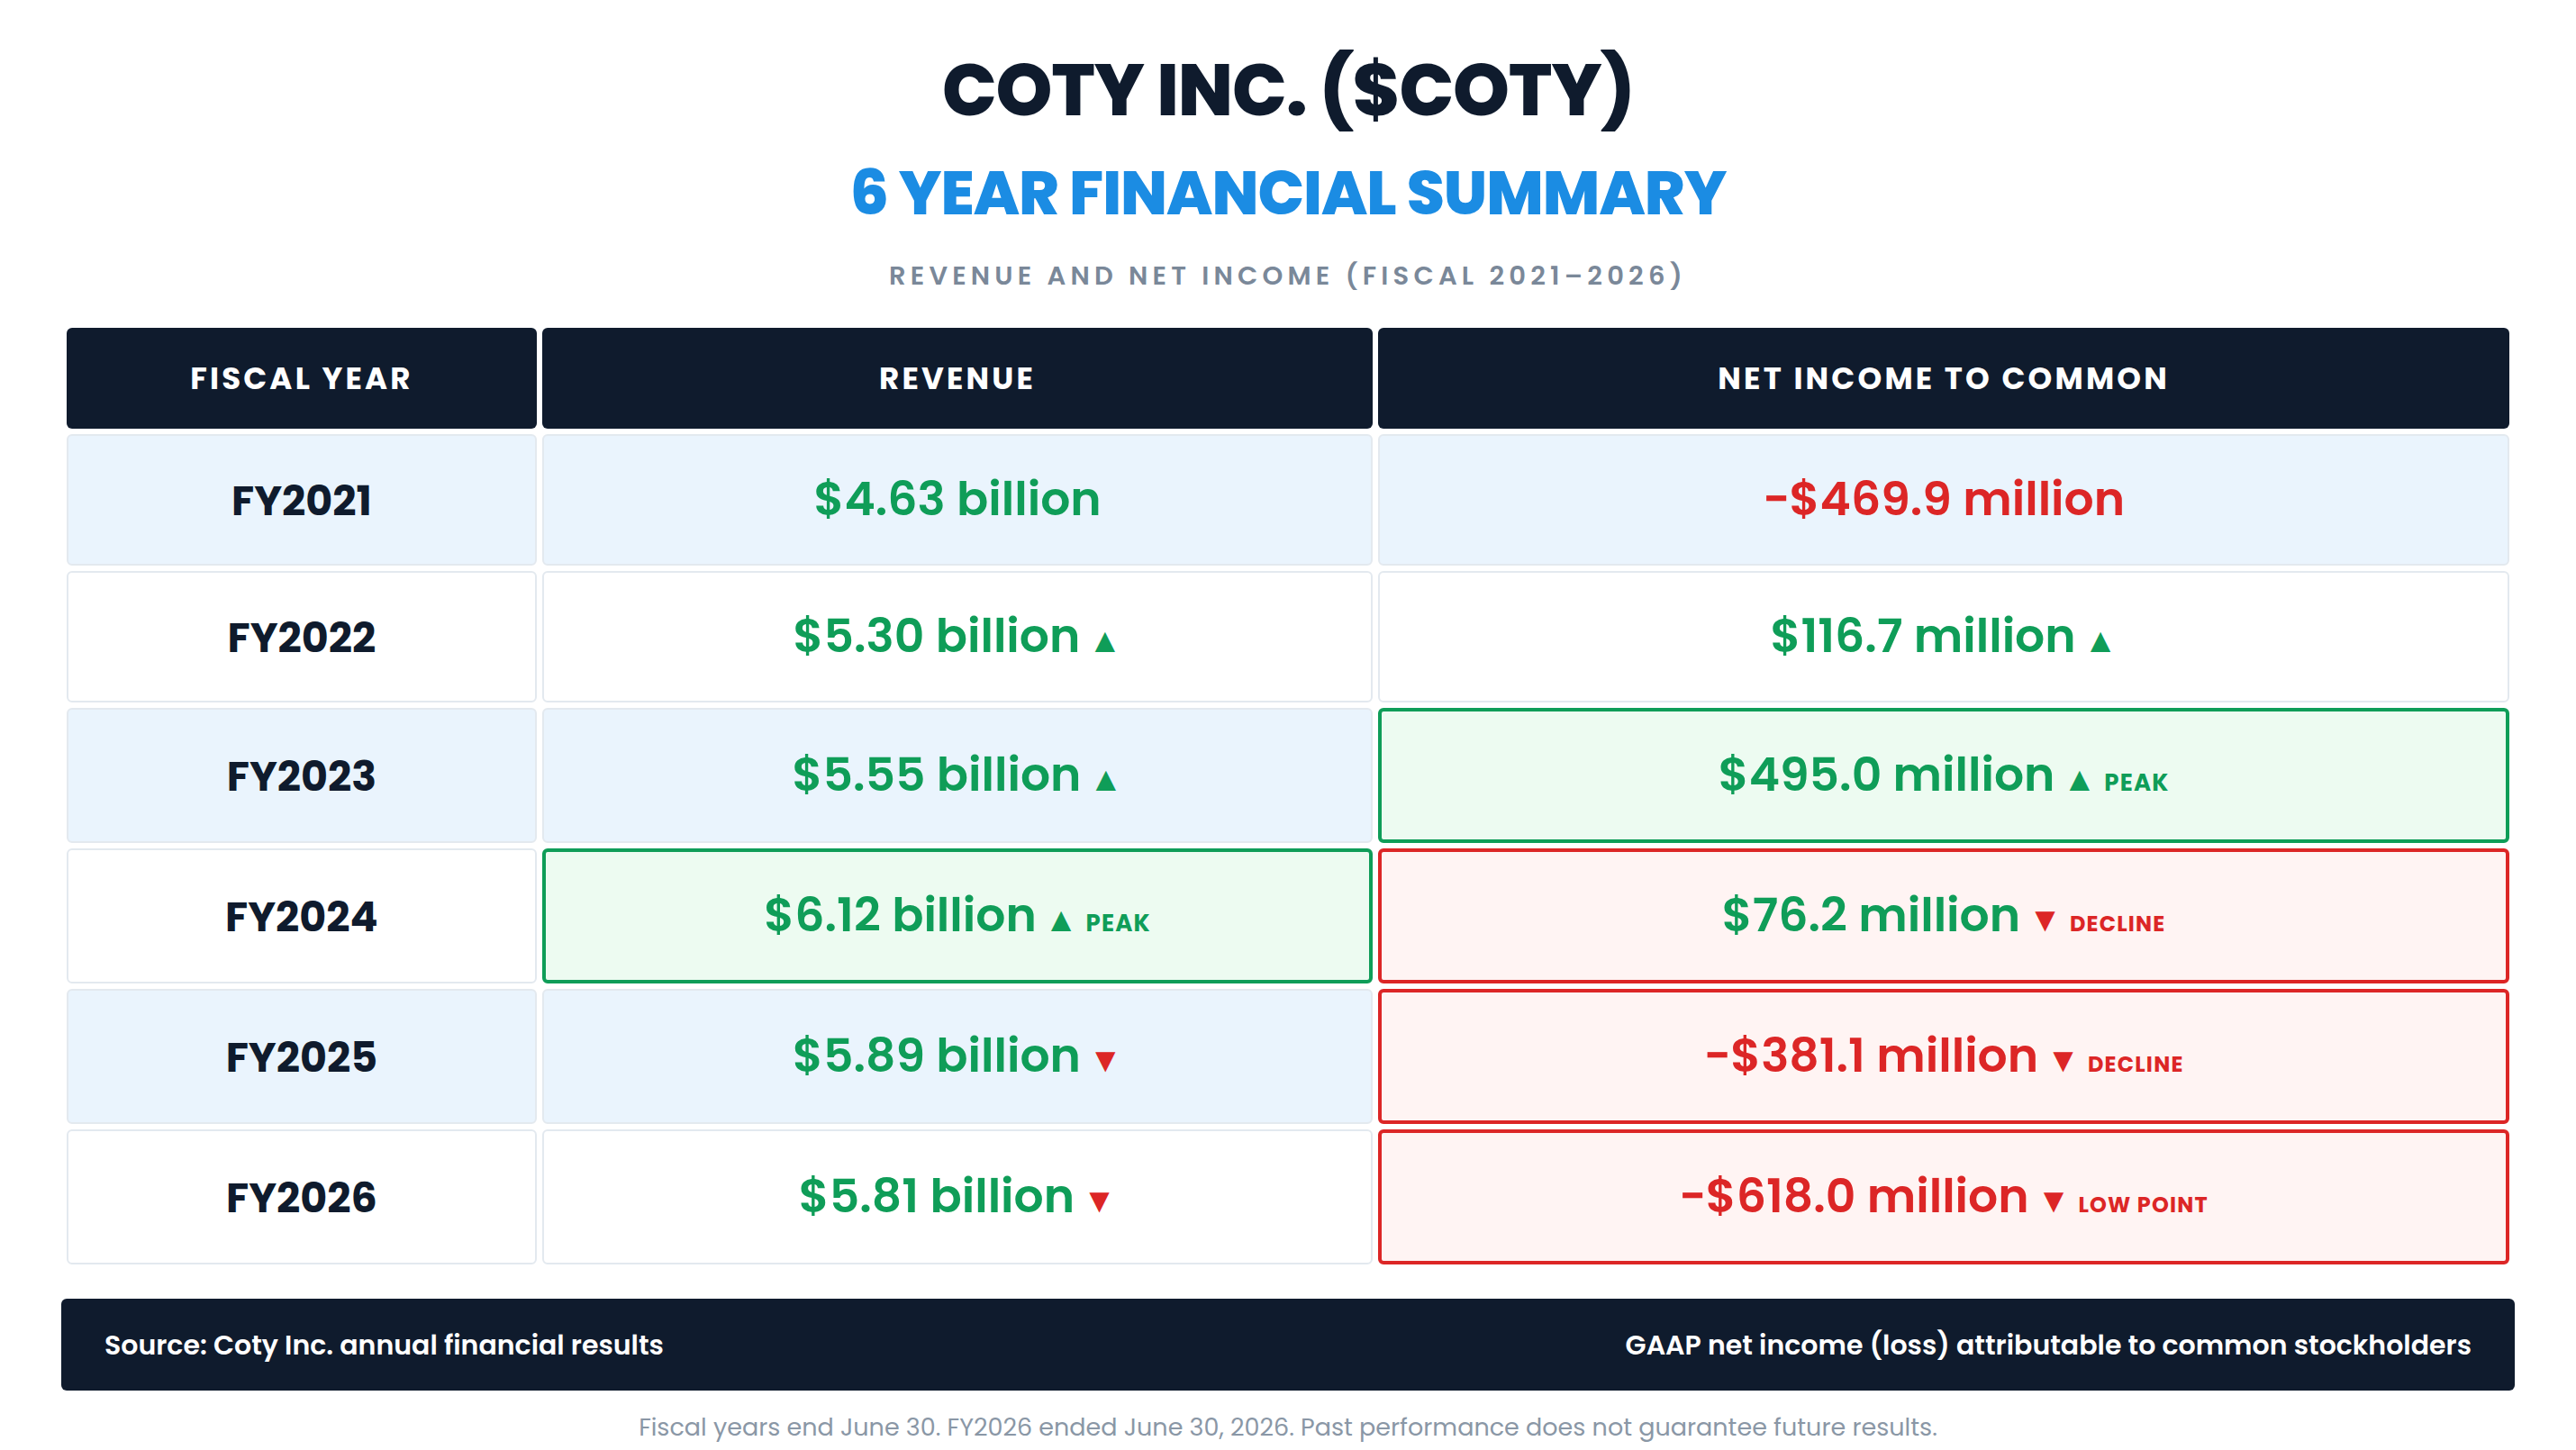
Coty’s fiscal year ends June 30, and its six-year record is a turnaround that peaked and then unwound. Revenue was $4.63 billion in fiscal 2021, rose 14.57% to $5.30 billion in fiscal 2022, 4.71% to $5.55 billion in fiscal 2023, and 10.15% to a peak of $6.12 billion in fiscal 2024. Then it slipped, falling 3.68% to $5.89 billion in fiscal 2025 and 1.46% to $5.81 billion in fiscal 2026. Over six years, revenue rose 25.42%, but fiscal 2026 revenue sits 5.09% below the peak. Net income attributable to common stockholders followed a sharper arc. Coty lost $469.9 million in fiscal 2021, earned $116.7 million in fiscal 2022 and a peak of $495.0 million in fiscal 2023, then fell to $76.2 million in fiscal 2024. It swung to a loss of $381.1 million in fiscal 2025 and a deeper loss of $618.0 million, or $0.70 per diluted share, in fiscal 2026.
Here is the number the annual table hides. Coty has not lost cash while it has lost money. Across fiscal 2021 through fiscal 2026, net income attributable to common stockholders added up to a cumulative loss of $781.1 million, while free cash flow, operating cash flow minus capital spending, added up to $2.10 billion. In fiscal 2026 alone, the company reported a $618.0 million net loss to common stockholders and still produced $348.2 million of free cash flow, from $537.8 million of operating cash flow and $189.6 million of capital spending. That free cash flow equals about 9.69% of the company’s current market value. The gross margin in fiscal 2026 was 62.89%, a level that tells you the brands still command pricing. What broke was the line below it. The operating margin went from 9.79% in fiscal 2023 to a loss of 1.40% in fiscal 2026, an operating loss of $81.5 million.
The table also hides the balance sheet work. Interest expense fell 39.82%, from $257.9 million in fiscal 2023 to $155.2 million in fiscal 2026, as the company paid down debt. Stockholders’ equity fell 14.57% in a single year, to $3.38 billion at the end of fiscal 2026 from $3.96 billion, and goodwill of $3.81 billion is now larger than total equity. The diluted share count rose 14.72% between fiscal 2021 and fiscal 2026, from about 764.8 million to about 877.4 million shares. Coty does not pay a common dividend. Its last regular quarterly dividend of $0.125 per share went ex-dividend on February 14, 2020 and was paid on March 27, 2020, the program has been suspended since, and the company has not declared any special dividends. The roughly $13 million a year the company pays in dividends goes to holders of its Series B convertible preferred stock, not to common shareholders. The cash flow statements show no share repurchases.
The first quarter of fiscal 2027, reported after the close on November 4, was the best quarter Coty has delivered in more than a year. Revenue was $1.56 billion, down 1% as reported and down 2% on a like-for-like basis, which strips out currency and portfolio changes. That beat the consensus estimate of about $1.53 billion by 1.86%. Prestige revenue was $1.06 billion, down 1%, and Consumer Beauty revenue was $496.8 million, down 2% as reported and 3% like-for-like. Adjusted earnings were $0.16 per share against a consensus estimate of $0.12, a 33.33% beat, and that figure includes a $0.01 benefit from an equity swap. Reported earnings were $0.12 per share, and net income attributable to common stockholders rose 64% to $106.2 million. Operating cash flow doubled to $130.4 million and free cash flow rose to $84.6 million from $11.2 million a year earlier. Financial net debt fell to $2.58 billion from $2.91 billion at the end of June, helped by $250 million received upfront from the early return of the Gucci license, and leverage stood at 3.1 times.
The trend inside the quarter mattered more than the headline. Like-for-like revenue declined 6% in the first half of fiscal 2026 and 4% in the second half, and the decline narrowed to 2% in this quarter. The six core Prestige brands swung from a 6% decline in the first half of fiscal 2026 to 5% growth, with five of the six growing, and Kylie Cosmetics posted double-digit like-for-like growth. The launch slate carried much of the work: BOSS Bottled Beyond for Her, Burberry Goddess Amber Vanilla, which became a top-five female fragrance launch, Mood Stones by Kylie Jenner, and a new Marc Jacobs Beauty makeup line at Sephora in the United States, the United Kingdom, Australia, and Canada contributed about 2 points of that growth. In Consumer Beauty, the like-for-like decline narrowed to 3% from 8% in the first half of fiscal 2026, CoverGirl continued to narrow its gap to the category, and Sally Hansen regained the number-one position among U.S. mass nail brands. Asia net sales rose 8%, led by China. The day before the report, Coty extended its Marc Jacobs license to a 40-year term, a partnership that dates back to 2003. The stock rose 5.47% on November 4 on that news and 12.68% on November 5 on the results, on volume of about 14.9 million shares, during a session in which the S&P 500 proxy fell 4.41% and the Nasdaq fell 5.52%.
The weak spots were in the margins. Gross margin fell 120 basis points to 63.3%, with about 50 basis points from higher freight and material costs tied to the Middle East conflict and the rest from mix and excess and obsolete inventory. Adjusted EBITDA fell 7% to $274.2 million, a 17.6% margin. The Consumer Beauty segment posted an adjusted operating loss of $15.0 million, while Prestige earned a 22.3% adjusted operating margin. Strobel told analysts that fiscal 2027 “is a transition year” and that “the recovery will not be linear.” For the second quarter, Coty guided to a like-for-like revenue decline in the low single digits plus a low-single-digit currency headwind, a high-single-digit decline in adjusted EBITDA, and adjusted earnings of $0.16 to $0.18 per share excluding the swap. It expects first-half free cash flow above $300 million, and it will give a broader outlook once its strategic review is complete. Management estimated the cost impact of higher oil at $30 million to $40 million, at the upper end if oil stays above $100.
Traders are really asking two questions now. First, is the narrowing decline the start of a real recovery, or a quarter flattered by launches and an easy comparison that the Gucci exit will erase? Gucci has been a double-digit share of the portfolio, and management said its contribution to net sales is significant enough that the company is preparing a fixed-cost savings plan to offset the loss. Second, after a 67.90% gain from the September 18 close of $2.43 to $4.08, how much good news is already in the price of a stock that most analysts still rate as neutral?
The bullish evidence is concrete. The six core Prestige brands returned to growth, the overall decline has narrowed for three straight periods, earnings beat by a third, cash flow doubled, and net debt fell by more than $300 million in a single quarter. The Marc Jacobs extension locks in for decades a franchise that Coty says ranks among the top 10 to 15 prestige female fragrances in the U.S.. The company has a full pipeline of launches, a Prestige business earning a 22.3% adjusted margin, and a free cash flow profile large relative to its market value. Wall Street responded with higher targets: Citi raised its target to $4.50 from $3 on November 12, RBC to $3.50 from $3 on November 6, and Barclays to $3 from $2 on November 9. Morgan Stanley and Deutsche Bank also raised their targets to $4 on November 9, according to market reports.
That is also where the market could be wrong. The risk case has four parts. The first is the Gucci exit. The license returns to Kering one year early, with Coty out by fiscal 2028, and the remaining $150 million of the $400 million agreement is due by September 2027. The cash is welcome, but a brand of that size is hard to replace. The second is the mass business. Consumer Beauty is still shrinking and still losing money at the adjusted operating line, and the strategic review could end with a sale of brands such as CoverGirl and Rimmel, a better outcome, or with no deal at all. The third is costs and leverage. Oil-linked freight and materials are pressuring margins, adjusted EBITDA is guided down again, and net debt of $2.58 billion is about 0.72 times the company’s market value. The fourth is legal and licensing friction. David Beckham’s company, DB Ventures, is suing Coty in New York for at least $41 million, alleging that Beckham fragrances were distributed through discount stores and a gas station bargain bin, and seeking to terminate the license. Coty disputes the claims and has asked the court to dismiss the case, and a hearing is scheduled for January. A securities class action is also pending, with a motion to dismiss filed by the defendants. The biggest risk is that the story is wearing a convincing disguise: a quarter of better trends sitting on top of a company that lost $618.0 million last year and is about to lose one of its largest brands.
Here is what is coming up, and it is a crowded calendar. The first item is the strategic review of the Consumer Beauty business, covering mass color cosmetics and the Brazil business, which Coty has said it expects to complete by the end of calendar 2026. That is roughly six weeks away. The second is the fixed-cost savings plan, which management said it would present before Christmas and no later than January, and which is designed to offset the loss of Gucci. Coty has also proposed reshaping its Consumer Beauty operations in France, which union sources say could affect about 155 roles, a figure the company has not confirmed. The third is the January court hearing in the Beckham case. The fourth is the second-quarter fiscal 2027 report, scheduled for February 5, 2027 before the market opens, where the consensus estimate calls for adjusted earnings of $0.17 per share on revenue of about $1.63 billion. The holiday quarter is Coty’s largest, so this report carries extra weight. Beyond that, BOSS Bottled Beyond for Her rolls out in the United States and the United Kingdom in the spring, Etro fragrances debut in the second half of fiscal 2027, Swarovski fragrances arrive in calendar 2027, and the HYROX fitness partnership gives BOSS a new marketing platform. Coty is also working with Brandlight on visibility in AI-driven search, and said Rimmel moved from seventh to fourth in UK rankings on large language model answers. At the annual meeting on November 5, shareholders approved a 50 million share increase to the long-term incentive plan.
This setup suits active swing traders who are comfortable with a low-priced, heavily traded stock that can move several percent in a day. Over the past 20 sessions, the average daily range was about $0.19, or 4.71% of the latest close, and daily volume averaged about 7.05 million shares. Earnings reactions have been large, and mostly negative until recently. The stock rose 12.68% on the first-quarter fiscal 2027 report. Before that, the one-day reactions were a 9.24% decline after the fourth-quarter fiscal 2026 report, a 3.52% gain after the third-quarter report, a 15.56% decline after the second-quarter report, a 1.59% decline after the first-quarter fiscal 2026 report, a 21.60% decline after the fourth-quarter fiscal 2025 report, and an 11.61% decline after the third-quarter fiscal 2025 report. It is less suited to income investors, since there is no common dividend, or to anyone who expects a smooth recovery from a company that says the recovery will not be linear.
The early-warning signal to watch is the November 12 low. COTY peaked at $4.37 intraday on November 10, then fell to an intraday low of $3.88 on November 12, an 11.21% pullback in two sessions, before recovering to $4.17 on November 16 and closing at $4.08 on November 17. That $3.88 low is the first higher low of the post-earnings advance. Below it sits the earnings gap. The stock’s high on November 4 was $3.57, and its low on November 5 was $3.80, which left a gap of $0.23 that has not been fully filled. A close below $3.88 would say the post-earnings demand for the shares is fading, and a close below $3.57 would fill the gap and return the stock to its pre-earnings range.
So the picture heading into this week is a beauty company with a strong fragrance franchise, improving trends in its core brands, a falling debt load, and solid free cash flow, alongside a shrinking mass business, a major license on the way out, a legal fight with one of its celebrity partners, and a stock that has risen 124.18% from its June low. The question for the rest of the analysis is how Wall Street is valuing that mix, and what the charts say about whether the advance has room to continue.
Wall Street Analysts Annual Forecasts
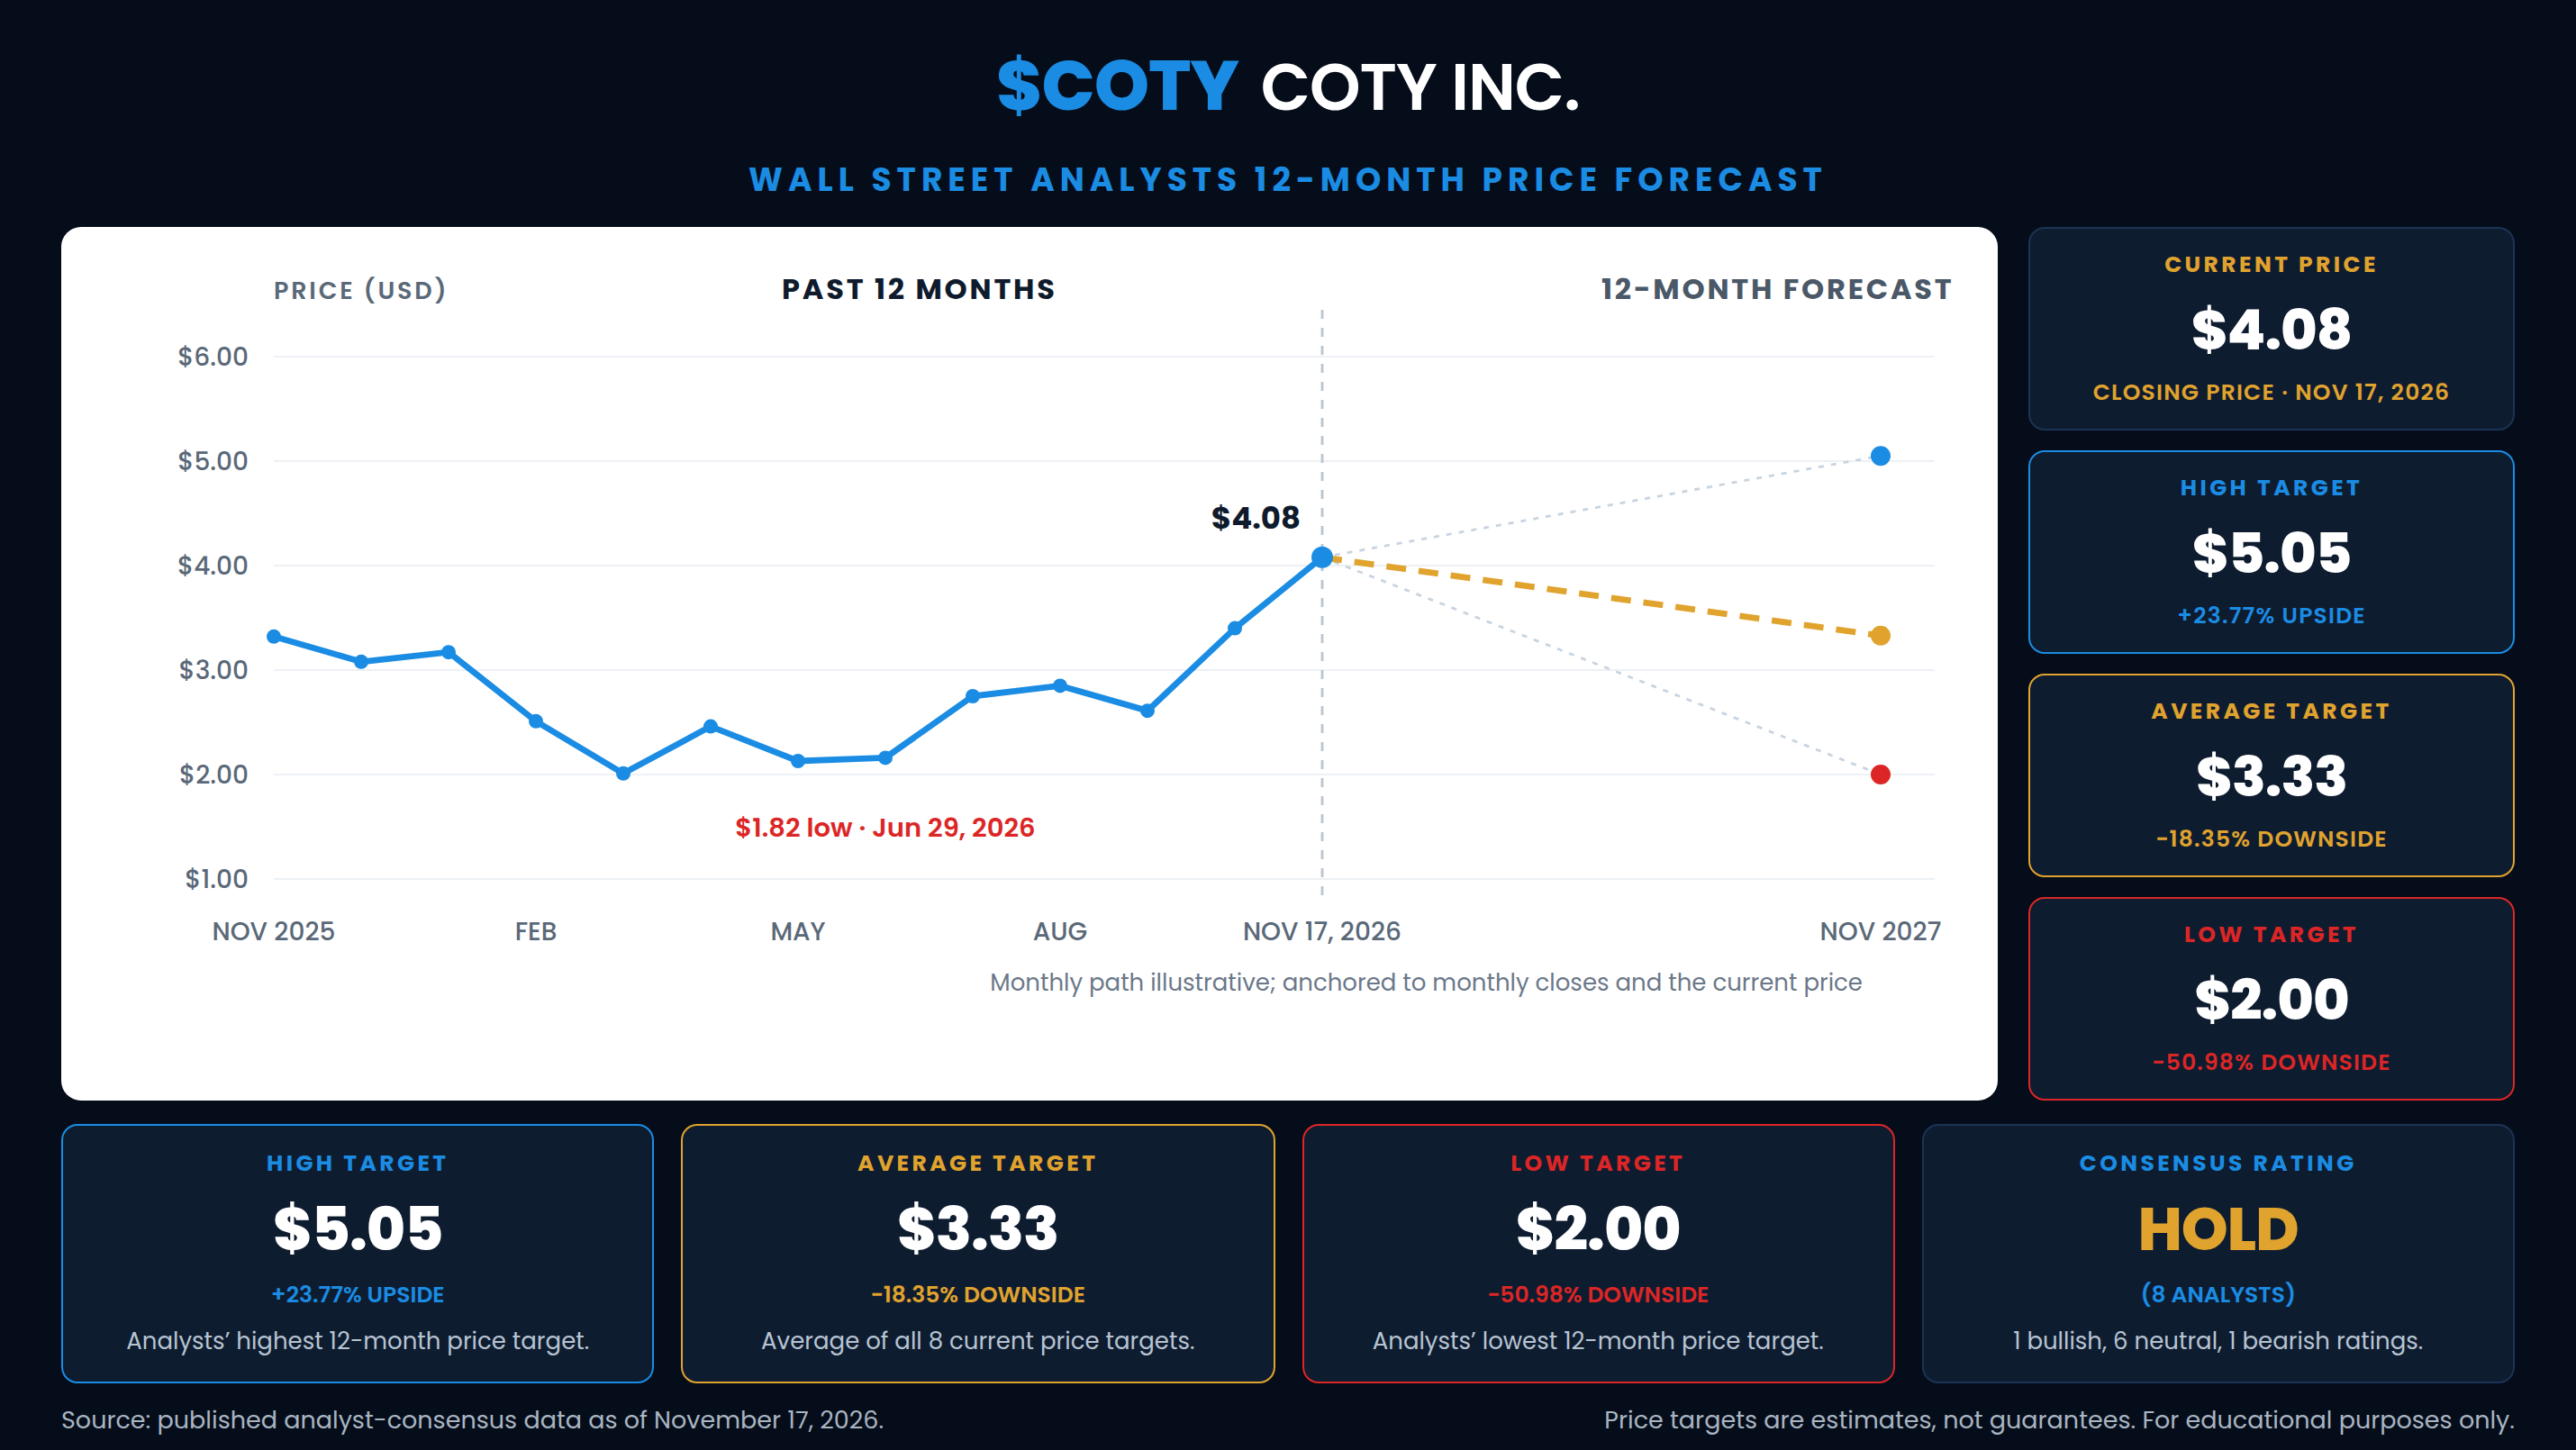
Measured against the November 17, 2026 close of $4.08, the average target implies an 18.35% decline. The median target implies a 27.08% decline. The high target implies a 23.77% gain. The low target implies a 50.98% decline. The spread between the high and low target is $3.05, which is 91.56% of the average target and 74.75% of the current share price.
That gap between the price and the targets is the story. The high target is Berenberg’s $5.05, with a Hold rating, but that target was set on September 10, 2025, more than a year ago, and it is the oldest figure in the dataset. The most recent and most relevant target is Citi’s $4.50, with a Neutral rating, raised from $3 on November 12, a week after the earnings report. RBC Capital holds a Sector Perform rating at $3.50, raised from $3 on November 6. RBC had downgraded the stock to Sector Perform from Outperform on August 20, cutting its target from $8 to $3. Barclays holds the only bearish rating, Underweight, and raised its target to $3 from $2 on November 9. Jefferies holds the only bullish rating, with a $2.95 target raised from $2.40 on October 19, which means even the one bullish rating carries a target below the current price. TD Cowen holds a Hold at $2.90, set on May 7, Morgan Stanley an Equal-Weight at $2.75, set on August 25, and Deutsche Bank a Hold at $2, the low target, set on March 30.
The practical takeaway is that the stock has moved faster than the analysts. Only two of the eight targets, Citi’s $4.50 and Berenberg’s dated $5.05, sit above the current price. Every target revision since the earnings report has been higher, and Morgan Stanley and Deutsche Bank reportedly raised their targets to $4 on November 9, according to market reports. Those actions are not reflected in the consensus figures above, and even with them, the average target would remain below $4.08. Price targets are estimates of what a security might be worth over a twelve-month horizon under a specific set of assumptions. They are not certainties, and for a company in the middle of a strategic review, a cost plan, and a license exit, those assumptions are about to change.
52-Week High and Low Boundaries Analysis
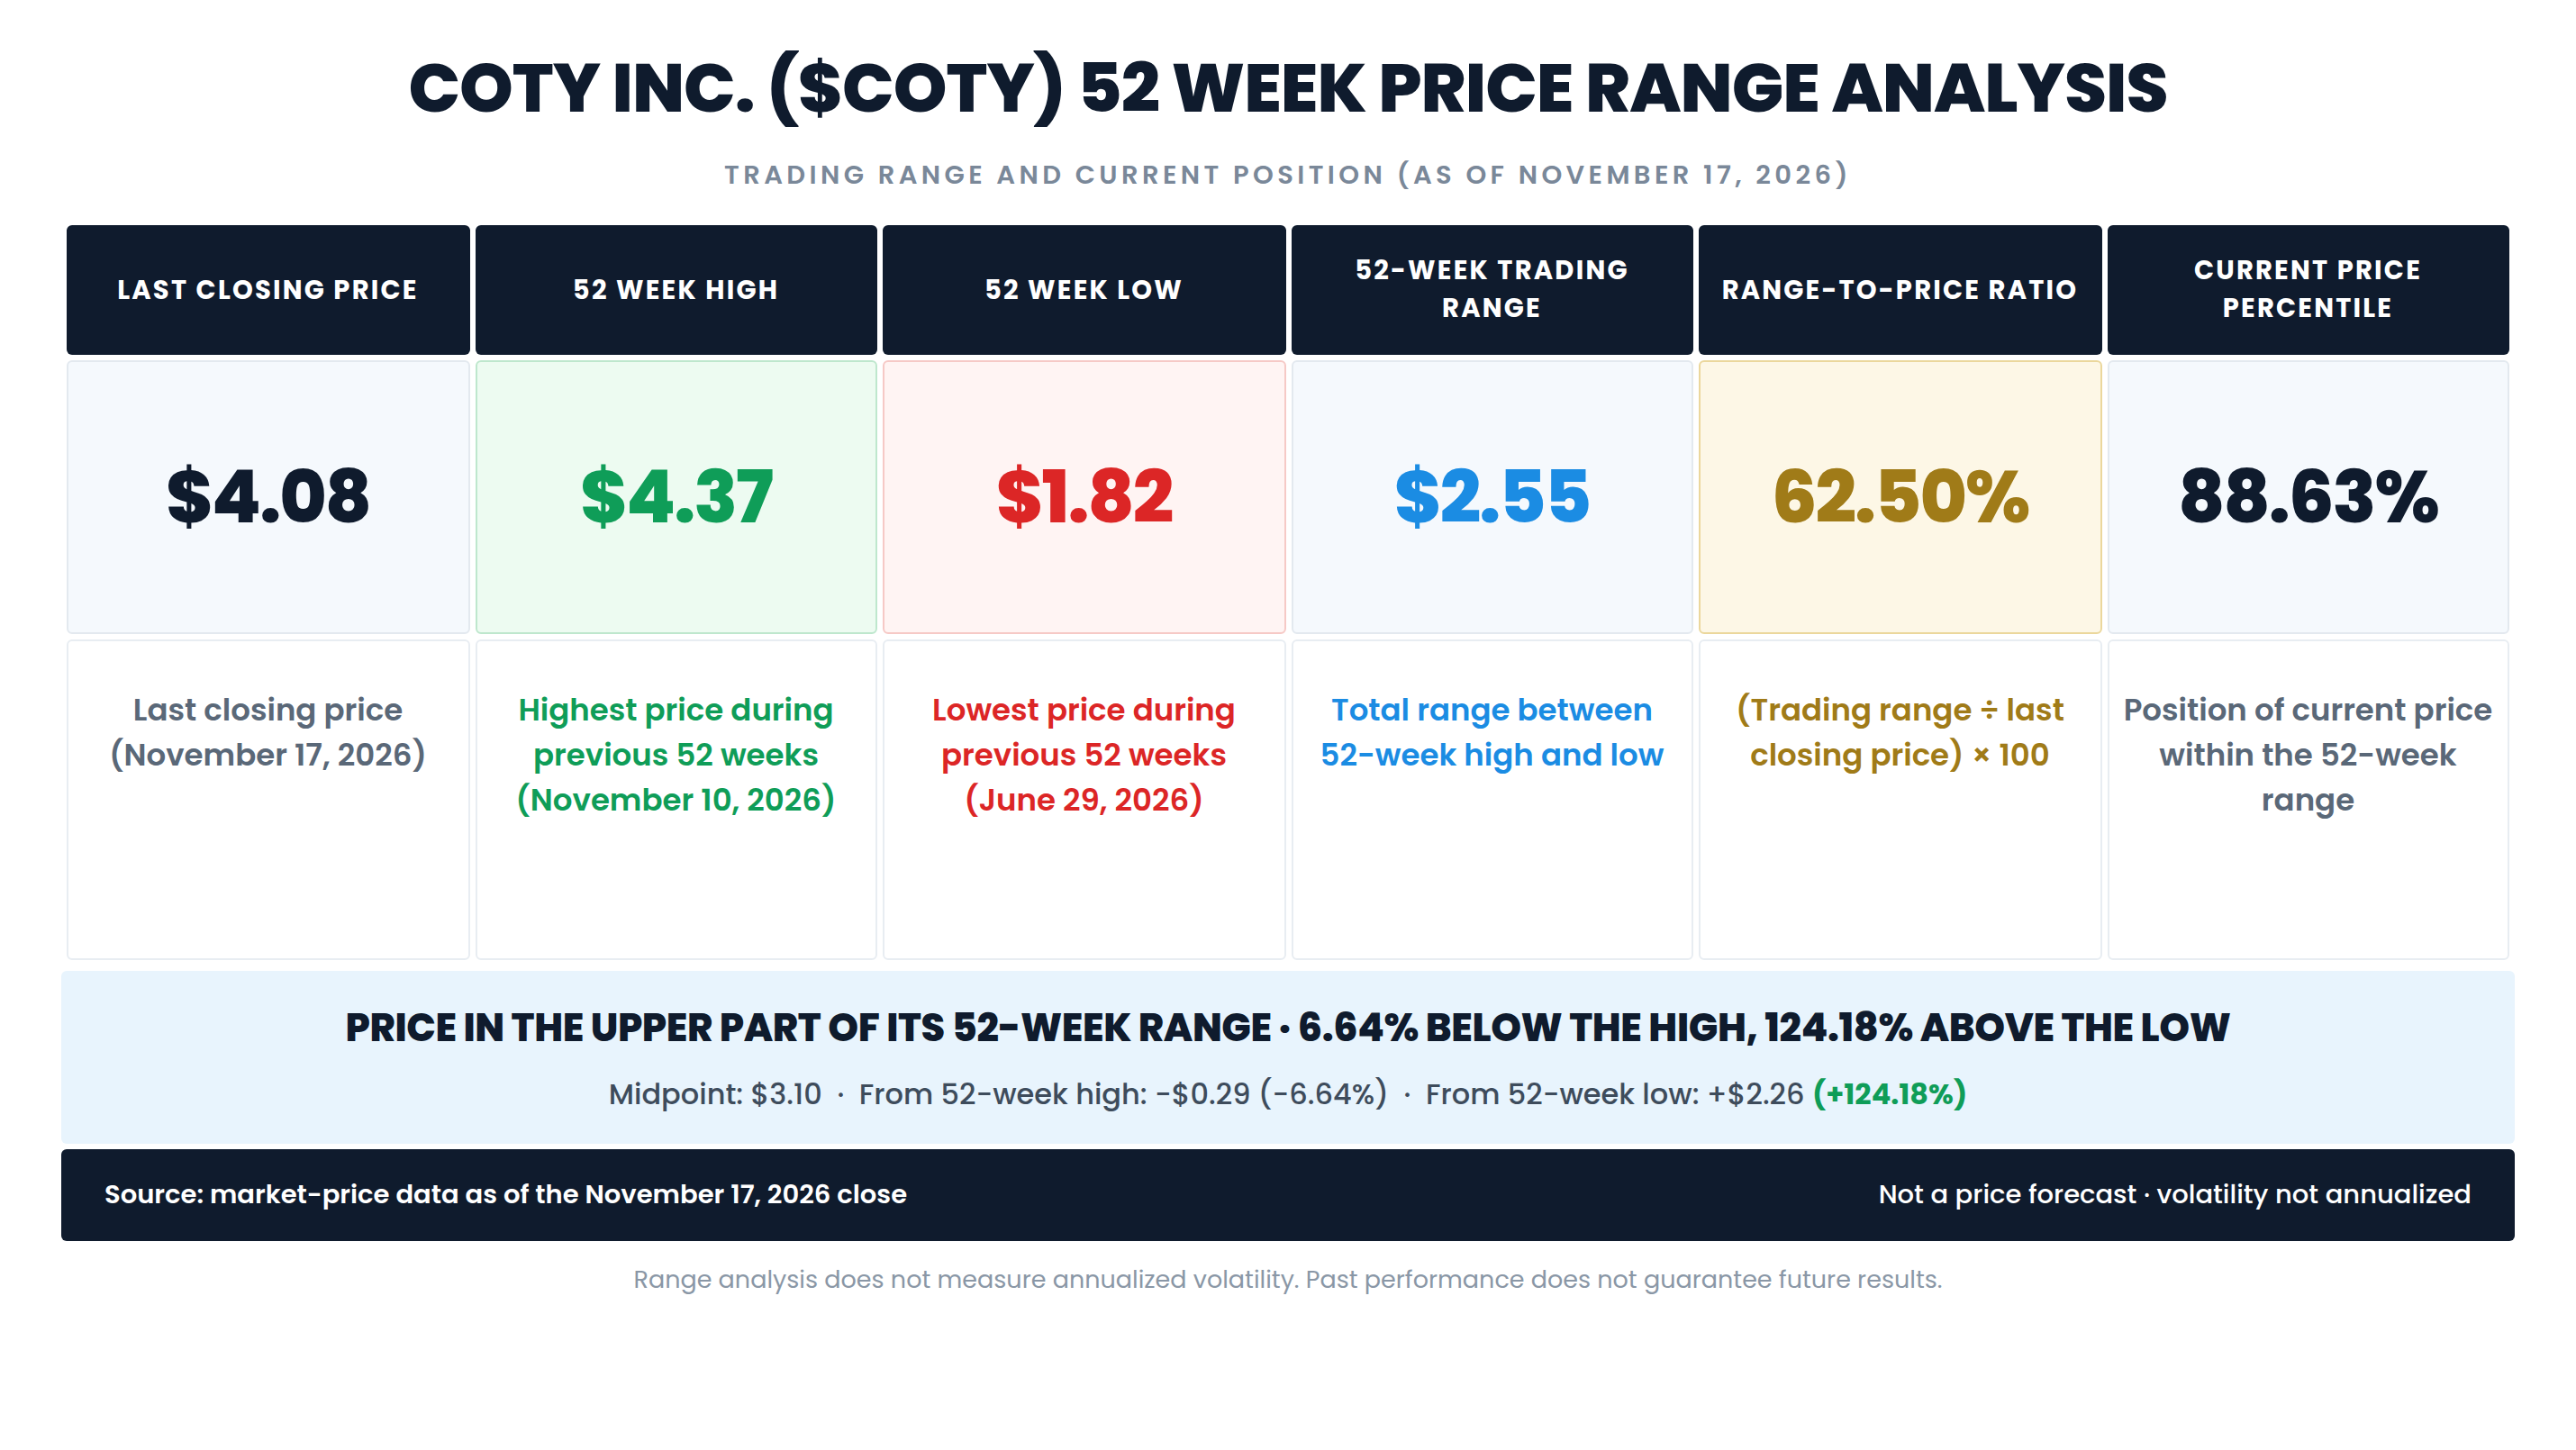
$COTY’s 52-week high is $4.37, set on November 10, 2026, and its 52-week low is $1.82, set on June 29, 2026.
The 52-week trading range is $2.55. Divided by the $4.08 closing price, that produces a range-to-price ratio of 62.50%, meaning the distance between the year’s high and low is close to two-thirds of today’s share price. The stock sits at the 88.63rd percentile of its range. The midpoint of the range is $3.095, or about $3.10, and the November 17 close is 31.83% above that midpoint, a gap of about $0.99. The stock needs a 7.11% gain, or $0.29, to reach the 52-week high, and it is 124.18% above the 52-week low. The close is 6.64% below the high.
That combination describes a stock that has traveled from the bottom of a very wide range to near the top of it in less than five months. A range-to-price ratio above 60% is a sign of extreme volatility. The 52-week high was an intraday level on November 10, and the highest close in the window was $4.33, the same day. The stock is now trading above all of its major moving averages: 11.48% above the 20-day average of about $3.66, 30.77% above the 50-day average of about $3.12, and 58.75% above the 200-day average of about $2.57. The 50-day average sits almost exactly on the range midpoint, which makes the zone around $3.10 the most important line on the chart if the advance fails.
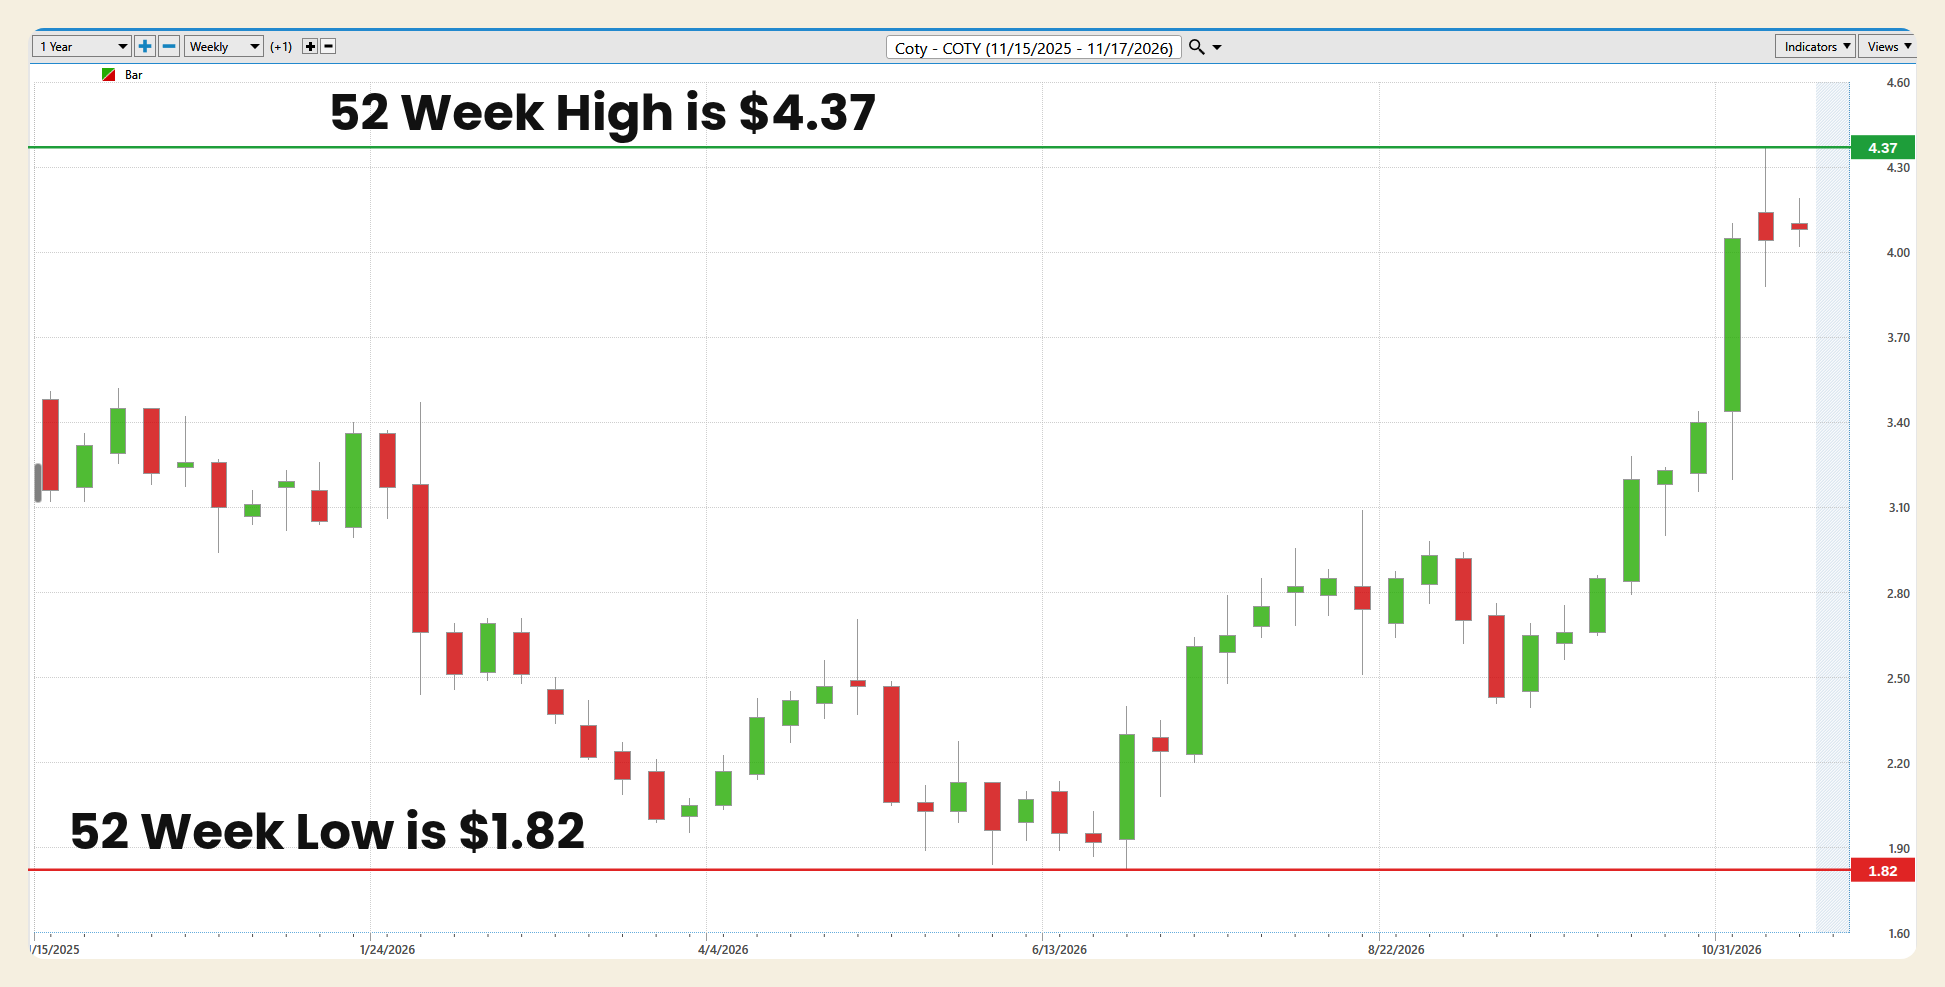
The one-year weekly chart reads in three acts. The left side shows the stock drifting between about $3.00 and $3.50 from November 2025 through January 2026, with a high of $3.52 on December 5. The second act is the decline. The week of the second-quarter fiscal 2026 report in early February produced the largest red candle on the chart, including a 15.56% one-day drop on February 6, and the slide continued through March to about $2.00. A rebound in April faded, and the stock made its $1.82 low on June 29, a 48.30% decline from the December high. The third act is the recovery. A large green candle at the turn of June and July started it, the stock climbed to about $3.09 intraday in August, pulled back to about $2.40 in September, and then broke higher, with a run of green weekly candles in October and the largest green candle of the year in the first week of November. The final two weekly candles are small, with the latest covering only November 16 and November 17, which shows the stock pausing just below the high. The chart levels described here are approximately read from the weekly candles.
Best-Case/Worst-Case Analysis
The best-case historical moves show how violently this stock can recover. From its September 24, 2020 low of $2.65, COTY rose 407.92% to its July 12, 2023 high of $13.46. Inside the current 52-week window, the stock gained 140.11% from the June 29, 2026 low of $1.82 to the November 10, 2026 high of $4.37, in a little over four months. From the September 21, 2026 intraday low of $2.40, the first session on the VantagePoint charts below, it rose 82.08% to that high. The largest single-session gains in the past year were 12.68% on November 5, 2026, the day of the first-quarter report, 10.58% on August 19, 2026, 10.20% on June 30, 2026, 8.54% on February 4, 2026, and 8.50% on October 15, 2026.
The worst-case historical moves are larger still. From the July 12, 2023 high of $13.46, the stock fell 86.48% to the June 29, 2026 low of $1.82, and the November 17 close is still 69.69% below that 2023 high. Measured from the 52-week high to the 52-week low, the worst-case drawdown is 58.35%. Inside the window, the stock fell 48.30% from the December 5, 2025 high of $3.52 to the June low, and it fell 11.21% in two sessions from the November 10 high to the November 12 low. The largest single-session declines in the past year were 15.56% on February 6, 2026, the day of the second-quarter report, 9.24% on August 20, 2026, after the fourth-quarter report, 8.21% on June 17, 2026, 8.16% on February 5, 2026, and 6.46% on September 17, 2026.
Historical gains are not forecasts, and historical losses are not predictions. What these figures show is that this stock has real capacity for movement in both directions, with a 140.11% rally and a 48.30% decline inside the same twelve months, and seven single sessions with losses of more than 6%. Position sizing and an exit plan matter, particularly for a stock priced around $4, where a move of $0.20 is about 5% and the next two months hold a strategic review, a cost plan, a court hearing, and an earnings report.
The condition that keeps the bull case alive is a strategic review that ends with a clear plan for the mass business, a savings program large enough to offset the Gucci exit, and a second-quarter report in line with the guidance of adjusted earnings of $0.16 to $0.18 per share, while the stock holds above the November 12 low of $3.88 and the earnings gap that begins at $3.80. The change of character that would invalidate the thesis is a close below the November 3 low of $3.20, the last low before the earnings gap. That level sits just above the 52-week midpoint of about $3.10 and the 50-day average of about $3.12, and a close below it would say the market has rejected the entire post-earnings advance. A nearer warning, short of that break, is a close below $3.57, which would fill the November 5 gap.
The upside opportunity is substantial but contingent.
Relative Strength Comparison
COTY has led every major U.S. benchmark over the past year, year to date, three months, and one month, and it has lagged all of them over the past week. All figures are price returns.
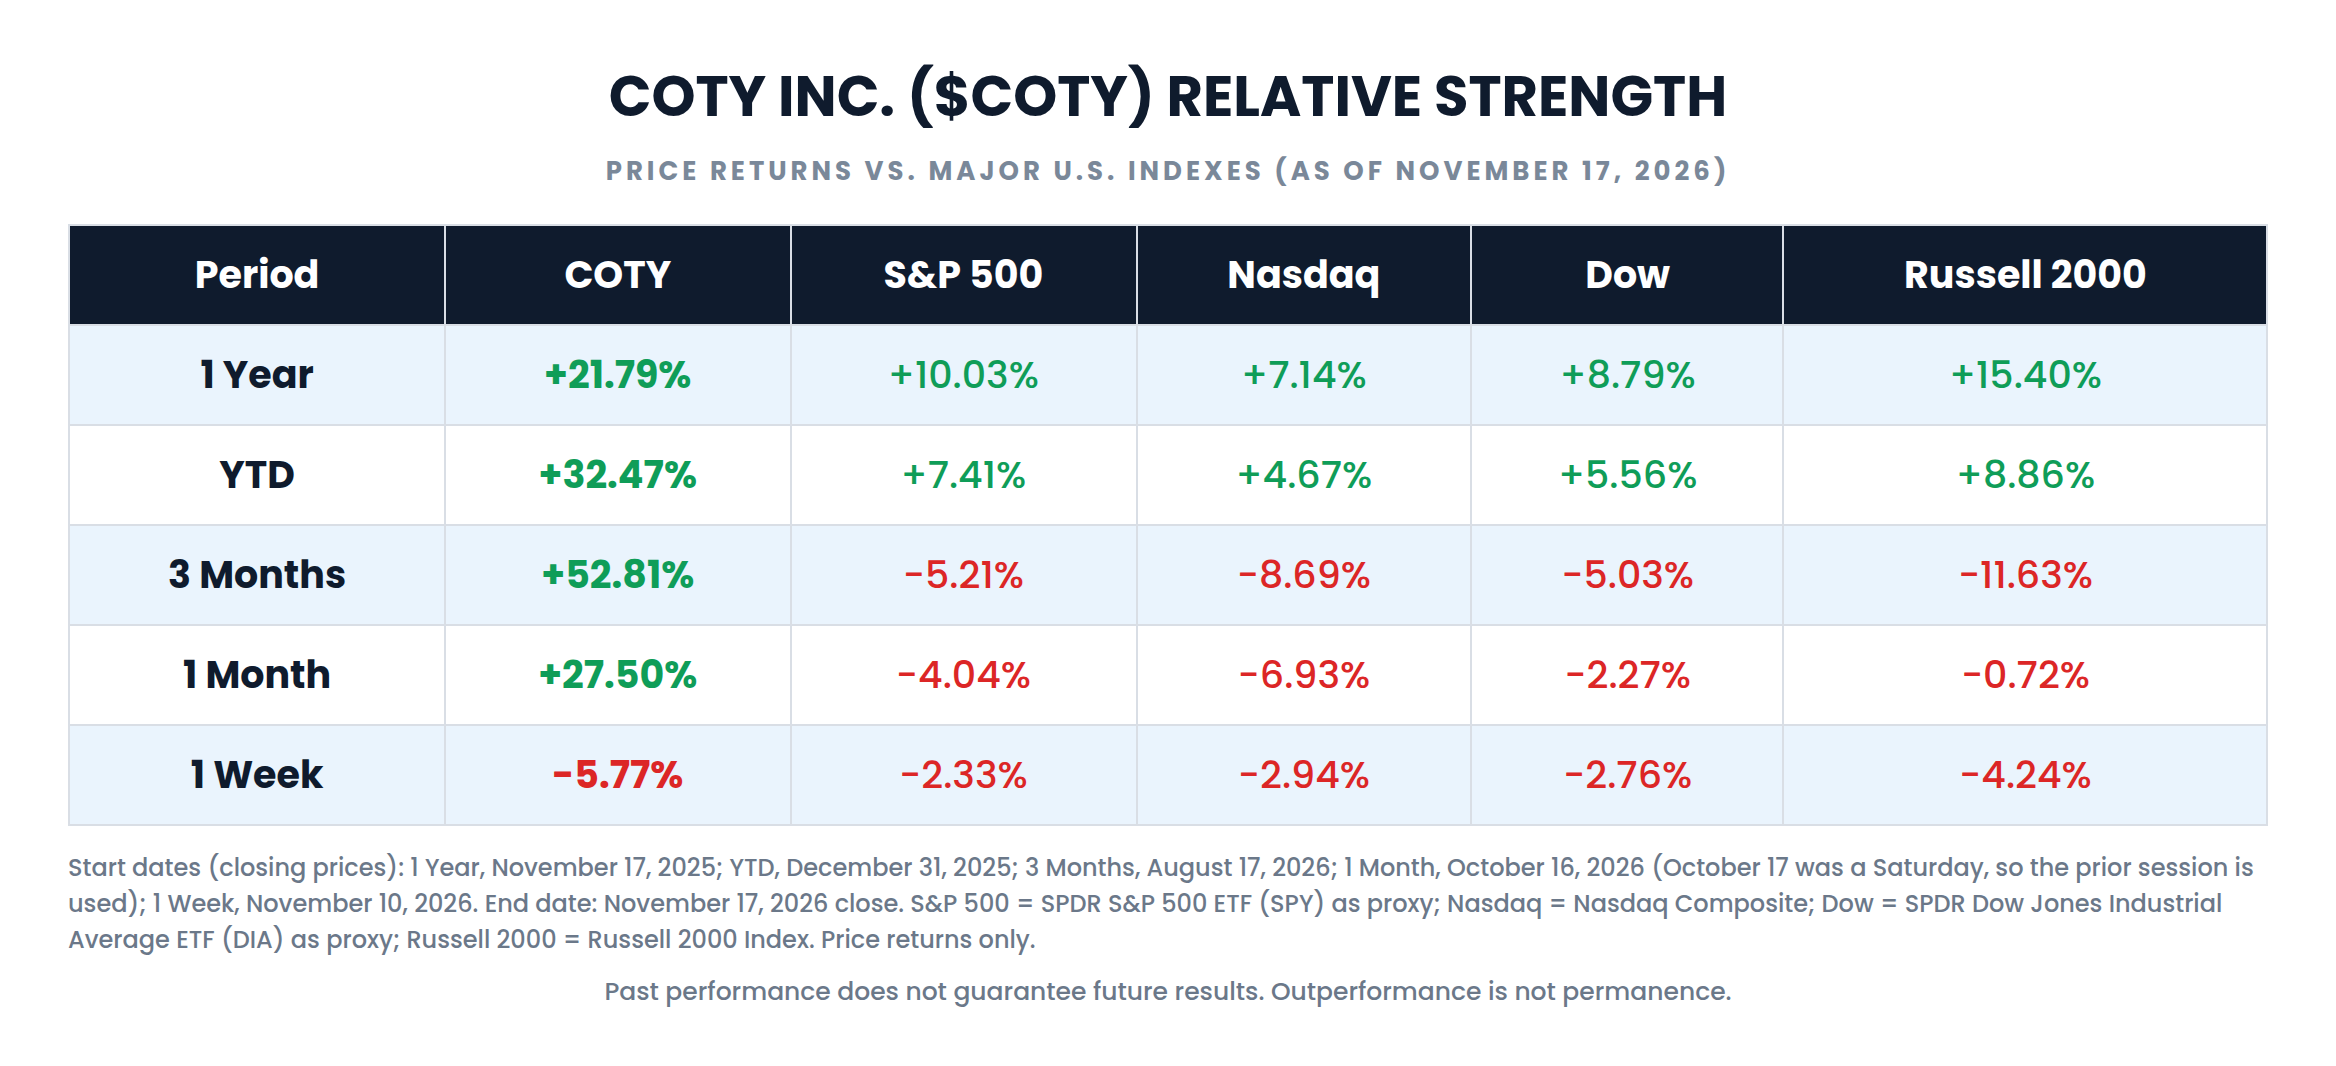
Returns are measured to the November 17, 2026 close from these starting closes: 1 Year, November 17, 2025; YTD, December 31, 2025; 3 Months, August 17, 2026; 1 Month, October 16, 2026; 1 Week, November 10, 2026. October 17, 2026 fell on a Saturday, so the one-month window uses the prior session. S&P 500 refers to the SPDR S&P 500 ETF Trust (SPY), used as a proxy for the index. Nasdaq refers to the Nasdaq Composite. Dow refers to the SPDR Dow Jones Industrial Average ETF Trust (DIA), used as a proxy for the index. Russell 2000 refers to the Russell 2000 Index. All returns exclude dividends.
The strength is concentrated in the last three months. The one-year window starts at the November 17, 2025 close of $3.35, and COTY is up 21.79% over that year, ahead of the S&P 500’s 10.03% and the Russell 2000’s 15.40%. Year to date, from the December 31, 2025 close of $3.08, COTY is up 32.47%, more than four times the S&P 500’s 7.41%. The three-month figure is where the separation is widest. From the August 17 close of $2.67, COTY is up 52.81% while every benchmark declined, a gap of 64.44 percentage points against the Russell 2000. Over one month it is up 27.50% while the Nasdaq fell 6.93%. The one-week window starts at the November 10 close of $4.33, the highest close of the year, and the 5.77% decline since then is a pullback from that peak rather than a break in the trend, though it is larger than the decline in any of the indexes.
The comparison with the beauty and staples group is just as important. The table below uses the same windows and closing dates.
| Ticker | 1 Year | YTD | 3 Months | 1 Month | 1 Week |
|---|---|---|---|---|---|
| COTY | +21.79% | +32.47% | +52.81% | +27.50% | -5.77% |
| EL | +21.41% | -0.19% | +23.93% | -0.02% | -7.86% |
| ELF | +52.78% | +46.25% | +18.74% | -2.05% | -6.16% |
| ULTA | +25.68% | +5.85% | +29.82% | +8.01% | -3.61% |
| IPAR | +58.02% | +56.14% | +18.49% | +14.49% | -2.29% |
| PG | +17.76% | +19.82% | +19.98% | +7.76% | +1.81% |
| XLP | +19.14% | +17.74% | +8.01% | +4.38% | +0.47% |
EL is Estée Lauder, ELF is e.l.f. Beauty, ULTA is Ulta Beauty, IPAR is Inter Parfums, and PG is Procter & Gamble. XLP is the Consumer Staples Select Sector SPDR Fund.
Over one year, COTY sits in the middle of its peer group. Inter Parfums, the most direct comparison as a licensed designer fragrance company, is up 58.02%, and e.l.f. Beauty is up 52.78%, while COTY’s 21.79% is roughly level with Estée Lauder and Ulta Beauty and slightly ahead of the staples ETF. The past three months change the picture. COTY’s 52.81% gain is 22.99 percentage points ahead of the best peer in the table, Ulta Beauty at 29.82%, and over one month its 27.50% gain is nearly twice Inter Parfums’ 14.49%, while Estée Lauder and e.l.f. were flat to lower. That tells you the recent move is specific to Coty, driven by its own earnings and license news, rather than a sector tide lifting every beauty stock equally. It also tells you how much ground the stock was making up. Over the past week, COTY’s 5.77% decline sits between Estée Lauder’s 7.86% decline and Ulta’s 3.61% decline, while Procter & Gamble and the staples ETF rose. Outperformance is not permanence.
VantagePoint AI Predictive Blue Line
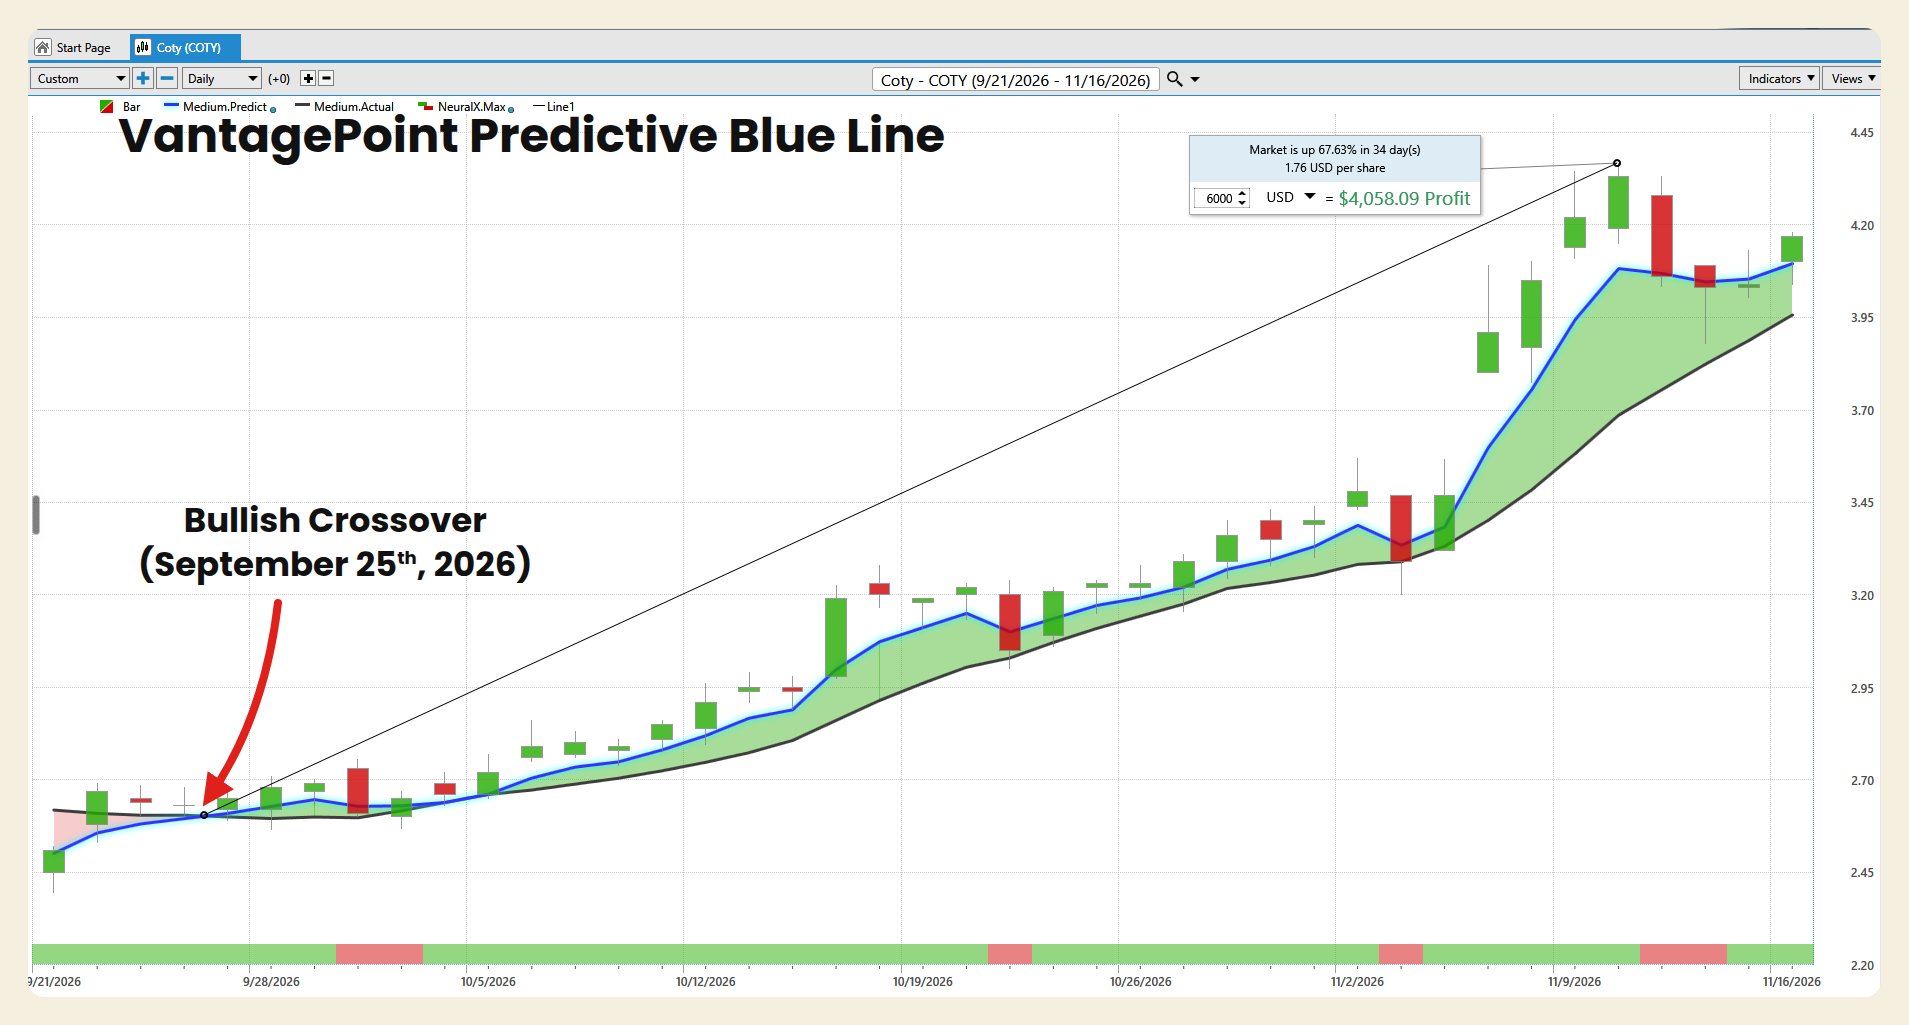
The VantagePoint AI Predictive Blue Line is a forecasted moving average that uses artificial intelligence to anticipate where the trend is heading, rather than simply reporting where it has been. The key reading is the relationship between the blue line and the black line, which represe
The chart covers September 21 through November 16, 2026. In the first sessions on the chart, the Predictive Blue Line sat below the black actual moving average, and the band between them was shaded red, as the stock traded up from its September 21 intraday low of $2.40. The blue line crossed above the black line around September 25, at approximately $2.60, and the shading turned green. The stock closed at $2.65 that day.
Since the crossover, the blue line has stayed above the black line through the entire window. In late September and early October the two lines ran close together, and the separation stayed narrow as the stock moved sideways between about $2.57 and $2.77. From mid-October the blue line began to pull away, and it dipped only briefly, around the 5.28% decline on October 21, the 5.46% decline on November 3, and the 6.24% decline on November 11, without crossing back below the black line. The widest separation came in November, as the blue line turned sharply higher after the earnings report. Over the November 11 through November 13 pullback, the blue line flattened near approximately $4.05 to $4.08 rather than turning down, and it resumed rising on November 16. At the right edge of the chart, on November 16, the blue line sits at approximately $4.10 and the black line at approximately $3.96, a separation of about $0.14. The November 16 close of $4.17 sits above both lines, about 1.71% above the blue line. The platform’s on-chart measurement reads 67.63% over 34 days, or $1.76 per share, for the move it tracks from the crossover point to the November 10 high. From the September 25 close of $2.65, the stock is up 53.96% to the November 17 close.
The distinction matters. The Blue Line turned bullish nearly six weeks before the earnings report, and it has held through three declines of 5% or more since. The current reading is bullish, with the blue line above the black line and rising again after a brief flattening. The reading that would change the picture is a blue line that turns down and crosses back below the black line, especially if it arrives while the stock is testing the $3.88 low from November 12.
VantagePoint AI Neural Index
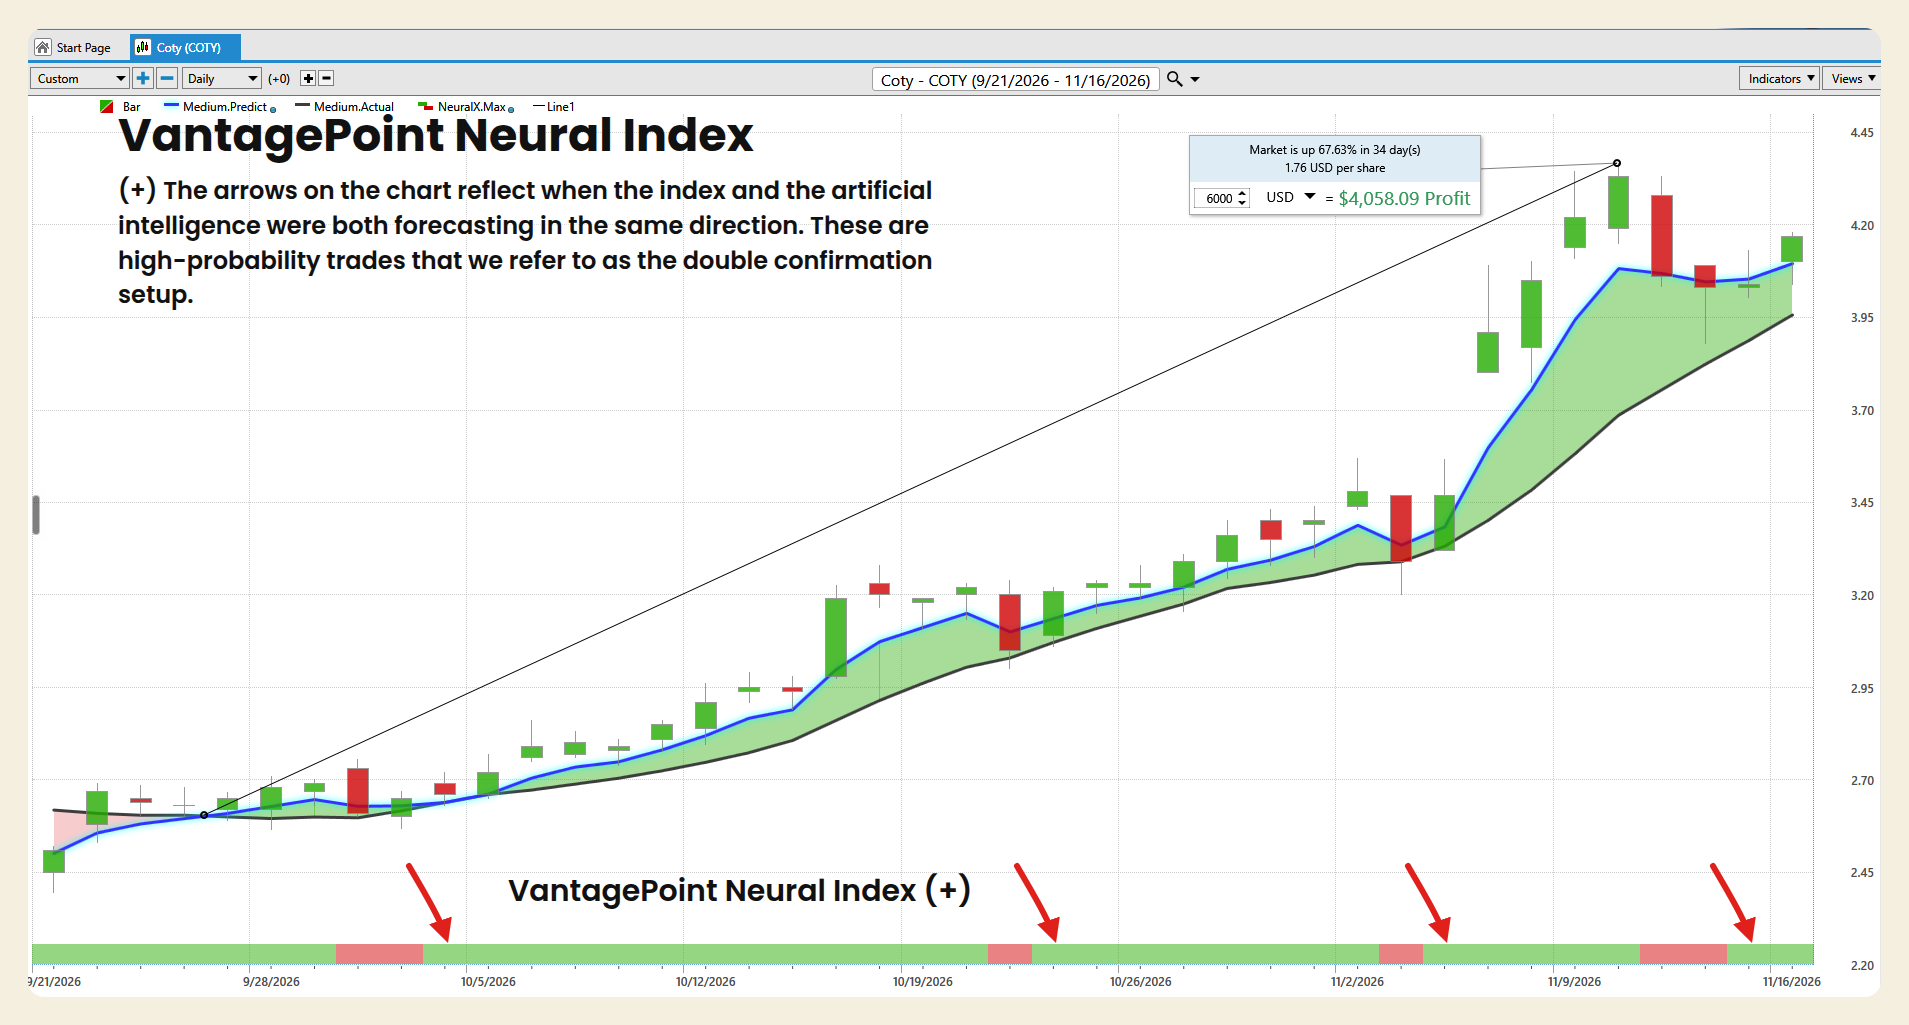
The strip has been green for most of the window, with short red interruptions that lined up closely with the stock’s pullbacks. It was green from September 21 through September 29, then red on September 30 and October 1, when the stock slipped to closes of $2.61 and $2.65. It turned green on October 2 and stayed green through October 20, the longest green stretch on the chart, as the stock climbed from $2.66 to $3.22. It turned red on October 21, the session of the 5.28% decline, then green from October 22 through November 2. It turned red on November 3, the 5.46% decline before the earnings report, and green again from November 4 through November 10, the stretch that included the 12.68% earnings gain and the run to the $4.37 high. It was red on November 11 and November 12, the two-session pullback that included a 6.24% decline on November 11 and the $3.88 low, and green on November 13 and November 16. The Daily Range Forecast chart, which extends one session further, shows the strip red again for November 17, the session the stock fell 2.16%.
When the Neural Index and the Predictive Blue Line agree, VantagePoint refers to the setup as a double confirmation. The blue line crossed above the black line around September 25, so every green reading from that point forward came with the crossover in place. The arrows mark the four double confirmation windows that began after a red reading: October 2 through October 20, October 22 through November 2, November 4 through November 10, and November 13 through November 16. Each red reading in between came while the Blue Line stayed bullish, and each pullback closed higher than the last, at $2.61 on September 30, $3.05 on October 21, $3.29 on November 3, and $4.03 on November 12. The item to watch now is the red reading on November 17. If it is brief and followed by a green reading with the Blue Line still above the black line, it fits the pattern of the past two months. If the red reading persists and the stock closes below the November 12 low, it would be the first time in this window that a pullback failed to hold above the previous one.
VantagePoint AI Daily Range Forecast
The VantagePoint AI Daily Range Forecast projects a predicted high and a predicted low for the next trading session. The red line marks the predicted high and the dark line marks the predicted low. Together they frame where price is expected to trade, giving traders a structure for entries, exits, and stop placement.
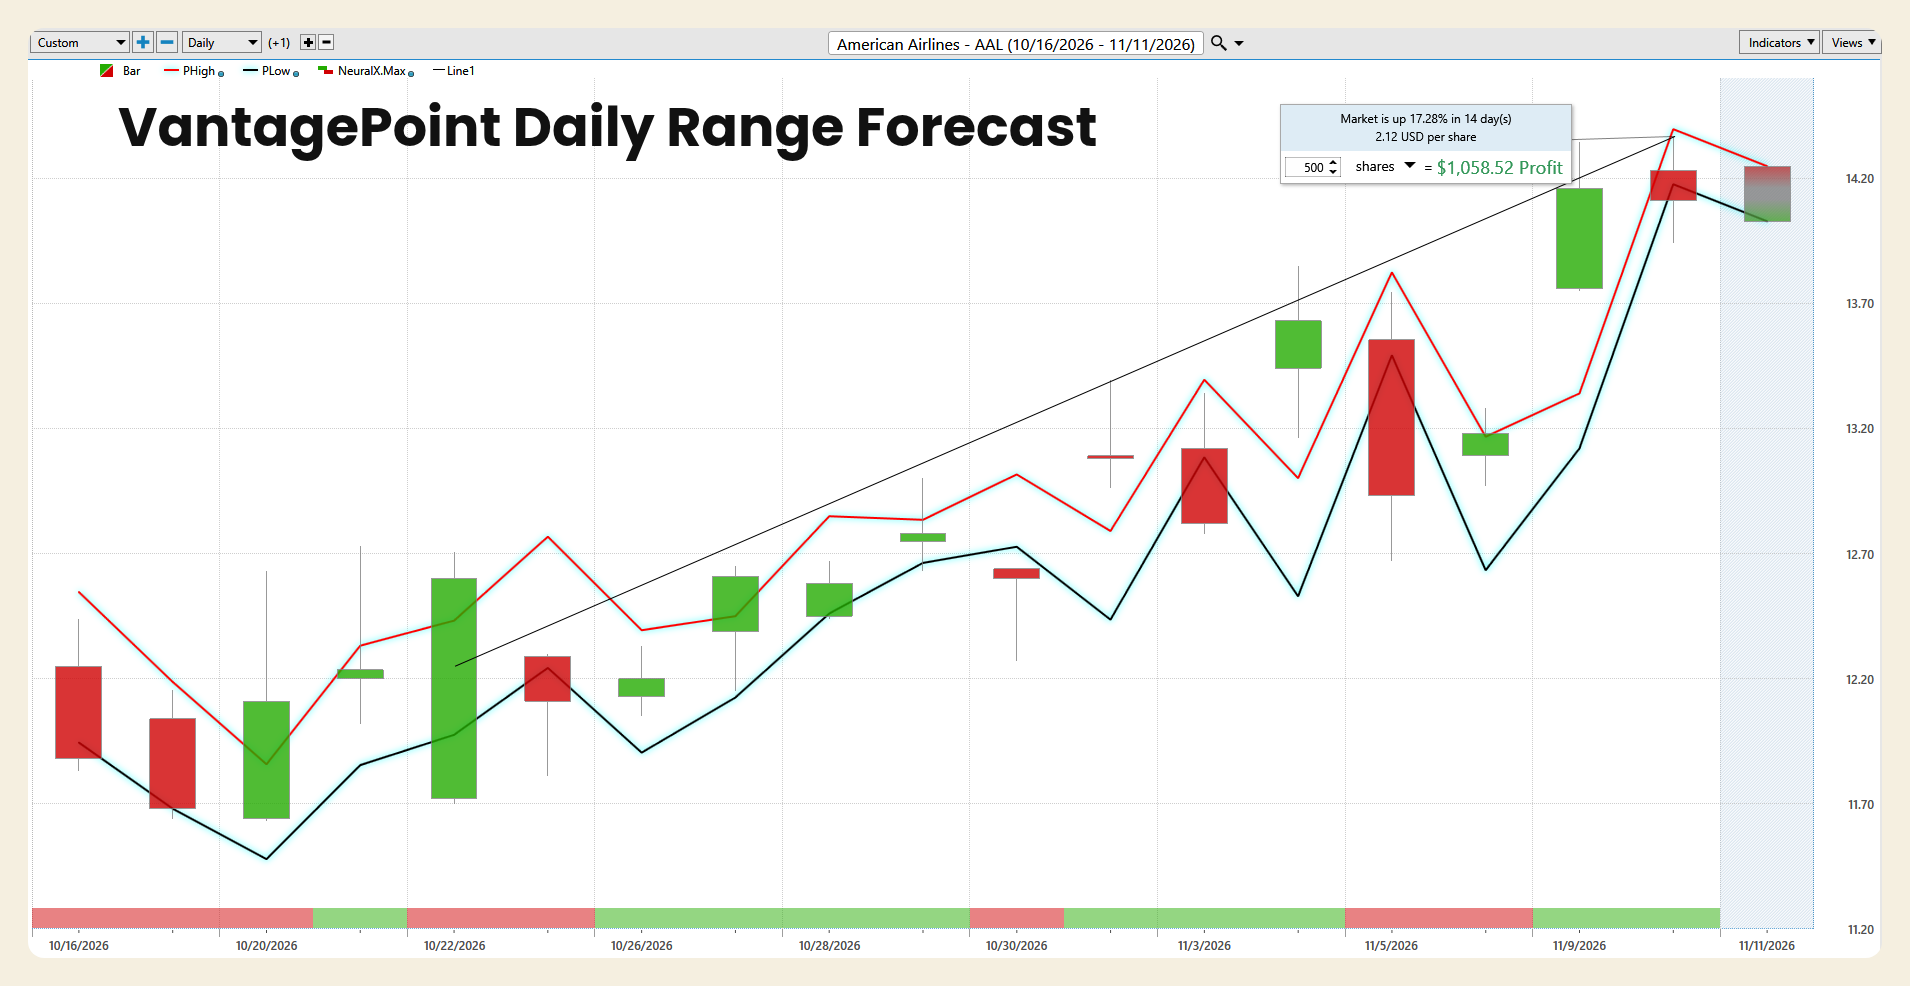
Two recent sessions show how far this stock can travel outside its forecast range when oil moves. The forecast for November 5 had a predicted high of approximately $13.80, and the stock’s actual high was $13.75, right at the upper boundary. It then fell to $12.67 during the broad market decline, well below the predicted low. The forecast for November 9 had a predicted high of approximately $13.34. The stock opened at $13.76 after crude fell and traded as high as $14.35, about $1 above the predicted high. That was a breakout beyond the forecast range.
For November 10, the predicted high was approximately $14.40 and the predicted low was approximately $14.17. The actual high of $14.37 came close to the predicted high, but the low of $13.94 undercut the predicted low by about $0.23, and the close of $14.11 finished just below it. For November 11, the forecast built from the November 10 data shows a predicted high of approximately $14.25 and a predicted low of approximately $14.03, a projected range of about $0.22, or 1.56% of the November 10 close. That is much narrower than the stock’s recent behavior. Across the past 20 sessions, the average daily range was about $0.58, or 4.09% of the latest close.
The more important observation is the direction of both boundaries. The predicted high and the predicted low have been rising since October 20, and both lines stepped higher after November 6. When both boundaries rise together, the forecast is describing a trending market rather than a range-bound one. The November 11 band sits slightly below the November 10 band, which suggests the forecast is pausing after the sharp November 9 move rather than extending it, and it is centered close to the November 10 close.
For a trader, the practical use is straightforward. A move toward the predicted low, near $14.03 for November 11, would be a test of the short-term trend rather than a break of it. A close below the predicted low, especially on a day when the Neural Index turns red, would be the first sign that the rising structure is weakening, and the November 10 session already closed slightly below its own predicted low. Upper-band trading near $14.25 is the zone where short-term traders tend to tighten stops rather than chase, particularly with the 100-day moving average near $14.23 and the range midpoint at $14.44 just above it. With a stock this volatile, the band is a frame for the session, not a wall.
Intermarket Analysis
No stock trades in isolation. VantagePoint’s U.S. patented Intermarket Analysis identifies the related markets whose price behavior has the greatest influence on the forecast for a given stock, and it feeds those relationships into the AI models behind the readings above.
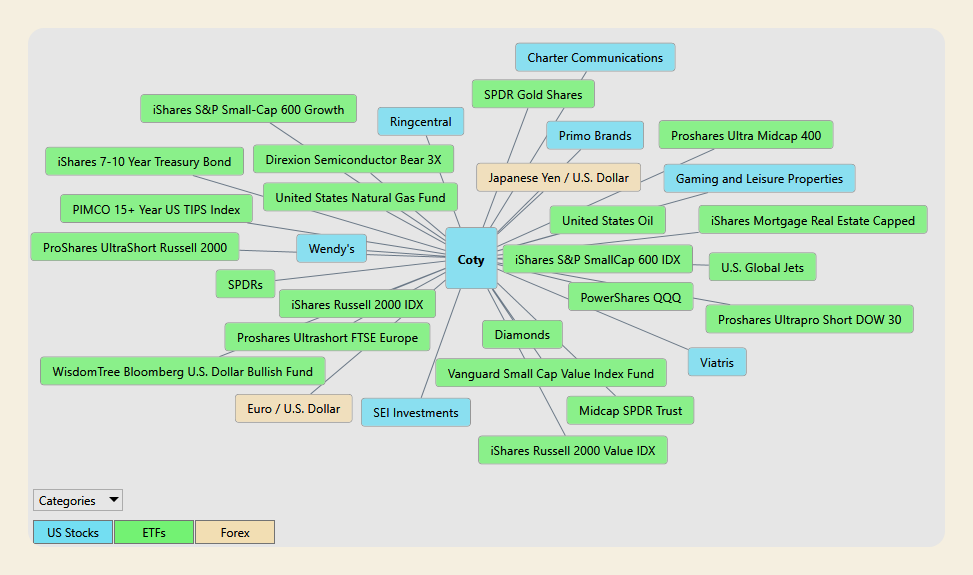
For Coty, the map includes 31 related markets: 7 U.S. stocks, 22 exchange-traded funds, and 2 currency pairs. The U.S. stocks are Charter Communications, RingCentral, Primo Brands, Gaming and Leisure Properties, Wendy’s, Viatris, and SEI Investments. The ETFs are the iShares S&P Small-Cap 600 Growth fund, SPDR Gold Shares, the iShares 7-10 Year Treasury Bond fund, the Direxion Semiconductor Bear 3X fund, the ProShares Ultra Midcap 400 fund, the United States Natural Gas Fund, the PIMCO 15+ Year US TIPS Index fund, the ProShares UltraShort Russell 2000 fund, United States Oil, the iShares Mortgage Real Estate Capped fund, SPDRs, the iShares S&P SmallCap 600 Index fund, the U.S. Global Jets ETF, the iShares Russell 2000 Index fund, PowerShares QQQ, the ProShares UltraShort FTSE Europe fund, the ProShares UltraPro Short Dow 30 fund, the WisdomTree Bloomberg U.S. Dollar Bullish Fund, Diamonds, the Vanguard Small Cap Value Index Fund, the Midcap SPDR Trust, and the iShares Russell 2000 Value Index fund. The currency pairs are the Japanese yen against the U.S. dollar and the euro against the U.S. dollar.
What stands out is that the map contains no beauty companies at all. There is no Estée Lauder, no L’Oréal, no Inter Parfums. Instead, the largest cluster is small and mid-sized company stocks: the two S&P SmallCap 600 funds, the Russell 2000 Index, Russell 2000 Value, and UltraShort Russell 2000 funds, the Vanguard Small Cap Value fund, the Midcap SPDR Trust, and the ProShares Ultra Midcap 400 fund. Eight of the 31 markets describe the small and mid-cap tape. That fits a company with a market value of about $3.59 billion and a share price near $4, which trades with the flows into and out of smaller companies as much as with its industry.
The second cluster is the cost and rate picture. United States Oil connects directly to the freight and material costs that took about 50 basis points out of Coty’s gross margin in the first quarter, and to management’s estimate of a $30 million to $40 million oil impact. The United States Natural Gas Fund and SPDR Gold Shares round out the commodity and inflation picture. The iShares 7-10 Year Treasury Bond fund, the PIMCO TIPS fund, and the iShares Mortgage Real Estate fund connect to interest rates and inflation expectations, which matter for a company carrying $2.79 billion of total debt. The third cluster is currency and Europe. Coty distributes products in more than 130 countries, is listed in Paris, and guided to a low-single-digit currency headwind in the second quarter, and the map includes the euro, the yen, the WisdomTree dollar fund, and the ProShares UltraShort FTSE Europe fund.
The remaining markets describe the backdrop rather than the business. SPDRs, Diamonds, and PowerShares QQQ capture broad equity direction, and the inverse funds, the Direxion Semiconductor Bear 3X fund and the ProShares UltraPro Short Dow 30 fund, capture the risk-off moves that have helped defensive names. That relationship was visible on November 5, when COTY rose 12.68% while the Nasdaq fell 5.52%. Primo Brands, Wendy’s, and Viatris are consumer-facing or consumer health companies. Charter Communications, RingCentral, Gaming and Leisure Properties, SEI Investments, and the U.S. Global Jets ETF are not business peers. They are correlation inputs. Their presence on the map does not mean cable television or airline travel drives fragrance demand. It means those markets have had a statistical relationship with COTY’s price that the model treats as useful.
The distinction matters. Intermarket Analysis does not claim that any one of these markets moves COTY on a given day. It recognizes that a leveraged beauty company is exposed to small-cap flows, oil, interest rates, the dollar and the euro, and the broader equity tape all at once, and it lets the AI weigh those influences together rather than asking a trader to track 31 charts by hand.
Our Suggestion
Coty is a company that lost $618.0 million last year, has seen revenue fall for two straight years from its fiscal 2024 peak, is about to lose the Gucci license, is still shrinking and losing money in its mass business, is being sued by David Beckham’s company, trades 69.69% below its 2023 high, and has an average analyst target 18.35% below its current price. However, it is also a company with a 62.89% gross margin, $348.2 million of free cash flow last year, net debt down more than $300 million in a single quarter, six core Prestige brands back to 5% growth, a 40-year extension on Marc Jacobs, a full launch calendar, and a quarter that beat earnings estimates by a third. Most of the period from February through June gave more weight to the first story. The past five months, and especially the past two weeks, gave more weight to the second.
That is the trade in one sentence: $COTY is a bet that the Prestige recovery and the coming savings plan can outrun the loss of Gucci and the drag of the mass business, and the bet holds only if the strategic review, the cost plan, and the February report all confirm what the first quarter suggested.
The weekly chart frames the opportunity and the risk. COTY sits at the 88.63rd percentile of its 52-week range, 31.83% above the midpoint of about $3.10, with 7.11% of room to the $4.37 high and 124.18% above the $1.82 low. The stock has more than doubled from its June low and now trades above every major moving average and above six of its eight analyst targets.
Taken together, the VantagePoint readings are constructive, with a fresh caution flag. The Predictive Blue Line crossed above the black line around September 25, nearly six weeks before the earnings report, and has stayed above it through three declines of 5% or more. The Neural Index has produced four double confirmation windows since the crossover, with each pullback closing higher than the last. The Daily Range Forecast shows a staircase of rising boundaries through early November and a flatter band since the earnings jump. The caution is the November 17 session, which closed just below its predicted low with the Neural Index red. The trend says stay interested. The volatility says stay alert.
The risks are clear. The stock has moved faster than the analysts, and only two of eight targets sit above the price. The next two months bring the strategic review, the savings plan, the Beckham hearing, and the holiday-quarter report, any of which could reset expectations in a single session. Coty has fallen more than 9% on four of its last seven earnings reports, and it fell 48.30% between December and June. Momentum is not safety, and a stock that has rerated this quickly has less room for disappointment than it did at $2.40.
For traders, the disciplined approach is to let the VantagePoint readings define the risk rather than the headline alone. A Neural Index that stays red, a Predictive Blue Line that turns down, or another close below the predicted low would each be a reason to tighten risk. A close below the November 12 low of $3.88 would signal that the post-earnings advance is losing its footing, a close below $3.57 would fill the November 5 gap, and a close below the November 3 low of $3.20 would indicate that the character of the trend has changed. Until then, the evidence favors respecting the uptrend while keeping position size modest enough to absorb a headline-driven reversal in a stock that routinely moves more than 4% in a day.
Historical returns and technical signals are not guarantees of future results. They are tools for framing probability and managing risk.
Practice great money management on every trade, and use the VantagePoint AI Daily Range Forecast to identify short-term trading opportunities while keeping risk firmly under control.
It’s not magic.
It’s machine learning.
Disclaimer: THERE IS A HIGH DEGREE OF RISK INVOLVED IN TRADING. IT IS NOT PRUDENT OR ADVISABLE TO MAKE TRADING DECISIONS THAT ARE BEYOND YOUR FINANCIAL MEANS OR INVOLVE TRADING CAPITAL THAT YOU ARE NOT WILLING AND CAPABLE OF LOSING.
EXAMPLES ARE SUCCESS STORIES AND ATYPICAL. PAST RESULTS DO NOT GUARANTEE FUTURE PERFORMANCE.
VANTAGEPOINT’S MARKETING CAMPAIGNS, OF ANY KIND, DO NOT CONSTITUTE TRADING ADVICE OR AN ENDORSEMENT OR RECOMMENDATION BY VANTAGEPOINT AI OR ANY ASSOCIATED AFFILIATES OF ANY TRADING METHODS, PROGRAMS, SYSTEMS OR ROUTINES. VANTAGEPOINT’S PERSONNEL ARE NOT LICENSED BROKERS OR ADVISORS AND DO NOT OFFER TRADING ADVICE.