


| This week’s a.i. Stock Spotlight is Amazon ($AMZN) |
Amazon.com, Inc. ($AMZN) is a colossal entity in the retail landscape, a titan whose influence and operations extend far beyond traditional retail boundaries. Founded on July 5, 1994, by Jeff Bezos, Amazon started as an online bookstore and rapidly evolved into a diverse e-commerce platform. It’s headquartered in Seattle, Washington, employs over 1.6 million people globally, a testament to its massive scale and reach.
Amazon’s revenue streams are multifaceted, reflecting its evolution from a mere online retailer to a conglomerate with a hand in various sectors. The company’s profit centers include:
1. **Online Retail: ** The core of Amazon’s business, encompassing an extensive range of products.
2. **Amazon Prime: ** A subscription service offering free shipping, streaming, and other benefits. They have over 200 million prime subscribers who pay Amazon $14.99 per month for these additional services and offer Amazon incredible cash flow.
3. **Amazon Web Services (AWS): ** A major profit center, providing cloud computing and hosting services. Initially AWS was created to address their ecommerce platform and has evolved to be the infrastructure for many ecommerce platforms online.
4. **Amazon Marketplace: ** A platform for third-party sellers.
5. **Advertising: ** Amazon has a growing advertising business within its online platforms.
6. **Amazon Devices: ** Including Kindle, Echo, and Fire TV.
7. **Physical Stores: ** Such as Whole Foods and Amazon Go.
Amazon’s main competitors include Walmart, eBay, Alibaba, and Google, particularly in cloud services with Google Cloud and Microsoft Azure. The biggest opportunity for Amazon lies in its ability to scale operations and integrate technology into retail, exemplified by ventures like AWS and AI-driven logistics. However, this also presents risks, such as regulatory scrutiny, dependency on technology, and the challenges of managing a vast and diverse operation.
The company’s biggest revenue generator has been its online retail segment, but AWS has been growing rapidly and becoming increasingly significant to its profit margins. Over the last decade, Amazon has acquired several companies, including Whole Foods Market, Zappos, Ring, Twitch, and PillPack, each acquisition strategically expanding its footprint in different sectors.
Concisely stated, $AMZN is demonstrating:
1. **Consistent Revenue Growth: ** Amazon has shown a remarkable trend of increasing revenue year-over-year.
2. **Fluctuating but Robust Profit Margins: ** While revenue grows, profit margins have fluctuated, partly due to Amazon’s heavy reinvestment strategy.
3. **AWS’s Growing Contribution: ** AWS has increasingly contributed a sizable portion of profits, highlighting its importance beyond the retail segment.
Amazon stands as a multifaceted giant, continuously pushing the boundaries of retail, technology, and logistics. Its ability to innovate, adapt, and scale makes it a formidable player in the global market, consistently attracting the attention and respect of Wall Street analysts and investors alike.
Amazon has proven itself to be one of the greatest ecommerce success stories in history. The company was founded in 1994 and was considered a laughingstock up until 2001 when it began to show slight signs of profitability. Today it is the world’s largest online ecommerce portal and has added numerous other profit centers to its thriving business.
Amazon wasted no time in 2022, embarking on a journey of operational restructuring, with a relentless focus on profitability. Key cost-cutting initiatives, such as warehouse closures, workforce optimization, and discontinuing unprofitable ventures like Amazon Care. Wall Street has been extremely impressed by the resilience and success of these programs.
In Q3 of 2023, Amazon reported a remarkable 13% year-over-year revenue growth, surpassing Wall Street expectations by a staggering $1.5 billion. Operating income more than tripled, driven predominantly by the robust performance of its e-commerce division. The North American segment alone posted over $4 billion in operating income, a remarkable turnaround from the $412 million losses reported in the same quarter the previous year.
Moreover, Amazon’s restructuring efforts catapulted its free cash flow to a remarkable 427% increase over the last year, reaching $17 billion. The company now stands in its best financial shape in years, equipped with the resources to continue investing in its business and navigating potential challenges.
While Amazon is renowned for its dominant online retail platform, contributing over 80% of its revenue, the standout growth driver has been AWS. In Q3 of 2023, AWS accounted for a staggering 60% of Amazon’s $11 billion in operating income.
The cloud computing market has experienced explosive growth, accelerated by the COVID-19 pandemic, which forced businesses to transition online and adopt hybrid work models. Additionally, cloud computing is emerging as a lucrative arena for artificial intelligence (AI) applications, as companies seek AI-powered solutions to boost productivity.
According to Grand View Research, the AI market is on track to achieve a compound annual growth rate of 37% until at least 2030, potentially surpassing $1 trillion in value. With a commanding 32% market share in the cloud sector, AWS is strategically positioned to reap substantial rewards from the AI wave.
Over the past year, AWS has expanded its suite of AI tools and unveiled plans to venture into chip production. Backed by significant financial resources and Amazon’s formidable brand presence, AWS could well become a formidable player in the realm of AI, if it hasn’t already. AWS has quickly become the company’s growth engine, contributing significantly to its operating income. The cloud sector is booming, AWS, with its dominant market share and a diverse array of AI tools, is poised to capitalize on this trend.
Despite a robust bull run in recent times, Amazon’s stock is still approximately 17% below the peak it reached in July 2021. This suggests that there may be ample room for the company’s shares to climb in the coming year. Furthermore, earnings per share (EPS) estimates are even more optimistic. By projecting Amazon’s earnings to approach nearly $5 per share by the end of fiscal 2024 and multiplying it by the company’s forward price-to-earnings ratio of 44, we arrive at a stock price projection of $211. This implies a potential stock growth of 36% over the next fiscal year. Despite the tech sector’s downturn in 2022, Amazon emerged stronger, thanks to strategic restructuring focused on profitability. The outcome? A staggering 13% year-over-year revenue growth in the third quarter of 2023, with operating income tripling. This performance, especially in its North American e-commerce business, highlights Amazon’s resilience and adept management.
The company’s financial prowess and brand power are poised to deliver substantial gains, and it’s a prospect that should not be overlooked. Amazon’s blend of financial robustness, strategic cost-cutting, and the lucrative prospects of AWS make its stock an undeniable choice in 2024. With the company’s solid footing and dynamic growth drivers, Amazon is not just a strong player in the market; it’s a force to be reckoned with. Earnings are forecast to grow 25.23% per year. Earnings grew by 77.3% over the past year.
Amazon deserves to be on your trading radar. It’s got that good old-fashioned value, and the potential for growth here.
They have a game plan to turn its Prime Video service into a cash cow through advertising. We’re talking big bucks, significant ad revenue that could be pouring in soon.
But hold on tight because that’s not all. Amazon’s operational cash flows, they’re on the rise, and so is the revenue. So, put Amazon under your trading microscope and recognize that it’s looking like it has some incredible momentum for 2024.
In this stock study we will look at the following metrics and indicators.
- Wall Street Analysts’ Estimates
- 52-week high and low boundaries
- Vantagepoint A.I. Triple Cross Forecast
- The Best Case – Worst Case Scenarios
- Neural Network Forecast
- Daily Range Forecast
- Intermarket Analysis
- Our trading suggestion
We don’t base decisions on things like earnings or fundamental cash flow valuations. However, we do look at them to better understand the financial landscape that a company is operating under.
Wall Street Analysts’ Estimates
Based on 20 Wall Street analysts offering 12-month price targets for Waste Management in the last 3 months. The average price target is $184.20 with a high forecast of $215.00 and a low forecast of $163.00. The average price target represents a -.19% change from the last price of $184.91.
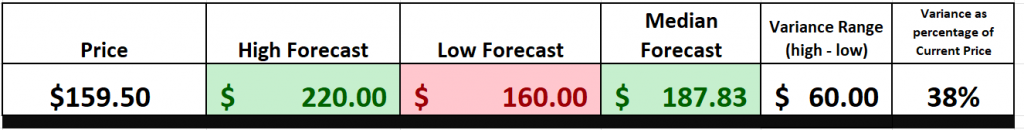
We typically like to look at the variance between the most bullish and bearish forecasts and use that as a gauge for future expected volatility. Currently this variance is 38% or $60. This is considered the extreme between the most bullish and most bearish Wall Street analyst.
$AMZN is within 5% of analysts forecasted LOW price for the next 12 months.
We find this variance valuable as often rallies and declines are confined to this level of volatility on a percentage basis.
52-Week High and Low Boundaries
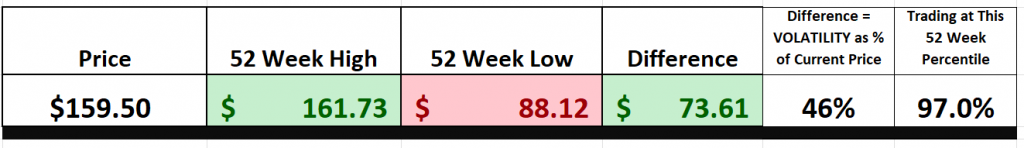
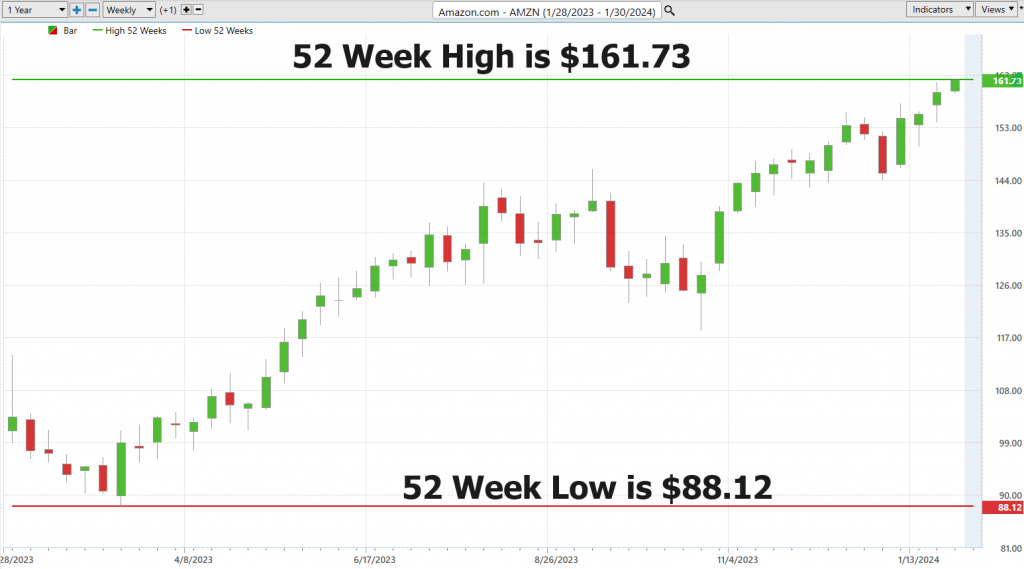
Over the past 52 weeks $AMZN has traded as high as $161.73 and as low as $88.12.
The annual trading range was $73.61. These numbers provide us with an accurate perspective of historic volatility which we can calculate by comparing the annual trading range to the current price. Over the last 52 weeks the historic volatility was 46%, which is high in comparison to the broader stock market indexes. This value tells us that based upon the recent past it would be perfectly normal to expect prices to trade 46% higher and or lower over the next 52 weeks.
The 52-week high and low metrics are crucial indicators for traders, providing valuable insights into a security’s performance and investor sentiment. Understanding these values is essential for several reasons:
1. **Psychological Impact**: The 52-week high and low create psychological benchmarks for traders and investors. Breaking these levels can significantly impact market sentiment. When a stock surpasses its 52-week high, it often indicates growing investor confidence, potentially leading to a bullish trend. Conversely, falling below the 52-week low can signal a lack of confidence and a possible bearish trend.
2. **Trend Analysis**: These metrics help in understanding the trend of a stock. Maintaining levels above the 52-week high suggests a strong bullish trend, indicating that the stock could be entering a new phase of upward trajectory. It shows that the market sentiment is in favor of the stock, which can attract more investors.
3. **Momentum Indicator**: Stocks hitting new 52-week highs frequently may exhibit strong momentum, often reflected in increased trading volume. This momentum can attract more investors and traders, potentially leading to a self-sustaining upward trend.
4. **Benchmarking and Goal Setting**: For traders, reaching new 52-week highs sets new benchmarks and goals. These milestones are not just numbers but symbols of achievement and potential for further growth. They serve as targets for traders, pushing the perceived value and potential of the stock higher.
Let’s dive into the psyche of the $AMZN traders. When a stock hitting new 52-week highs – it’s not just crunching numbers; it’s like smashing through a psychological glass ceiling. It’s a signal – loud and clear – that investor confidence is on the rise, potentially sparking a bull market bonanza around that stock.
What’s the message here? The bears are snoozing, and the bulls are dancing in the streets. It’s a pivotal moment, a narrative flip – the stock’s story is getting a bullish rewrite.
But hold on, there’s more to it – momentum. When a stock consistently sets new 52-week records, it’s like a siren song for traders. This isn’t a fleeting trend; it’s a rallying cry, drawing investors like moths to a flame, each new high adding fuel to this upward trajectory.
And here’s the kicker: for traders, these aren’t just numbers; they’re like badges of honor, goals to chase and surpass. Each new peak is a challenge, pushing the stock’s prospects sky-high. In the trading arena, where perception often molds reality, hitting new 52-week highs puts a stock, say $AMZN, in a spotlight all its own, a shining symbol of bullish optimism.
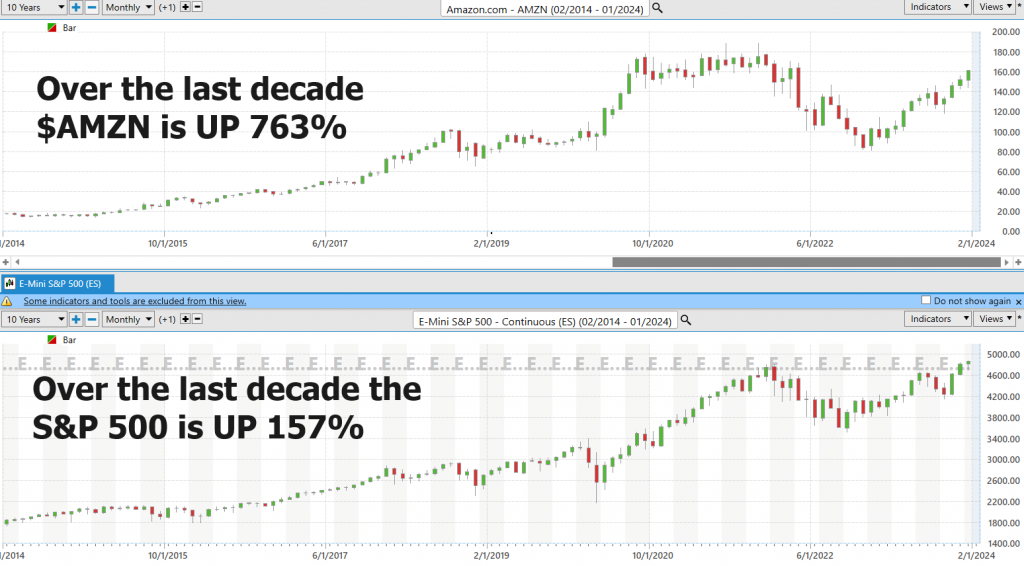
Next zoom out to the 10-year chart to get a better picture of the longer-term secular trend. These two actions are the foundation of a practical and useful analysis for any stock that you are looking to trade. $AMZN is clearly winning. Over the last 10 years $AMZN has been up 763%. Meanwhile the S&P 500 Index is up 157% over the same time.
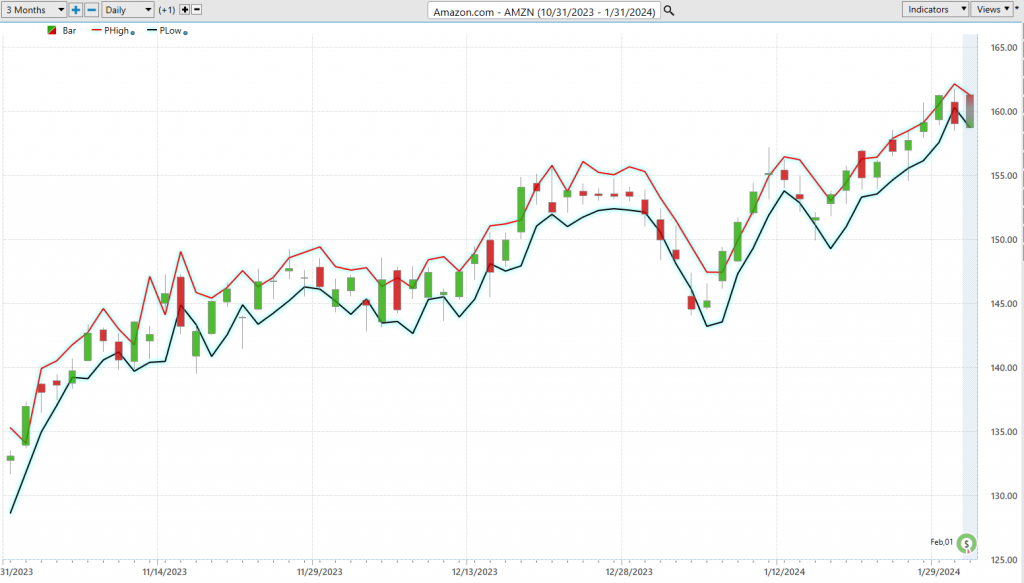
Best Case – Worst Case Scenario
Let’s delve into a tool that should be an essential part of every investor and trader’s arsenal – the delicate dance of risk and reward. Now, you might come across some fancy methods out there, but I’m going to share with you a straightforward approach known as the “Best Case – Worst Case Scenario” analysis. This method involves analyzing the most optimistic and pessimistic scenarios of the past year and then plotting them on a chart over the past year.
We’re tracing the peaks and troughs of all the market surges and declines, just like measuring the undulating waves in a tumultuous sea. This is your secret formula for deciphering the real-world rollercoaster of risk and reward.
Now, here’s the crux of the matter, you’ve got to evaluate those upward trends against the downward spirals. Think of it as navigating through choppy waters, providing you with a clear perspective on what’s at stake – plain and simple, it’s all about understanding risk and volatility.
But remember, this isn’t just some fancy footwork; it’s a strategic mindset. By scrutinizing both the peaks and valleys, you gain a comprehensive insight into a stock’s potential. It’s not just about envisioning future gains; it’s about acknowledging the associated risks as well. This approach serves as your guiding star through the unpredictable tides of the market, unveiling the essence of asset dynamics.
So, don’t just skim over those charts; truly grasp their essence. This isn’t just about tactics; it’s a strategy that empowers you to make informed decisions, manage your exposure, and construct a resilient investment blueprint that gracefully balances risk and reward. And let me assure you, the charts I’m about to present are your trusted companions when it comes to deciphering the mysteries of volatility.
From this perspective, let’s swiftly gauge the rewards and risks of the past year for $AMZN.
Here’s the best-case analysis:
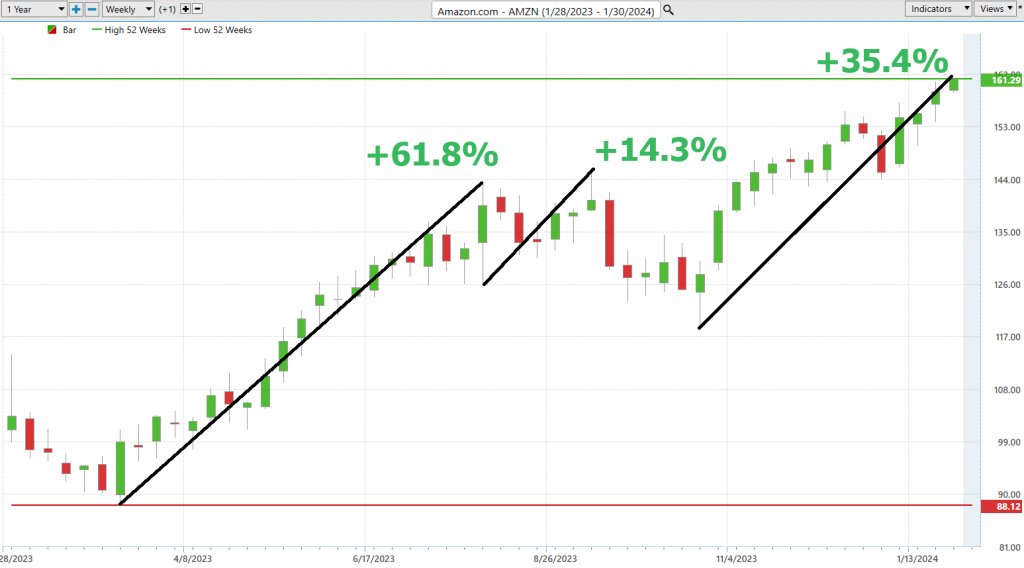
Followed by the worst-case analysis:
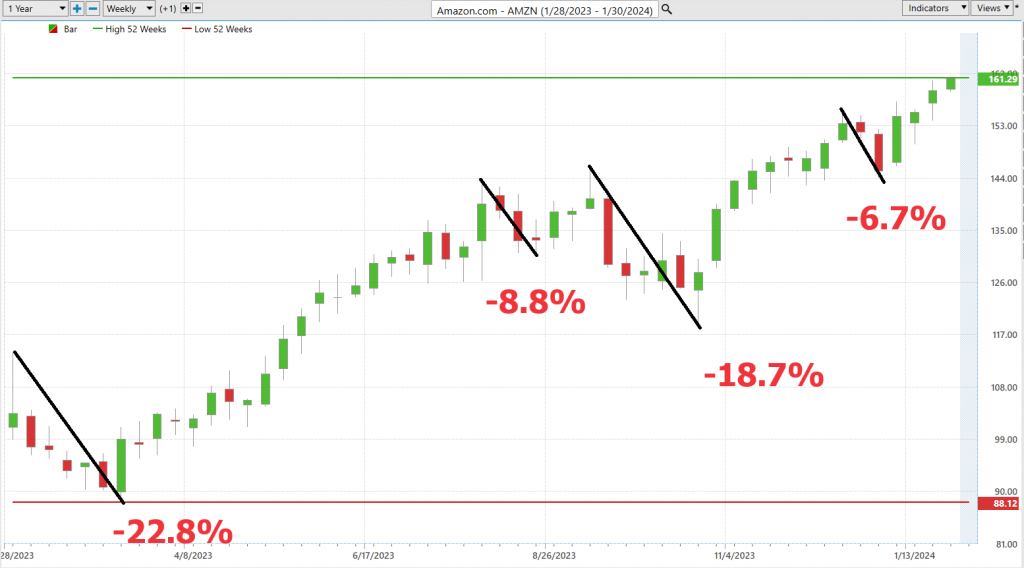
From this viewpoint, we can immediately discern the rewards and risks of the past year.
Next, compare $AMZN with the broader stock market indices. This comparative analysis allows us to promptly deduce that $AMZN has outshone the broader market by a substantial margin.
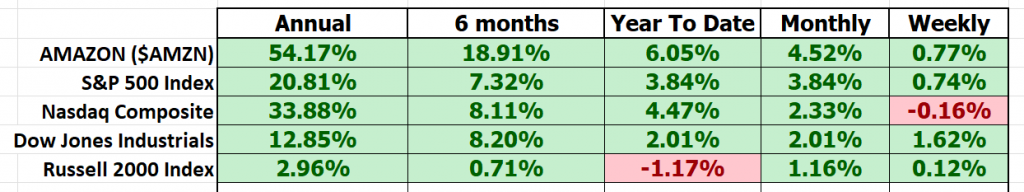
Clearly, $AMZN has performed exceptionally when compared to the broader market.
Last but certainly not least, we must assess the volatility of $AMZN in relation to the broader market. This can be accomplished by examining a key metric known as BETA. Beta measures a stock’s volatility concerning the overall market. A beta of 1 indicates that the stock tends to move in tandem with the market, while a beta greater than 1 implies higher volatility, and a beta less than 1 suggests lower volatility compared to the market.
Over the past five years, AMAZON ($AMZN) displays a beta of 1.16, signifying that it is 16% more volatile than the broader market. So, in $AMZN, we have a stock that has delivered triple the performance of the broader market while shouldering a 16% higher level of volatility. Quite the practical analysis through the financial seas, wouldn’t you agree?
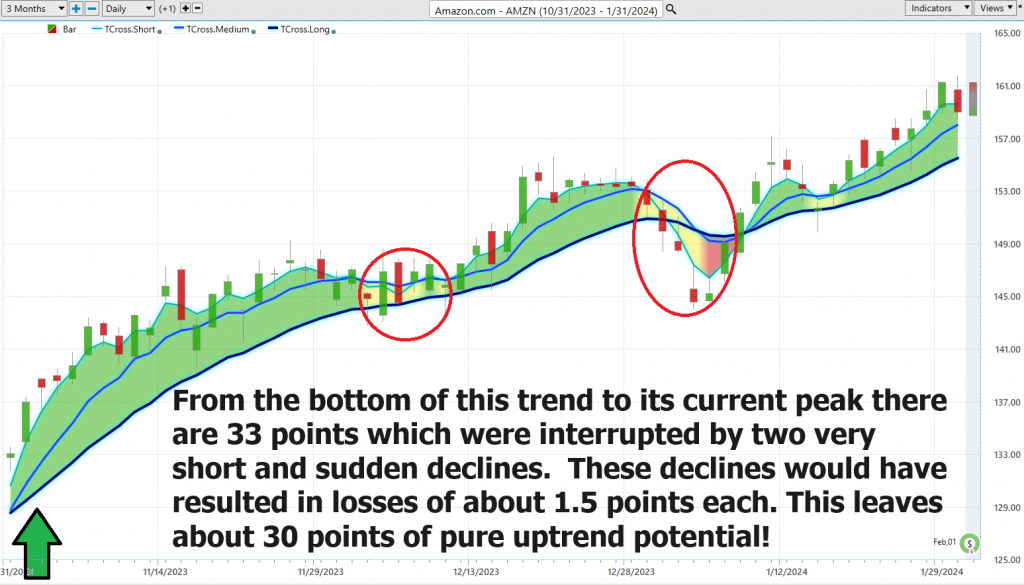
The VantagePoint A.I. Triple Cross Indicator
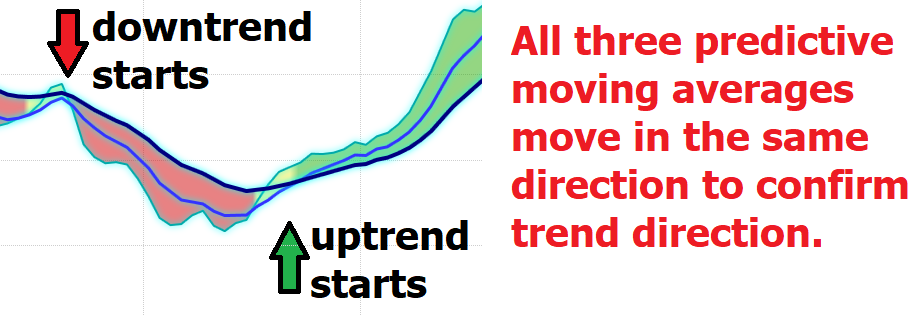
Active Power Traders love the groundbreaking tool that is reshaping market analysis as we know it – the Vantagepoint A.I. Triple Cross indicator. This is no ordinary indicator or oscillator; it represents a revolutionary approach employing not two, but three predictive moving averages, meticulously crafted to encapsulate short-term, medium-term, and long-term market trends.
Picture this: a trio of predictive moving averages, spanning 3 days, 8 days, and 18 days, each acting as a guiding light amidst the turbulence of the stock market. This trifecta is where the real magic unfolds. It’s a fusion of precision and foresight, providing traders with an unrivaled early warning system for detecting shifts in trends.
But the excitement doesn’t end there. The Triple Crossover operates as a master strategist, patient, and discerning. It bides its time until all three averages align, trimming away the noise and clutter of unnecessary trades. Consider the short-term average crossing the medium-term as a beacon illuminating the sky, hinting at potential changes in market dynamics. And when the medium-term crosses the long-term? That’s our cue – confirmation of a bona fide trend shift, a moment we’ve all eagerly awaited.
The brilliance of this system lies in its predictive prowess. It deftly navigates the market’s volatility, shielding you from premature entries and those misleading false signals.
To tie it all together, the Triple Crossover is not merely an indicator; it stands as your personal trading sentinel, diligently safeguarding your investments. It offers a heads-up, a gentle nudge when a trend is on the cusp of change, validated not once, not twice, but thrice, ensuring that the trades you execute are of the utmost quality.
Now, let’s shift our focus to something captivating – the Amazon stock chart spanning the past several months. Here is where theory transforms into practice, where we witness the Triple Crossover in full action.
Neural Network Indicator (Machine Learning)
The Neural Network Indicator residing at the chart’s foundation emerges as a formidable predictive instrument. In a manner reminiscent of a weather forecast for market trends, this indicator dons a verdant hue to herald strength and dons crimson to sound the alarm on weakness.
Now, our astute Power Traders, the vanguards forever ahead of the curve, do not merely rely on a solitary metric. Instead, they deftly wield a strategic fusion of the Neural Network Indicator and the Triple Cross indicator. This approach is not a mere quest for efficiency; it represents the pursuit of precision in pinpointing those pivotal entry and exit junctures in the market.
At its essence, the Neural Network is an artificial intelligence marvel, mirroring the intricacies of the human brain. Far from being stagnant, it constitutes a dynamic, self-evolving system ceaselessly digesting an expansive pool of data to hone its prognostications. It’s the juncture where the domains of advanced technology and finance merge, offering a nuanced comprehension of market patterns and facilitating decision-making.
Imagine an intricate web, where each node functions as an individual neuron, collaborating harmoniously to dissect and interpret incoming data. This elaborate network diligently scrutinizes, adapts, and learns, yielding outputs that bestow invaluable insights into market trends and prospective trading strategies.
In the realm of trading, where the passage of days can determine the distinction between profit and loss, neural networks serve as a veritable godsend. They reduce the specter of human error, elevate precision in decision-making, and keep traders one step ahead in the unrelenting cadence of the market.
Now, let’s shift our gaze to the case of Amazon ($AMZN). Employing the Vantagepoint A.I. Neural Index Indicator, Power Traders engage in a ‘double confirmation’ maneuver. They vigilantly monitor the predictive azure line’s upward trajectory, seeking validation from the Neural Network Indicator. It’s a delicate dance of data and anticipation, where the convergence of the Triple Cross and Neural Network signals heralds not just an opportunity but a high-probability trading strategy.
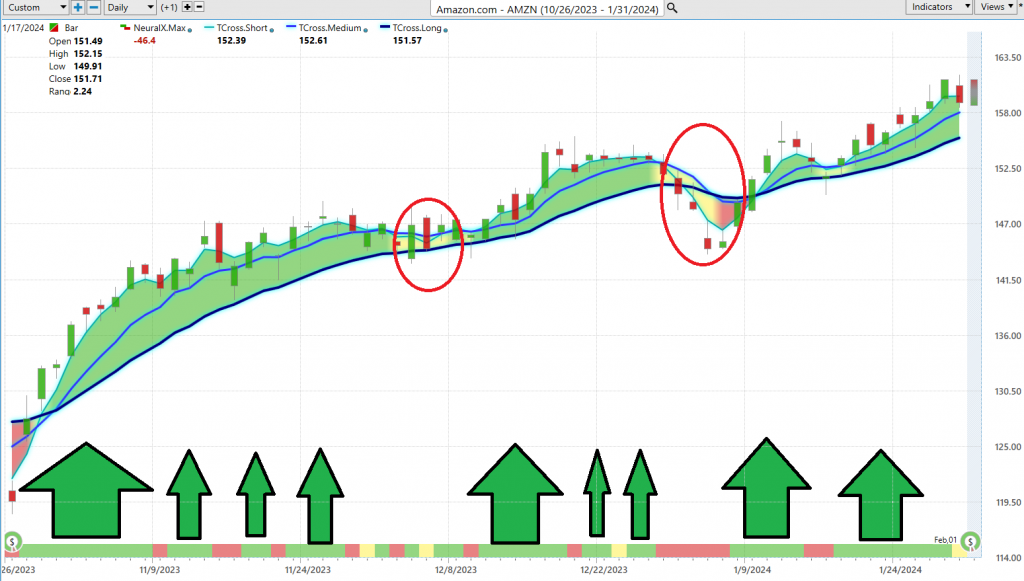
The Amazon ($AMZN) chart stands as a testament to the might of these tools. The Neural Net Indicator, working in concert with the Triple Cross, has consistently proffered moments of ‘double confirmation’ to our Power Traders, where the celestial bodies align to illuminate highly promising trading prospects.
It’s in these instances, where technology meets probability, that traders can truly capitalize on market trends, turning data into decisive action.
So, why should you care about neural networks? Because they are the secret sauce for traders. They are all about numbers and probabilities, and they can spot patterns that we humans might overlook.
VantagePoint Software Daily Price Range Prediction
In the trading world, it’s not just about the fancy analytics or the sophisticated tools; it’s about knowing when to make your move and when to hit the brakes. Timing, my friends, is not just everything; it’s the only thing that separates the winners from the rest. Look at Amazon’s ($AMZN) chart. Sure, you can measure those daily, weekly, and monthly trading ranges, like a gauge of market volatility. But here’s the kicker – knowing those ranges is just part of the equation. The real puzzle is figuring out those sweet spots for jumping in and bailing out.
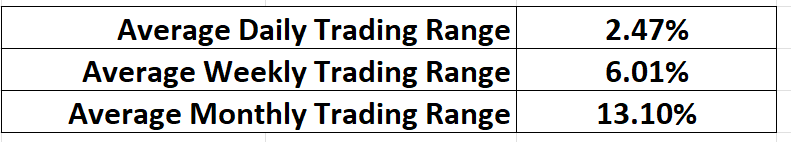
Now, turn your attention to that Daily Range Forecast chart. This is not your run-of-the-mill chart; it’s more like a playbook for short-term swing traders, revealing what to expect every trading day.
In the blink-and-you-miss-it world of trading, precision is not just a nice-to-have; it’s a must-have. That’s where Vantagepoint A.I.’s Daily Range Forecast takes center stage. We’re talking about a tool armed to the teeth with artificial intelligence, machine learning, and neural networks. It’s not just crunching numbers; it’s predicting the market’s rhythm for each trading session. Think of it as your personal GPS in the trading arena, guiding Power Traders to ride those market waves, spot those entry points, and execute their exits with the precision of a Swiss watch.
Remember, in trading, staying ahead of the curve isn’t just a strategic move; it’s an absolute necessity.
Intermarket Analysis
Intermarket analysis is like seeing how different pieces of a puzzle fit together. Financial markets are interconnected, and changes in one market can impact others. For example, if oil prices rise (a commodity), it can affect the stock prices of companies in the energy sector. Or, if interest rates go up (in the bond market), it may influence currency exchange rates.
Intermarket analysis involves looking at various indicators and patterns in different markets to make predictions. Traders use tools and charts to identify relationships between markets. They might analyze price movements, correlations, and trends. It’s about spotting trends and potential opportunities by understanding how one market’s activity can influence another.
Lou Mendelsohn, the founder of VantagePoint AI, played a significant role in developing software that uses intermarket analysis to better the decision making processes of traders. He recognized that traditional analysis methods often missed important connections between markets. Mendelsohn’s software uses advanced technologies like artificial intelligence and machine learning to process vast amounts of data from various markets. VantagePoint AI’s software takes in data from multiple financial markets, including stocks, currencies, and commodities. It then uses sophisticated algorithms to find hidden patterns and correlations that human traders might overlook. By doing so, the software provides forecasts and predictions about future price movements, helping traders make more informed decisions. The software developed by Lou Mendelsohn and his team enables traders to gain an edge by leveraging the power of intermarket analysis. It offers insights that can lead to better timing for buying or selling assets, reducing risks and increasing potential profits. It’s like having a tool that connects the financial dots for you, making trading decisions more data-driven and less reliant on gut feelings.
Intermarket analysis is not just some fancy jargon; it’s the bedrock of a comprehensive approach to dissecting the markets. It’s about recognizing that these financial markets are not solitary islands but part of an intricate web. It’s akin to connecting the dots, unveiling the subtle relationships and connections between these markets, a goldmine of insights into potential trends and opportunities. It’s about seeing the bigger picture, my friends, and leveraging that wisdom to make shrewd trading decisions, keeping you ahead of the curve in the dynamic realm of finance.
Think of it this way, just like the toppling of a single domino sets off a cascading chain reaction, intermarket analysis grants us the foresight to anticipate these domino effects in the financial markets. It equips us with the power to comprehend the broader canvas, deciphering how shifts in one market can send shockwaves across others, and how global happenings cast their shadows over our investments. It’s about staying informed, staying vigilant, and staying profitable in this ever-changing financial landscape.
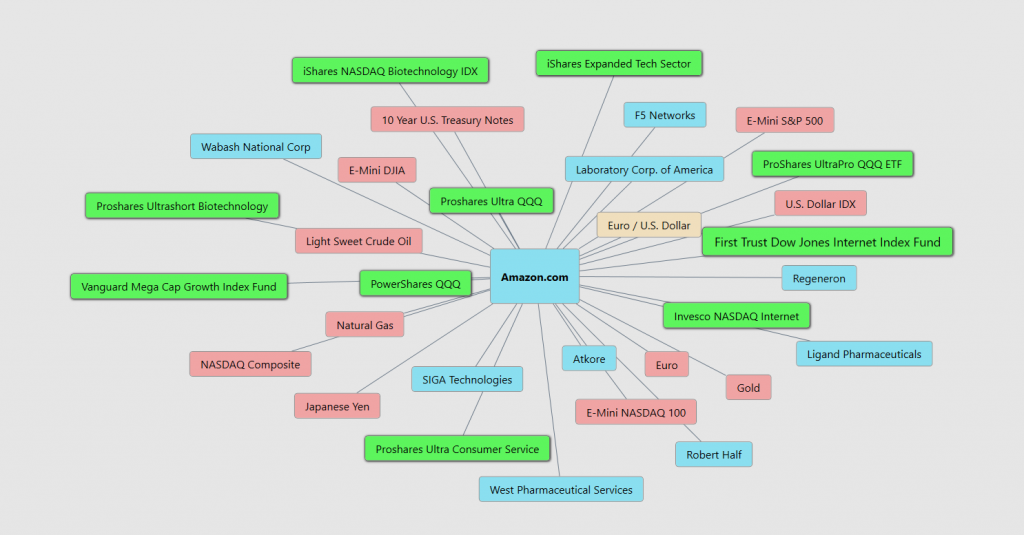
Here is the Intermarket Analysis for Amazon ($AMZN) which shows the 31 primary drivers of Amazon stock. Study it and you will also find some other gems that are worthy of your attention.
In a nutshell, intermarket analysis is about understanding how different financial markets relate to each other and using this knowledge to make smarter trading decisions. Lou Mendelsohn’s innovative software, VantagePoint AI, uses advanced technology to help traders uncover these connections and make more informed predictions about market movements. It’s a valuable tool in the world of finance, empowering traders to stay ahead of the curve.
Seasonal Analysis
Seasonal analysis in trading unveils the cyclical rhythms of financial markets, drawing from the cadence of the calendar and human behavior. It’s about spotting those reliable patterns that resurface like clockwork at specific times each year. Think of it as nature’s way of signaling change, much like leaves changing colors in the fall heralding the onset of winter.
These seasonal patterns serve as markers along the trading journey, molded by a diverse set of influences. Imagine the stock market responding to investor sentiment, economic cycles, and even weather conditions. For instance, it’s no accident that retail stocks tend to surge as the holiday shopping season approaches, mirroring the festive spirit that takes hold.
To tap into the potential of seasonal analysis, traders embark on a historical quest, sifting through past data to pinpoint these recurring trends. It’s akin to flipping through an old photo album, identifying which months brought sunshine and which brought rain. Once these patterns are unearthed, traders can devise strategies to ride the tide, akin to knowing when to grab an umbrella before the storm arrives.
However, here’s the crucial point: seasonal patterns are not certainties; they’re probabilities. They’re akin to weather forecasts, providing valuable guidance but not absolute control over market movements. Therefore, traders combine seasonal analysis with other tools in their toolbox.
Yet, while seasonal trading can be a rewarding strategy, it does have limitations. It’s like having a favorite ice cream flavor that’s only available during the summer – it works well when it’s in season but loses its charm in winter. Moreover, if everyone else has the same idea, it can lead to crowded trades, potentially diminishing profitability. So, while seasonality raises awareness of probabilities, it’s important to remember that trading remains dynamic, and adaptability is key.
Here is the seasonal chart for $AMZN.
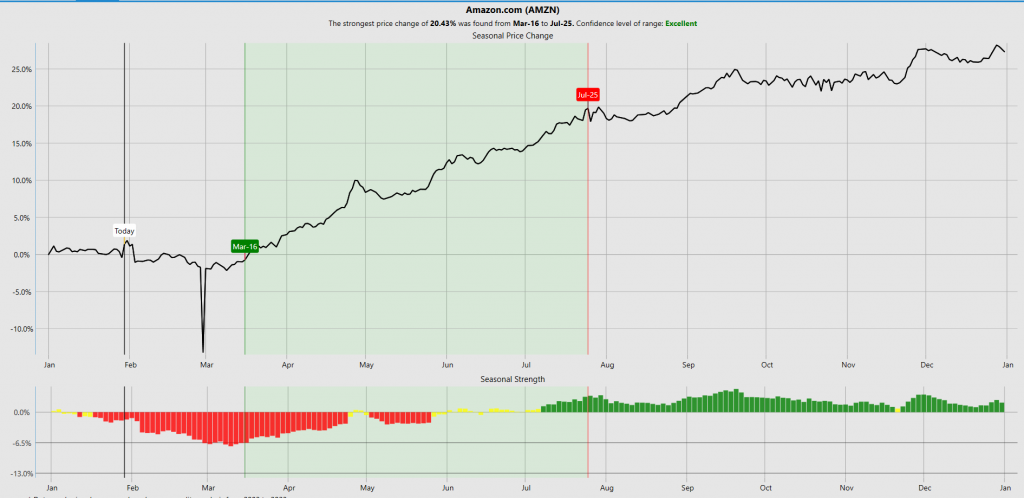
Observe how the seasonal chart provides the ideal time on the calendar for positioning your buy and sell and how the anticipated weakness arrives in late February.
Seasonal analysis should always be cross referenced with other indicatpors for better effectiveness. This approach can enhance your understanding of the market and contribute to better-informed investment decisions.
Our Suggestion
The next earnings call for $AMZN will occur on February 1, 2024.
Our favorite trading setup is finding stocks that are trading at 52 week highs and then turning over the navigation to the artificial intelligence. $AMZN fits this framework. We will continue to rely upon the VantagePoint A.I. daily range forecast for guidance.
In the spotlight this Thursday, February 1st Amazon, as the retail giant gears up to unveil its much-anticipated holiday quarter earnings for 2023. The Street is buzzing with anticipation, eyeing an earnings forecast of $0.80 per share. And that’s not all – expectations are set for a staggering record-breaking revenue, projected to hit the $166 billion mark, marking an impressive 11% surge from last year’s figures. It’s a moment of truth for Amazon, as these numbers could set the tone for the company’s performance trajectory in the new year.
For a more immediate perspective, in Q3 2023, Amazon reported earnings per share (EPS) of $0.96, which was a significant increase from $0.28 in the same quarter of the previous year. The company’s revenue for Q3 2023 was $143.08 billion, marking a 12.57% increase year over year.
These figures highlight Amazon’s robust performance and its potential for future growth.
We think 2024 holds huge promise and potential for $AMZN. In 2023 the largest singular decline during the entire year, peak to bottom was 22%. I suspect that 2024 will see more moderate declines based upon the very optimistic earnings and revenues outlook.
We advise that you practice good money management on all of your trades and that you follow the A.I. forecast for your trend anaysis to determine optimal entries and exits.
Let’s Be Careful Out There!
Remember, It’s Not Magic.
It’s Machine Learning.
Disclaimer: THERE IS A HIGH DEGREE OF RISK INVOLVED IN TRADING. IT IS NOT PRUDENT OR ADVISABLE TO MAKE TRADING DECISIONS THAT ARE BEYOND YOUR FINANCIAL MEANS OR INVOLVE TRADING CAPITAL THAT YOU ARE NOT WILLING AND CAPABLE OF LOSING.
VANTAGEPOINT’S MARKETING CAMPAIGNS, OF ANY KIND, DO NOT CONSTITUTE TRADING ADVICE OR AN ENDORSEMENT OR RECOMMENDATION BY VANTAGEPOINT AI OR ANY ASSOCIATED AFFILIATES OF ANY TRADING METHODS, PROGRAMS, SYSTEMS OR ROUTINES. VANTAGEPOINT’S PERSONNEL ARE NOT LICENSED BROKERS OR ADVISORS AND DO NOT OFFER TRADING ADVICE.


