





This week’s AI stock spotlight is Talen Energy Corporation ($TLN)
Talen Energy has one of the more unusual corporate histories in the American power industry. The company was formed in 2015, when PPL Corporation spun off its competitive generation business and combined it with power plants owned by the private equity firm Riverstone Holdings. Riverstone took the company private in December 2016. In May 2022, after hedging losses drained its liquidity, Talen filed for Chapter 11 protection to restructure roughly $4.5 billion of debt. It emerged in May 2023 under the ownership of its former unsecured creditors, traded over the counter under the symbol TLNE, and returned to a major exchange on July 10, 2024, when its shares began trading on the Nasdaq Global Select Market as TLN. In a little over three years, a bankrupt power producer became one of the market’s most closely watched ways to own the electricity demand of artificial intelligence.
The business model is that of an independent power producer. Talen does not own a regulated utility with an approved rate of return. It owns and operates power plants and earns money in wholesale markets in three main ways: by generating and delivering energy, by being paid to keep capacity available for the grid, and by providing ancillary services that keep the system stable. Most of that activity happens inside PJM Interconnection, the largest grid operator in the United States, which serves 13 states and the District of Columbia. Headquartered in Houston, Texas and led by Chief Executive Officer Mac McFarland, Talen employs about 1,880 people and owns approximately 15.7 gigawatts of generating capacity, including 2.2 gigawatts of nuclear power and a large fleet of dispatchable natural gas plants. In fiscal 2025, energy and other revenues were $2.141 billion and capacity revenues were $485 million.
The crown jewel is the Susquehanna nuclear plant in Pennsylvania, and Susquehanna is what makes Talen different. In June 2025, Talen signed a power purchase agreement to supply Amazon Web Services with 1,920 megawatts of carbon-free electricity from Susquehanna through 2042, ramping up over several years and reaching full volume no later than 2032. The two companies also agreed to explore new small modular reactors and uprates at the plant. The contract replaced an earlier co-located arrangement after the Federal Energy Regulatory Commission rejected an expanded interconnection agreement for the adjacent data center campus in November 2024, and it now serves the campus through a front-of-the-meter structure. Talen’s closest public competitors are Constellation Energy, Vistra and NRG Energy, all of which own large fleets in competitive markets. Constellation has the larger nuclear fleet. Talen’s differentiation is concentration: a smaller company with a single large nuclear plant under a long-term hyperscaler contract, a gas fleet that has nearly doubled in size in eight months, and a share count that management is shrinking aggressively.
On October 6, 2026, Talen closed at $373.11, up 12.43% on the day, after gapping open at $349.15 and trading as high as $377.99. The catalyst was not Talen’s own news. Google signed a 20-year power purchase agreement with Constellation Energy to fund 890 megawatts of uprates across 11 reactors in the PJM region, plus a separate 15-year supply agreement for another 2,700 megawatts, and the market immediately repriced every power producer that supplies the same grid. That is why the stock is relevant this week. Three weeks ago, on September 15, Talen touched its 52-week low of $279.77. It has now gained 33.4% from that low in 15 trading sessions. The question for traders is whether this is the start of a recovery toward the stock’s old highs or a sympathy rally built on someone else’s contract.
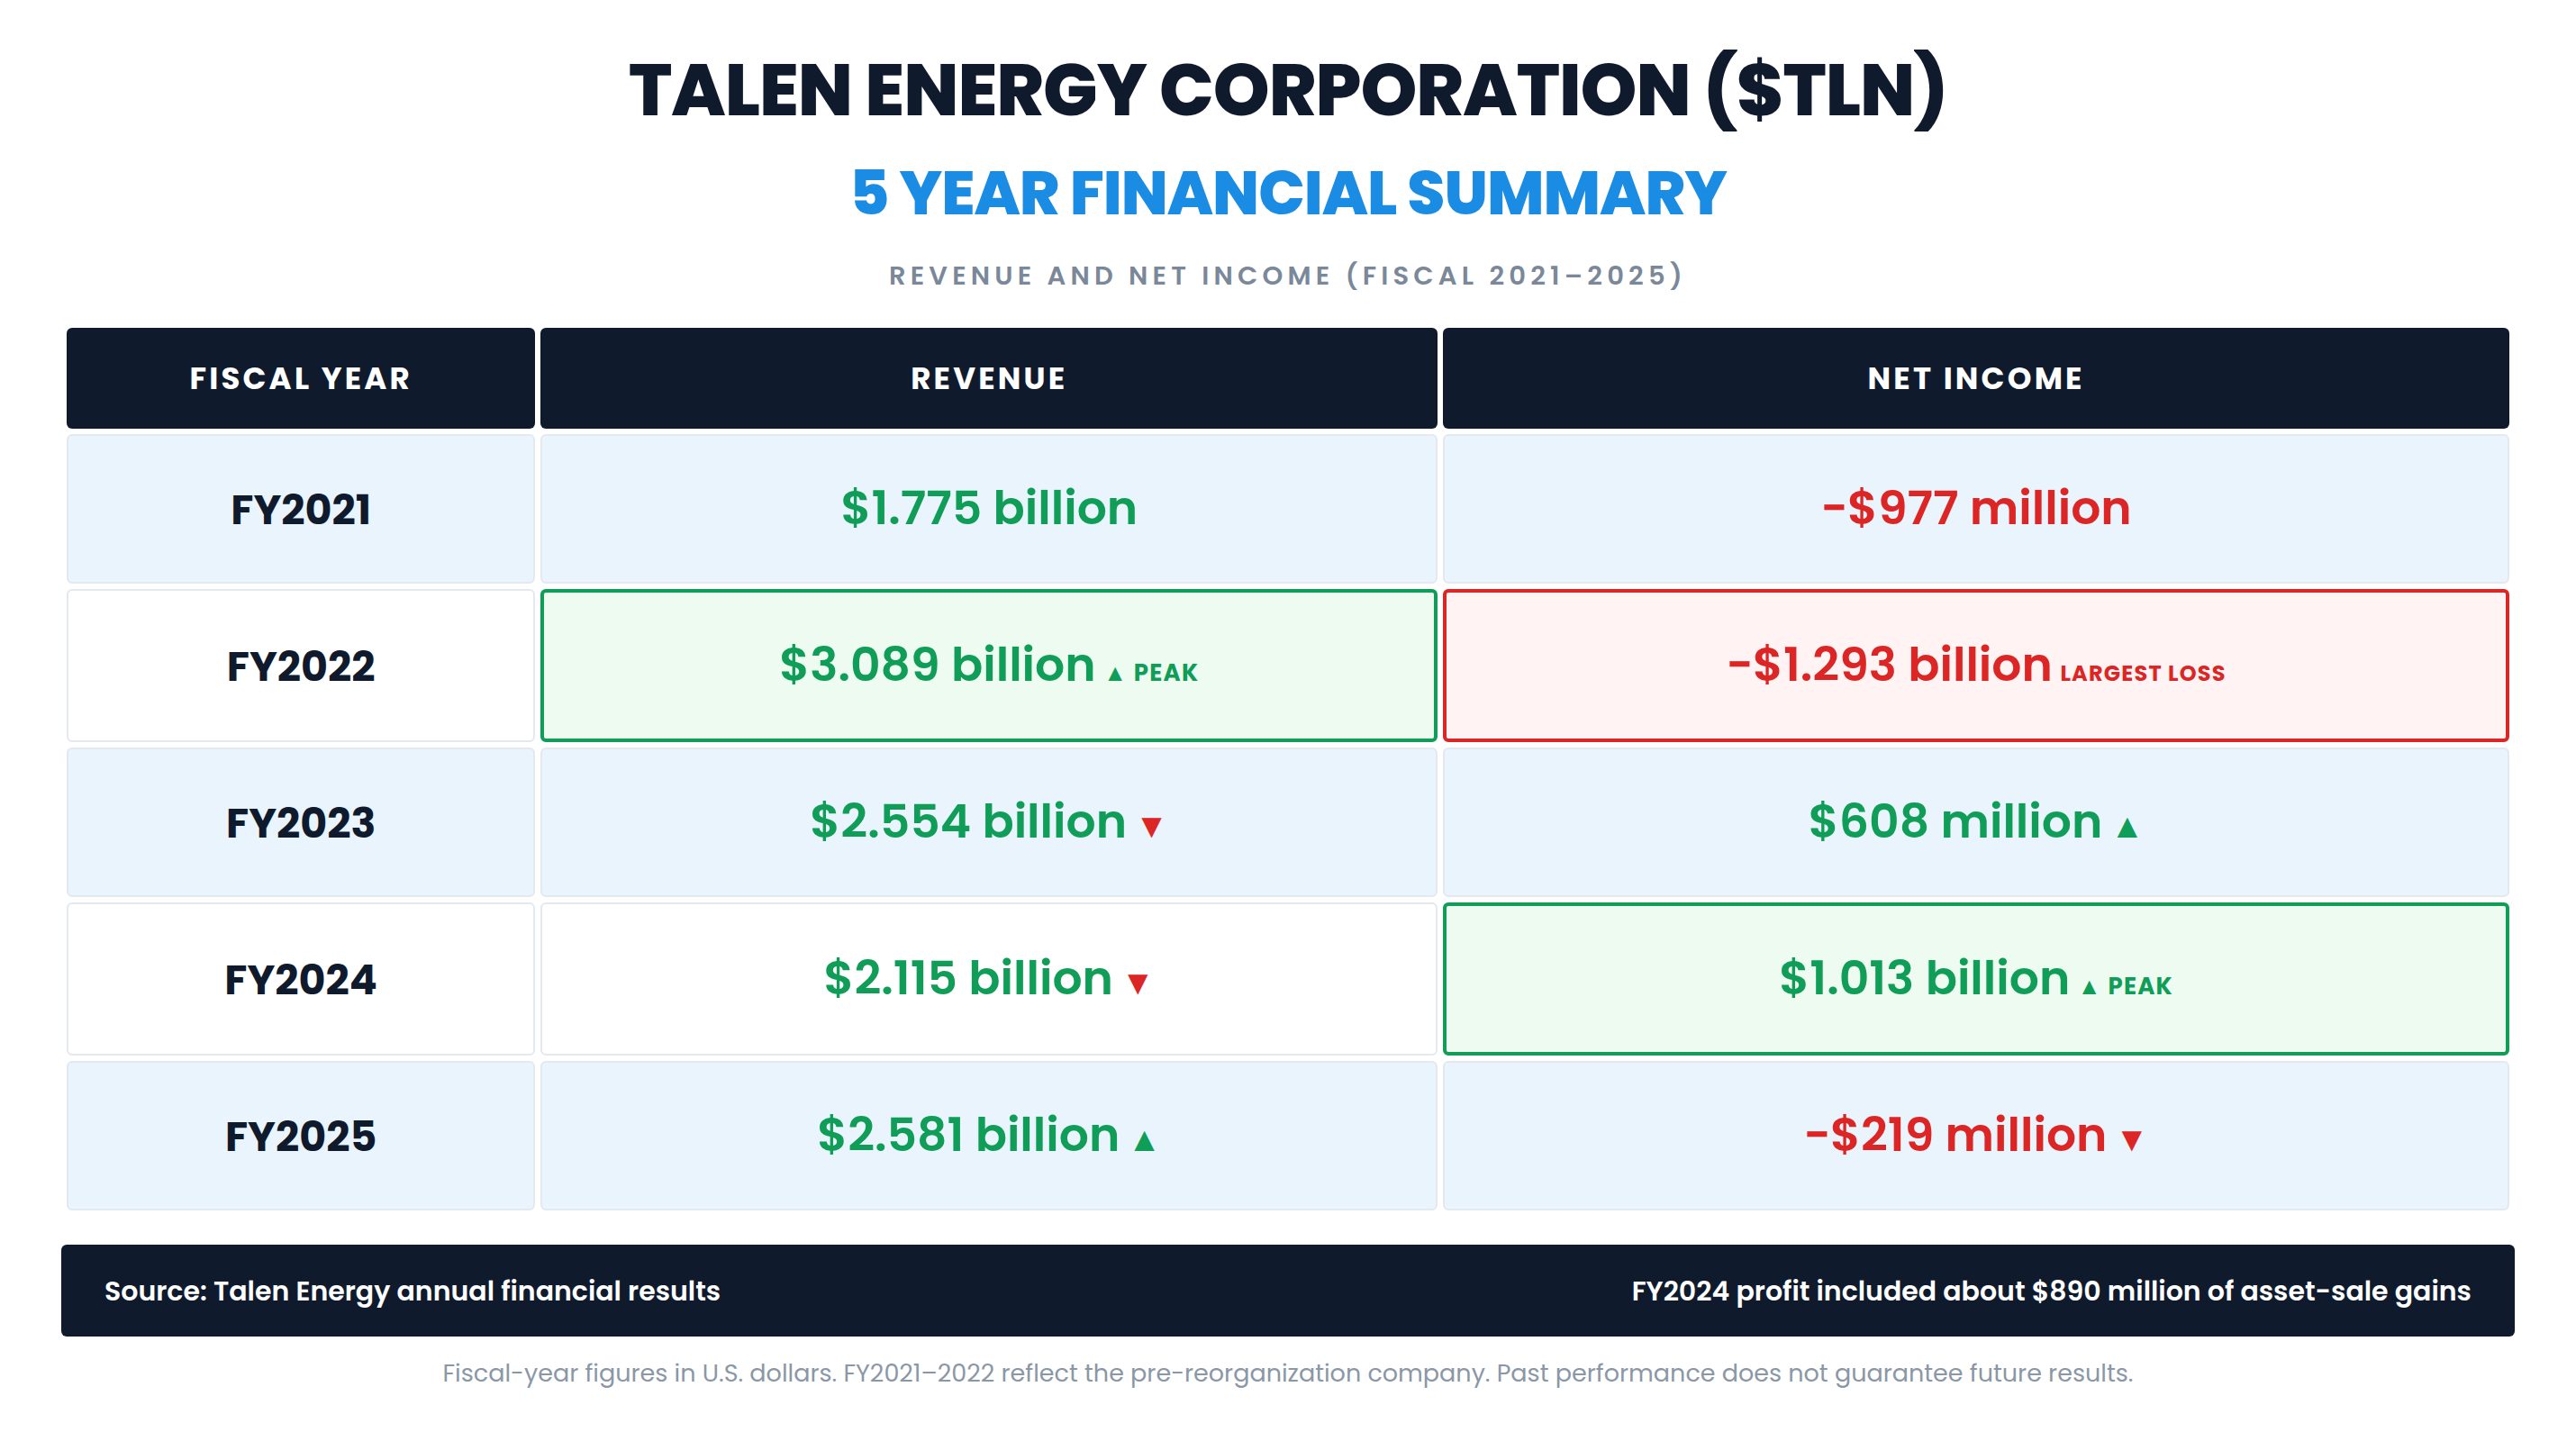
The annual record has to be read with Talen’s restructuring in mind. Fiscal 2021 and 2022 reflect the company before it emerged from bankruptcy, and fiscal 2023 is the year it emerged. Revenue was $1.775 billion in fiscal 2021, jumped to a peak of $3.089 billion in 2022 as wholesale power prices spiked, fell to $2.554 billion in 2023 and $2.115 billion in 2024, and then recovered to $2.581 billion in 2025, a 22.0% increase as the company added generation. Fiscal 2025 revenue is still 16.4% below the 2022 peak.
Net income is more volatile still. Talen lost $977 million in 2021 and $1.293 billion in 2022, the largest loss in the table and the year of the bankruptcy filing. It earned $608 million in 2023 and $1.013 billion in 2024, its best year. Then it lost $219 million in 2025, or $4.79 per diluted share, compared with diluted earnings of $17.67 per share in 2024. The distinction matters. The 2024 profit included about $890 million of gains on the sale of the Cumulus data center campus and the company’s ERCOT portfolio, and the 2025 loss included a $501 million fourth-quarter charge tied to a change in accounting for certain stock-based awards. Neither number describes the ongoing earning power of the plants.
Here is the number the annual table hides. In the same year Talen reported a $219 million GAAP loss, it produced $1.035 billion of Adjusted EBITDA and $524 million of Adjusted Free Cash Flow. For 2026, management now guides to Adjusted EBITDA of $2.025 billion to $2.225 billion and Adjusted Free Cash Flow of $1.200 billion to $1.350 billion. The free cash flow midpoint of $1.275 billion is about 7.2% of the company’s market value of roughly $17.6 billion, based on 47.3 million shares outstanding at the October 6 close. The GAAP table describes a company that swings between large profits and large losses. The cash flow guidance describes a company whose earnings base has roughly doubled in a single year.
The second quarter of 2026, reported on August 5, 2026, shows both sides of that story. Revenue was $959 million, up 111.2% from $454 million a year earlier, and total generation nearly doubled to 14.1 terawatt-hours from 7.3 terawatt-hours, with the fleet’s capacity factor rising to 47.6% from 31.8%. Adjusted EBITDA was $374 million and Adjusted Free Cash Flow was $212 million. On a GAAP basis, however, Talen reported a net loss attributable to stockholders of $92 million, or $2.00 per diluted share, compared with net income of $72 million a year earlier. The company attributed the swing primarily to unrealized losses on derivative instruments and higher interest expense, which more than offset higher capacity and energy revenues. Normalized earnings per share of $2.37 fell short of the $3.39 consensus estimate. During the quarter, Talen repurchased 550,000 shares for approximately $200 million.
The growth in the quarter came from acquisitions. In November 2025, Talen closed the Freedom and Guernsey acquisitions, adding about 2.8 gigawatts of efficient gas-fired generation for $3.8 billion in cash funded with new debt. On June 15, 2026, it closed the Cornerstone Acquisition, acquiring the 1,120-megawatt Lawrenceburg Power Plant in Indiana and the 875-megawatt Waterford Energy Center and 456-megawatt Darby Generating Station in Ohio from Energy Capital Partners for $3.45 billion, paid with approximately $2.55 billion in cash and 2.4 million Talen shares. What the quarter proves is that the expanded fleet is producing more electricity and more cash. What it does not prove is that the GAAP numbers will settle down, because a hedged power producer will keep reporting large unrealized gains and losses as power and gas prices move.
Traders are really asking two questions now. First, is the cash flow from a much larger fleet strong enough to carry the debt taken on to build it, while the company is also spending billions retiring shares? Second, will Talen land data center contracts of its own, or will it keep trading on deals signed by its competitors?
The bullish evidence is concrete. On August 5, 2026, management raised its 2026 guidance and said it was increasing its 2027 and 2028 outlooks. In PJM’s base residual auction for the June 2028 through May 2029 delivery year, Talen cleared 10,180 megawatts at the $325 per megawatt-day ceiling price, which equates to approximately $1.208 billion of capacity revenue for that year. On September 29, 2026, Talen entered into $1.5 billion of accelerated share repurchase agreements, initially receiving approximately 4.0 million shares, and raised its total repurchase authorization to $3.0 billion through December 31, 2028. The company expects the accelerated repurchases to retire more than 10% of its outstanding shares by the end of the first quarter of 2027. Since the start of 2024 and through the second quarter of 2026, Talen had already repurchased about 15 million shares for approximately $2.3 billion. Liquidity stood at approximately $1.9 billion at July 31, 2026, and management is targeting net leverage below 3.5 times Adjusted EBITDA. The company is also developing a pipeline of roughly 4 gigawatts of land and data center contracting options.
That is also where the market could be wrong. The main risk case has three parts. The first is the balance sheet. Talen spent roughly $6.35 billion in cash on acquisitions in eight months, funded largely with debt, and then committed $1.5 billion to accelerated repurchases. To support that, on September 25, 2026, it transferred the rights to approximately $1.5 billion of future PJM capacity revenue for the 2027/2028 and 2028/2029 delivery years to a third party. That is cash pulled forward, not new cash, and it leaves Talen responsible for performance at the plants. The second is policy. PJM’s last three auctions all cleared at the ceiling price, which is good for revenue but also means the upside is capped by a negotiated price collar, and the rules governing large data center loads remain under active regulatory review. The third is the stock’s own behavior. From its June 18, 2026 high of $449.84, Talen fell 37.8% to its September 15 low, through a raised guidance report. The biggest risk is that the story is wearing a convincing disguise: a rally triggered by a contract Talen did not sign can look like company-specific strength until the sector cools.
The near-term catalyst calendar is clear. Third-quarter 2026 results are scheduled for November 4, 2026 after the market close, with consensus earnings estimated at $2.29 per share. Traders should watch for updated 2026 guidance, the first full quarter of contribution from the Cornerstone plants, progress on the accelerated share repurchase, which is expected to settle no later than the first quarter of 2027, and any announcement from the 4-gigawatt data center pipeline. Leadership is also changing. On September 29, the board named President Terry Nutt, Talen’s former Chief Financial Officer, as the next Chief Executive Officer effective January 1, 2027. Mac McFarland will remain CEO through December 31, 2026 and then serve as a senior advisor until his retirement in March 2027. Talen does not pay a regular dividend, and no special dividend was paid over the past twelve months. Its capital return comes entirely through share repurchases.
This setup suits swing traders and active position traders who are comfortable with a high-volatility stock that can move 10% or more in a single session on sector news. Over the past 20 sessions, Talen’s average daily range has been 4.26% of its closing price. It is less suitable for traders who need stable GAAP earnings, low leverage or income, and for anyone who treats a power producer as a sleepy utility. The same shares fell 21.6% in one session on January 27, 2025, and have suffered three separate declines of more than 30% since early 2025.
The early-warning signal to watch is the October 6 gap. The stock opened at $349.15, above the prior close of $331.87, and never traded below its opening price all day. If the sympathy rally is genuine, that gap should hold. A close back below $331.87 would tell you that the market has stopped treating the Google and Constellation contract as a reason to own Talen, and that the stock is back to trading on its own fundamentals, which recently included a quarterly earnings miss.
So the picture heading into this week is a company with a dramatically larger cash flow base, an aggressive capital return program and a stock that has just snapped back hard from a deep decline. The trend says stay interested. The volatility says stay alert. With that in mind, here is what the professional analyst community currently expects.
Wall Street Analysts Annual Forecasts
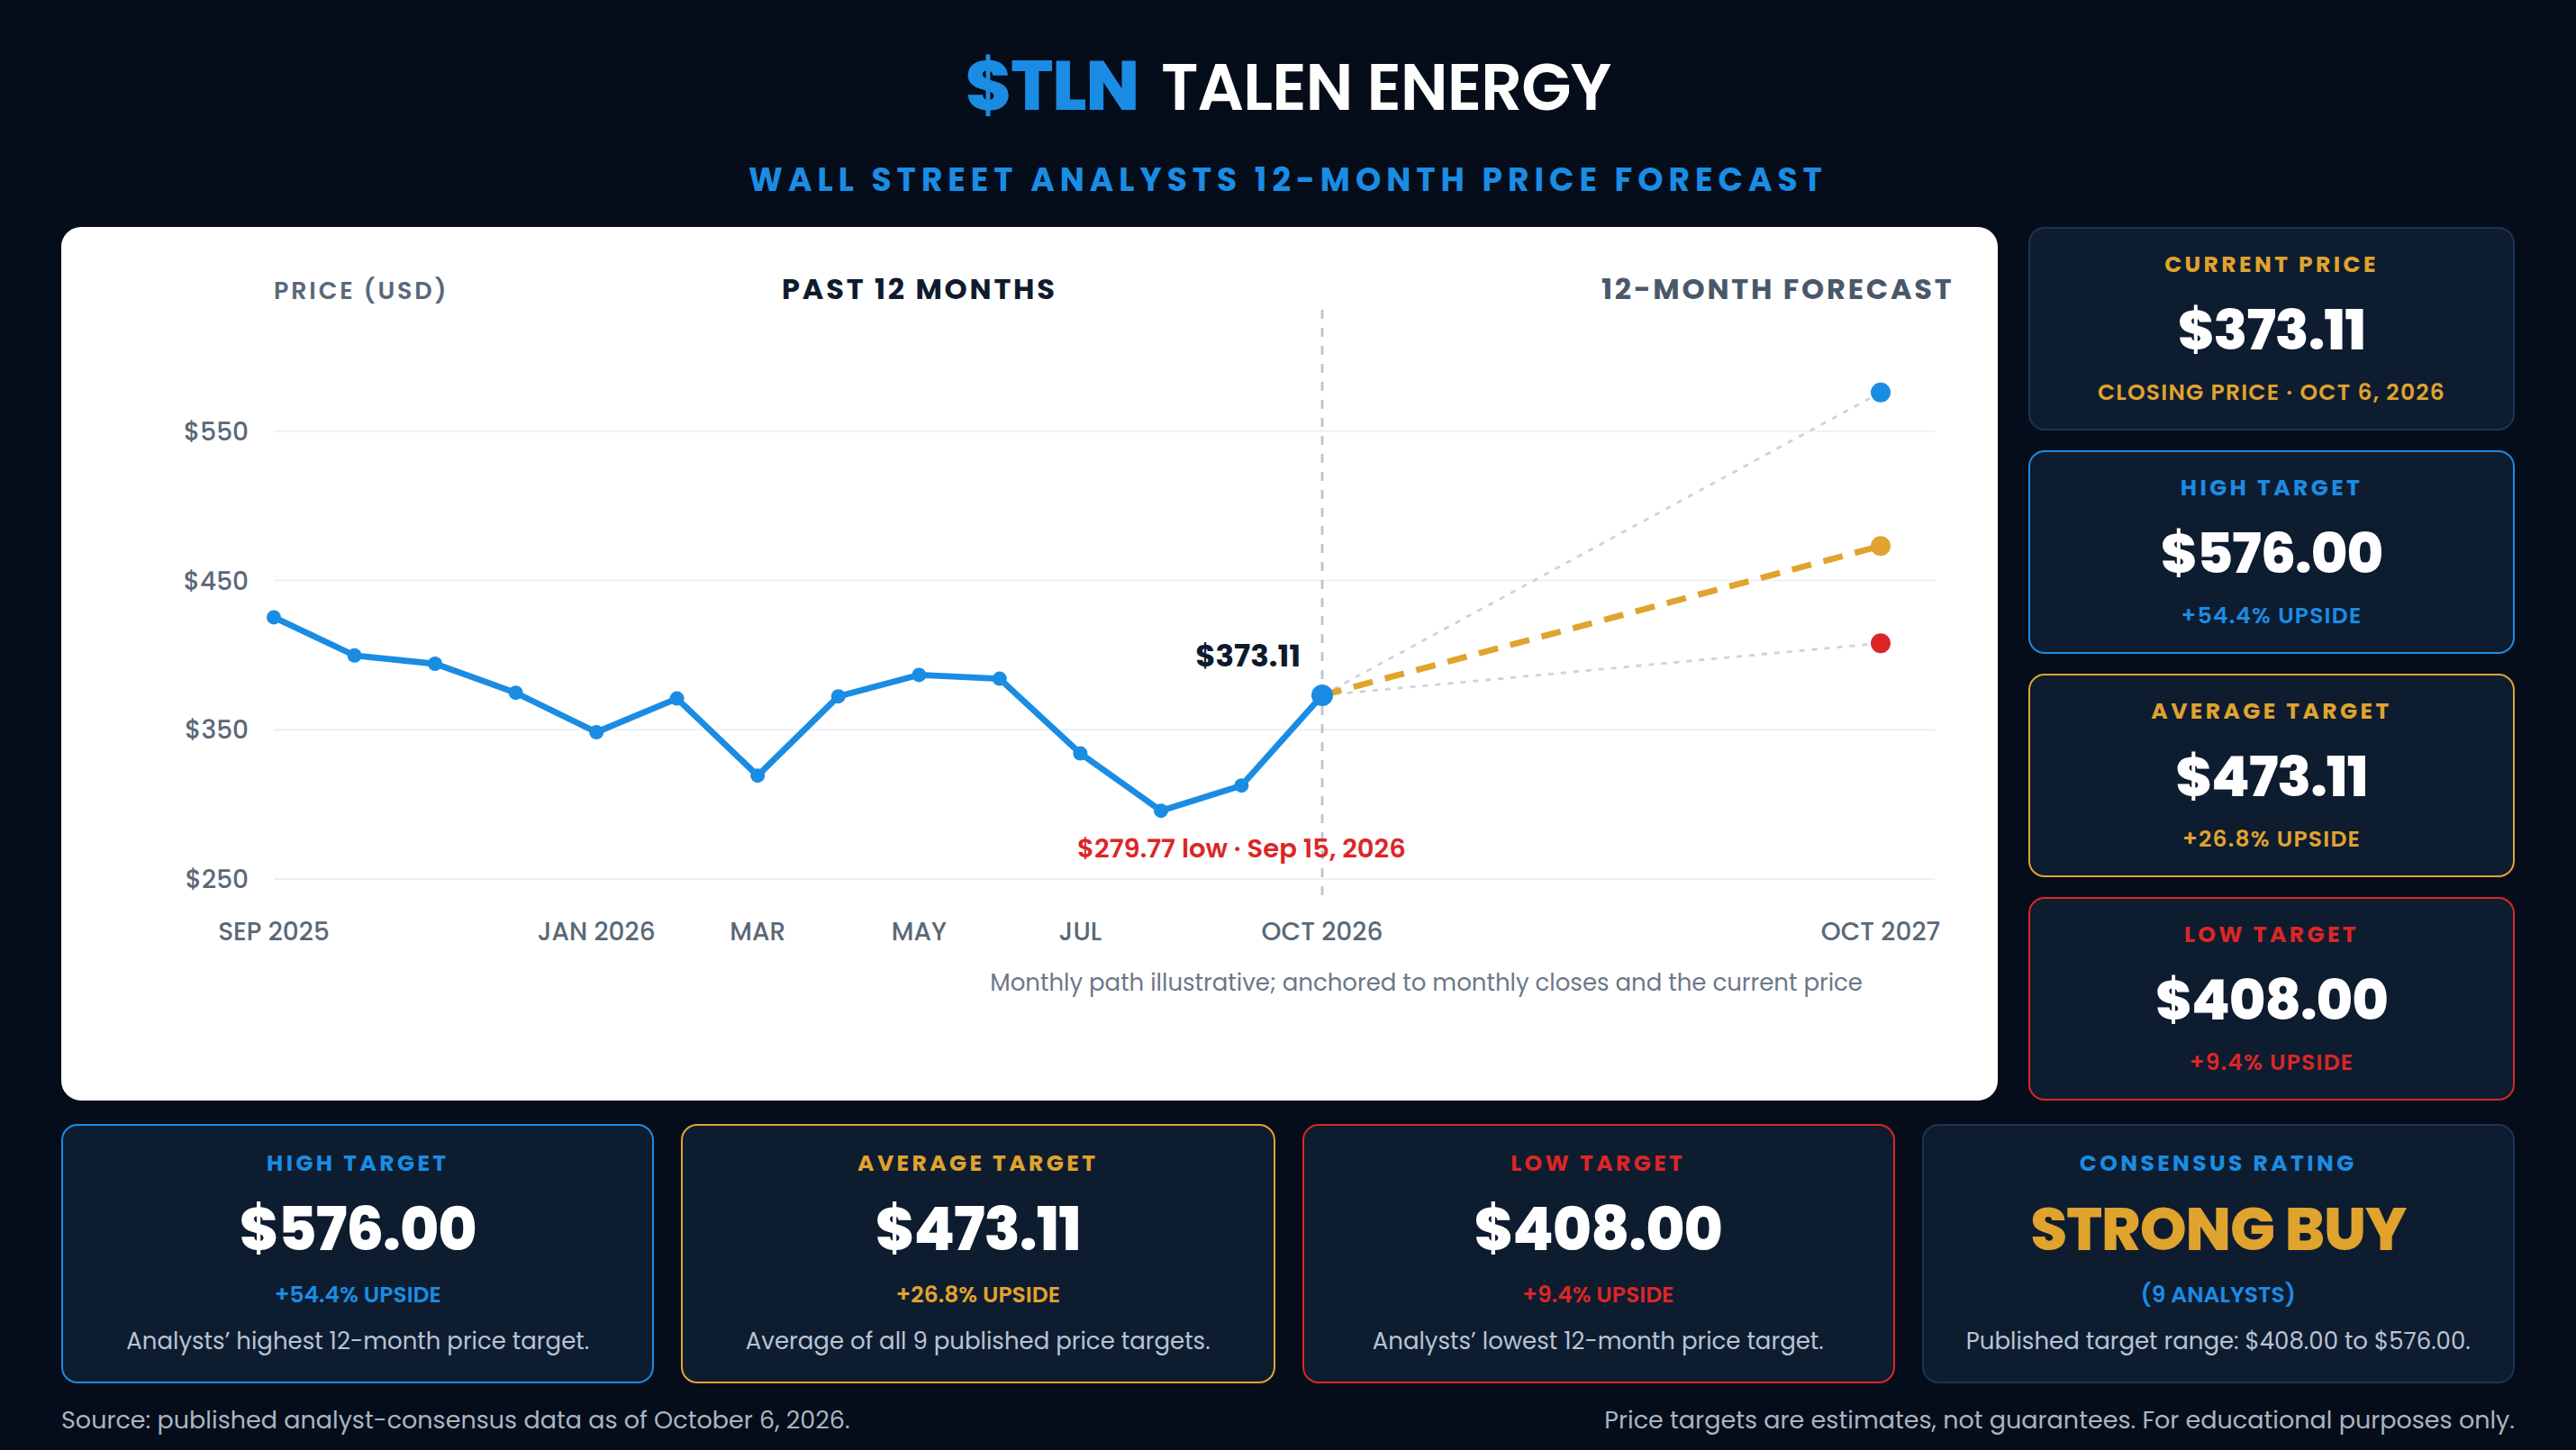
Nine analysts are included in the published consensus for Talen Energy, and the consensus rating is strongly bullish, with seven bullish ratings, two neutral ratings and no bearish ratings. The average 12-month price target is $473.11, the median target is $470.00, the high target is $576.00 and the low target is $408.00.
Measured against the October 6, 2026 close of $373.11, the average target implies a 26.80% gain. The median target implies a 25.97% gain. The high target implies a 54.38% gain. Unusually, even the low target sits above the current price, implying a 9.35% gain. The spread between the high and low target is $168.00, which is 45.03% of the current share price.
The revision trail adds important context. The $576 high target comes from Melius Research and was set on September 10, 2025, more than a year ago, when the stock traded above $400. The most recent update came from Morgan Stanley, which maintained its Overweight rating and raised its target to $514 from $503 on September 18, 2026, while the stock was near its lows. Wells Fargo raised its target to $501 from $482 on August 6, 2026, the day after second-quarter results. The low target of $408 belongs to Barclays, which holds an Overweight rating and trimmed its target from $411 on July 28, 2026. The two neutral ratings come from Jefferies, which cut its target to $422 from $453 on July 20, 2026 with a Hold rating, and Scotiabank, which holds a Sector Perform rating with a $470 target.
The practical takeaway is that the analyst community remained constructive through the entire summer decline, and that every published target sits above the current price. That deserves to be read carefully rather than celebrated. The stock fell nearly 38% while those targets stayed high, which shows that analyst targets can be far from the market for long stretches. With only nine analysts in the consensus, and with one of the targets more than a year old, a few revisions could move the average noticeably. Price targets are estimates of what a security might be worth over a twelve-month horizon under a specific set of assumptions. They are not certainties.
52-Week High and Low Boundaries Analysis
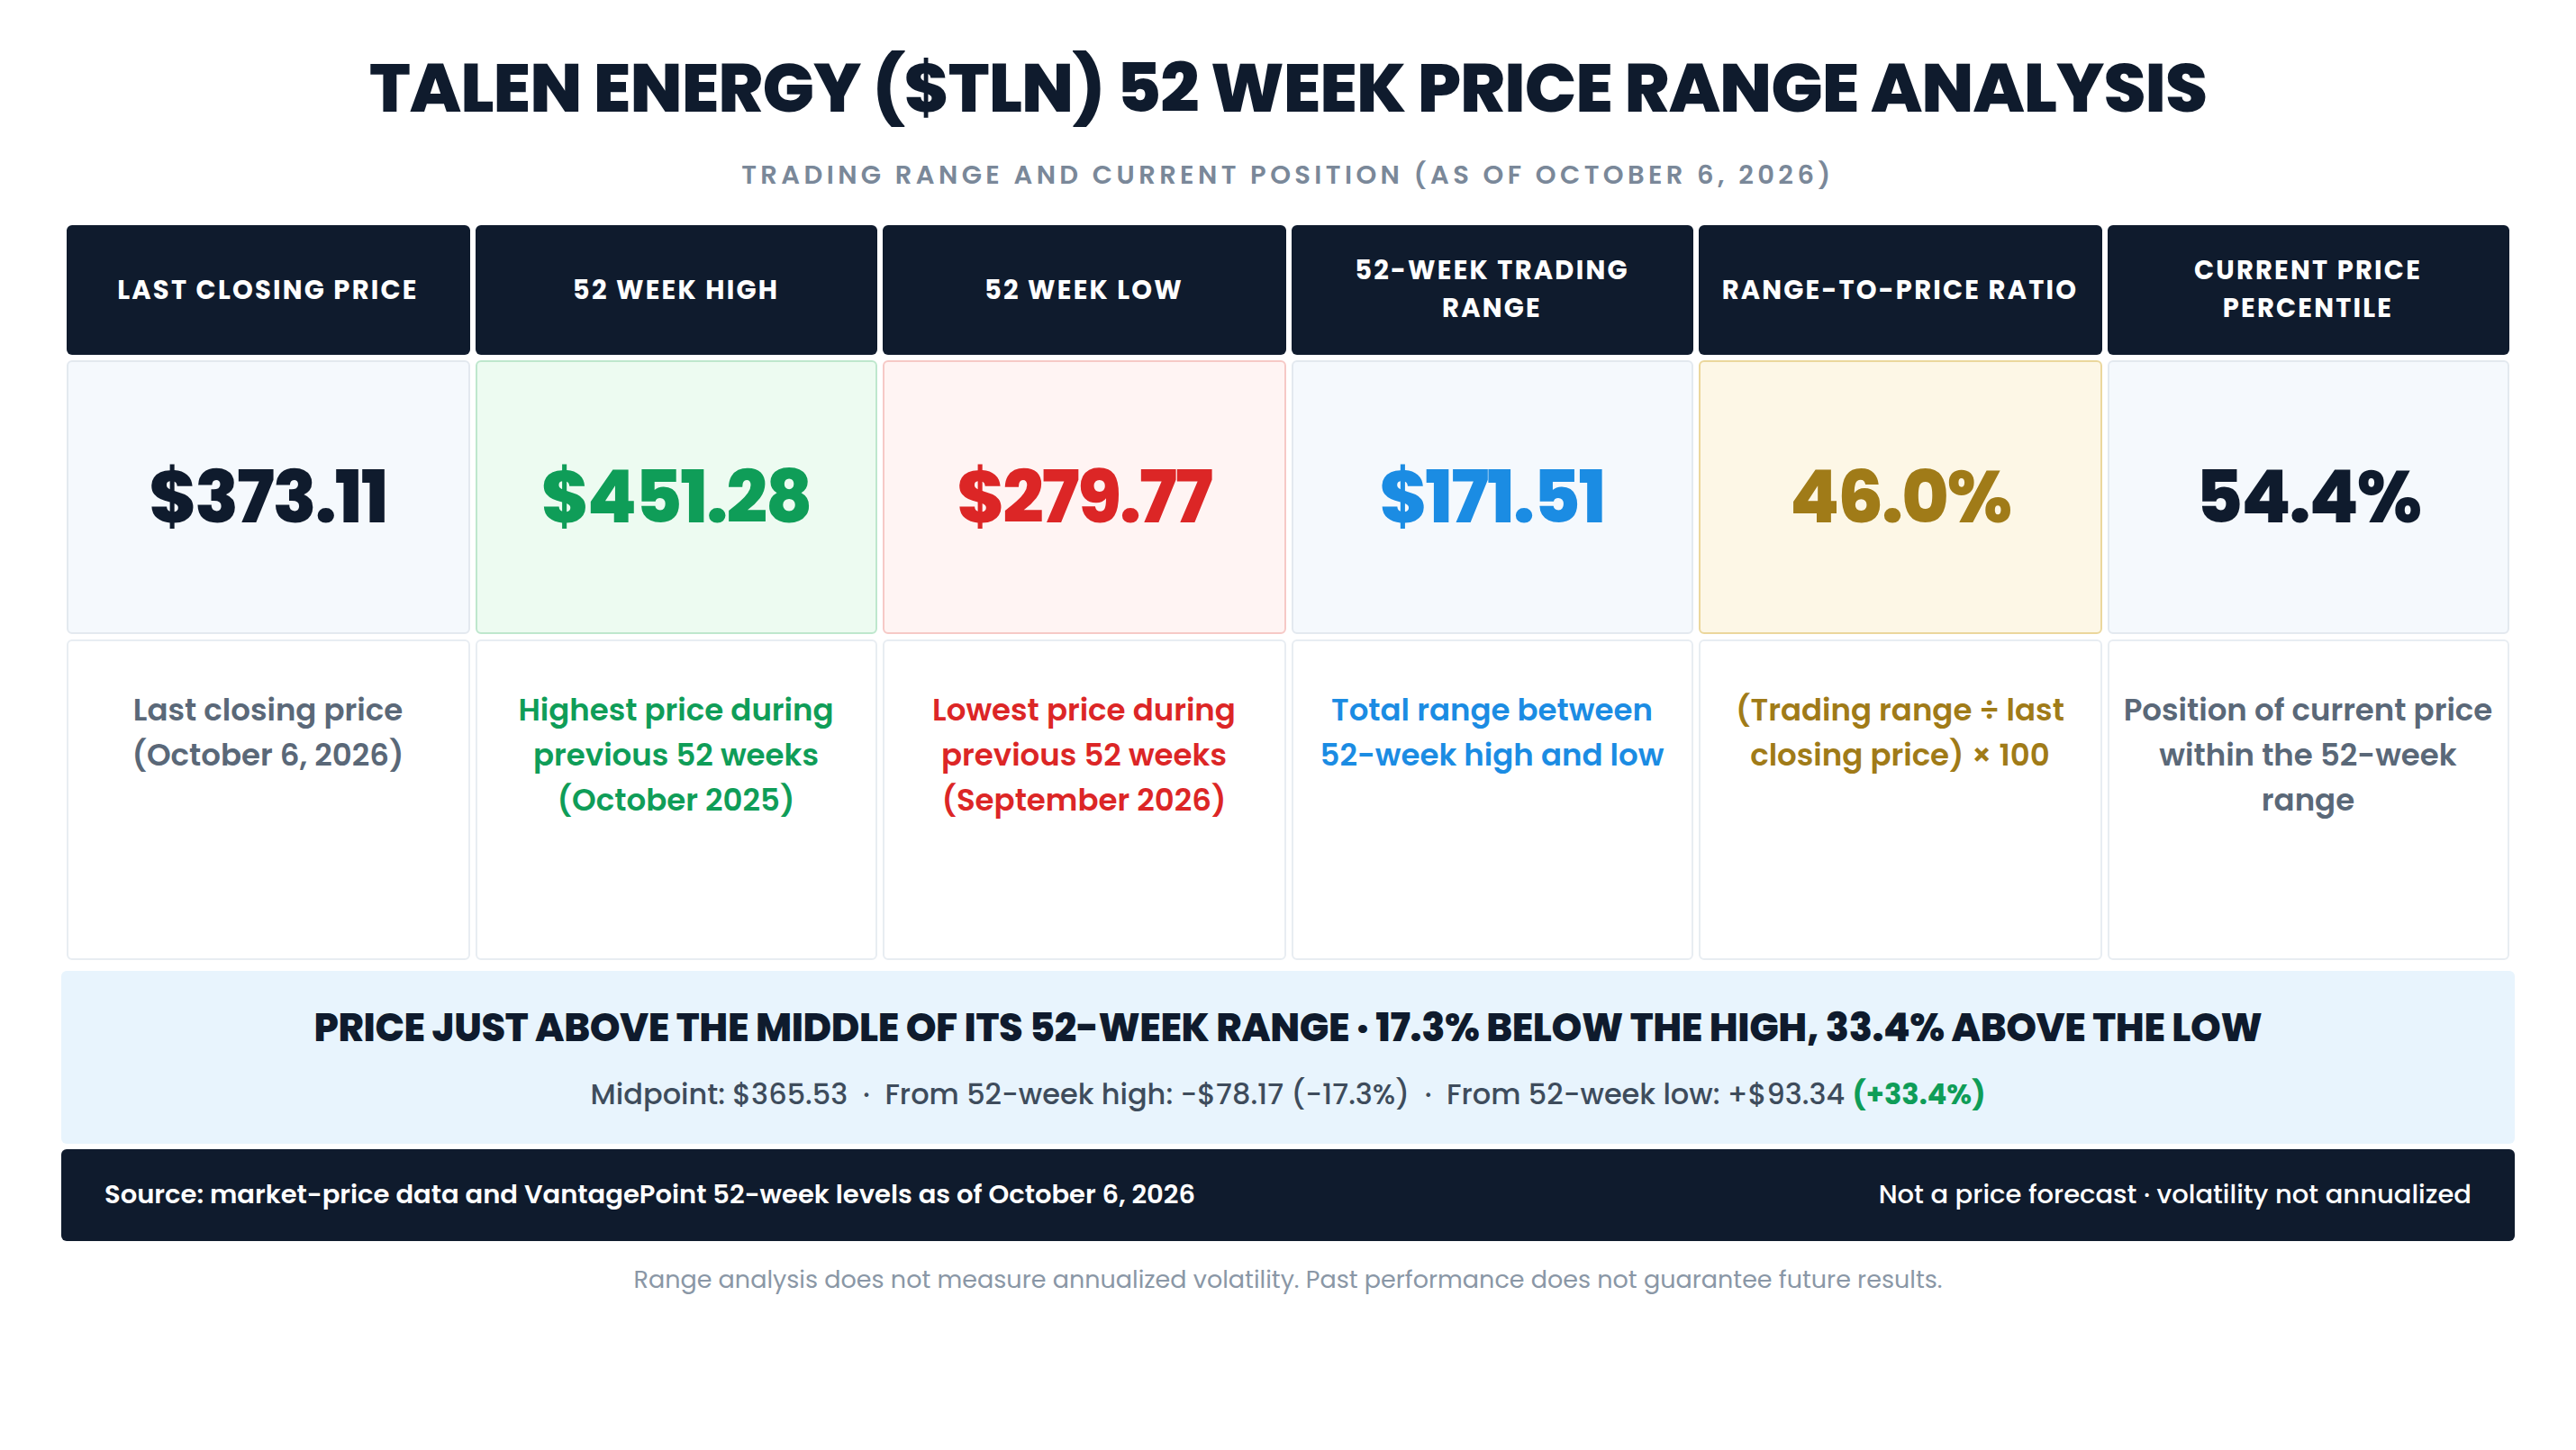
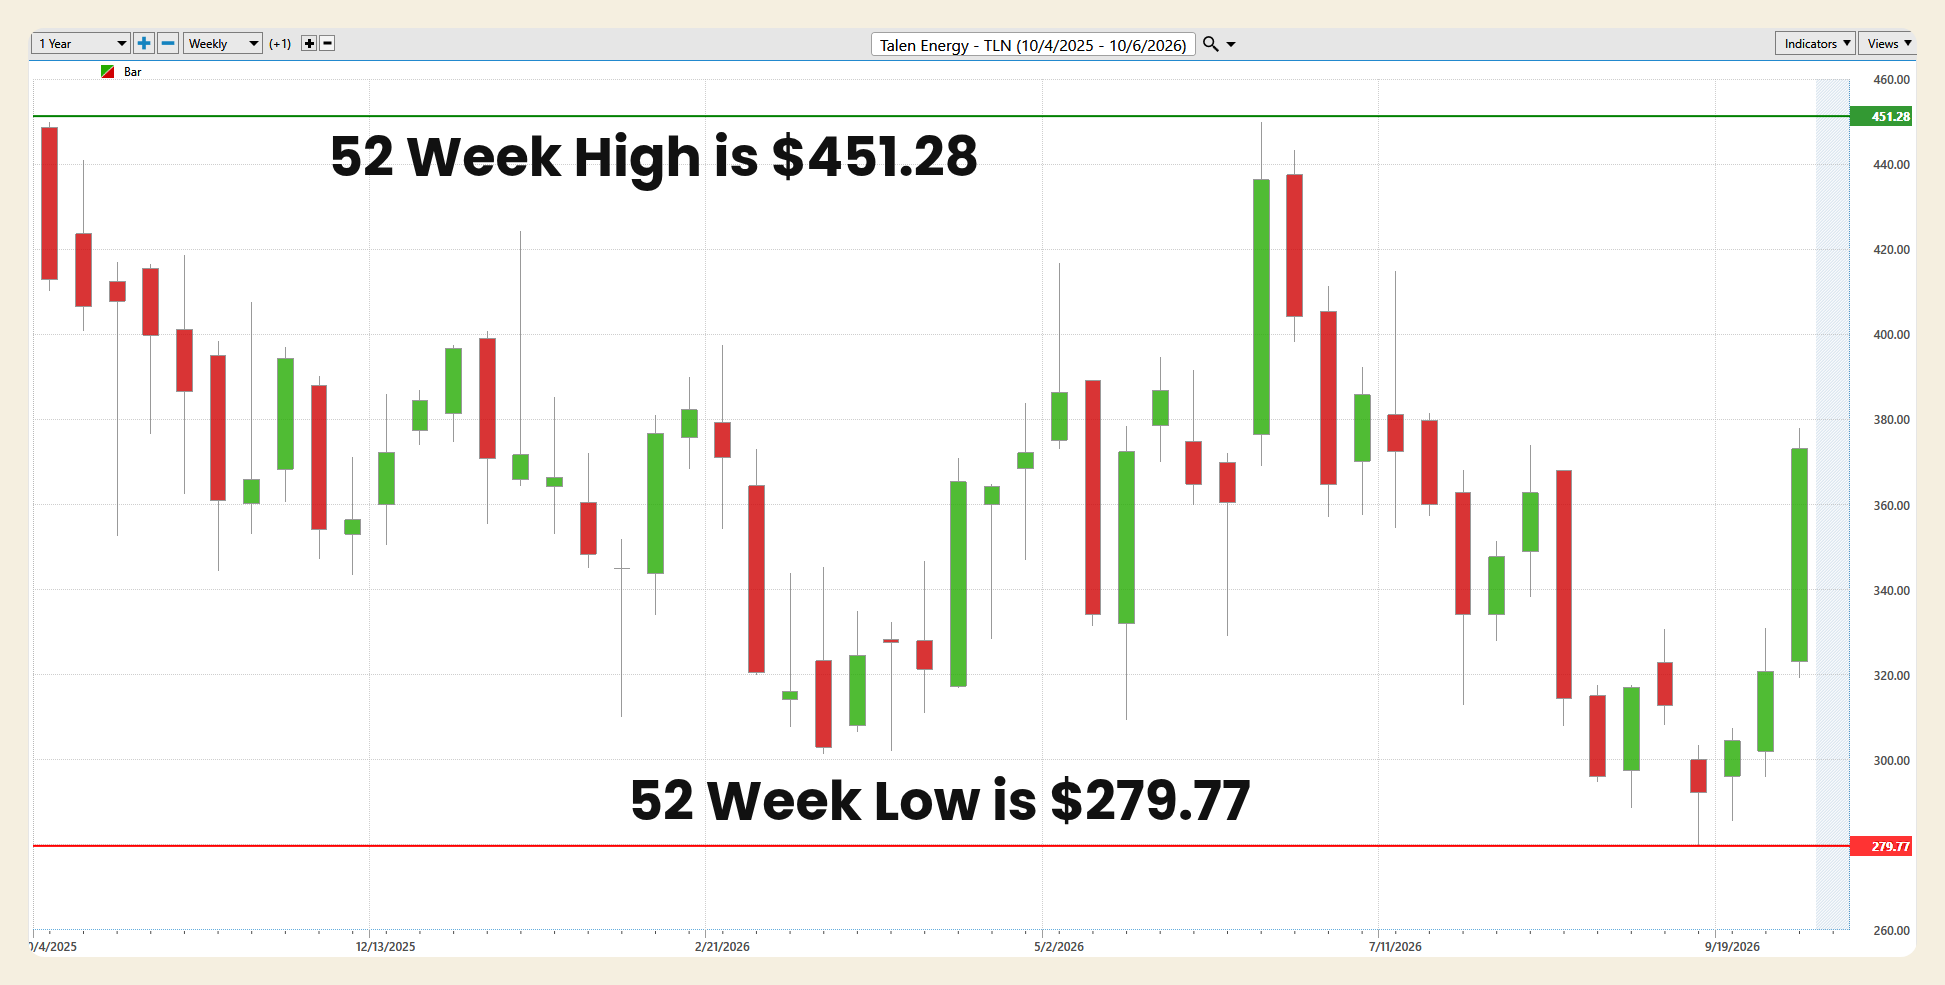
Based on VantagePoint’s 52-week boundaries, Talen’s 52-week high is $451.28, set on October 3, 2025, and its 52-week low is $279.77, set on September 15, 2026.
The 52-week trading range is $171.51. Divided by the $373.11 closing price, that produces a range-to-price ratio of 45.97%, meaning the distance between the year’s high and low is nearly half of today’s share price. The stock sits at the 54.42nd percentile of its range. The midpoint of the range is $365.53, and the October 6 close is 2.07% above that midpoint. The stock needs a 20.95% gain to reach the 52-week high, and it is 33.36% above the 52-week low.
That combination is the defining feature of the setup. One week ago, Talen was trading in the bottom fifth of its range. A single session lifted it back above the midpoint. The stock now sits almost exactly between the October 2025 high and the September 2026 low, and the next move will decide whether this becomes a recovery toward the upper half of the range or a failed rally back toward the lower half. Because the $451.28 high was set at the start of the trailing window, it will roll out of the 52-week calculation within days, and the reference high will reset to the June 18, 2026 peak of $449.84. That changes the arithmetic only slightly.
Best-Case/Worst-Case Analysis
The best-case historical moves are extraordinary. From its August 2, 2024 intraday low of $98.50, a few weeks after its Nasdaq listing, Talen rose 358.2% to its October 3, 2025 high of $451.28. From its March 10, 2025 low of $158.08, it rose 185.5% to that same high. Inside the current window, the stock gained 49.2% from the March 20, 2026 low of $301.45 to the June 18, 2026 high of $449.84, and it has gained 33.4% from the September 15, 2026 low to the October 6 close in just 15 trading sessions.
The worst-case historical moves are just as large. From a January 23, 2025 high of $258.03, Talen fell 38.7% to its March 10, 2025 low of $158.08, a stretch that included a 21.6% single-day decline on January 27, 2025. From the October 3, 2025 high of $451.28, it fell 33.2% to the March 20, 2026 low of $301.45. Most recently, from the June 18, 2026 high of $449.84, it fell 37.8% to the September 15, 2026 low of $279.77.
Historical gains are not forecasts, and historical losses are not predictions. What these figures show is that this stock has real capacity for movement in both directions, with three declines of more than 30% in under two years even as the company’s cash flow grew. Position sizing and an exit plan matter here more than in almost any other name we have covered this season.
The condition that keeps the bull case alive is a higher low followed by follow-through: the stock holding the October 6 gap above $331.87, building a base above the September 15 low and pushing back toward the $386 to $397 area where it stalled in the spring, while third-quarter results confirm the raised guidance. The change of character that would invalidate the thesis is a close back below the September 15 low of $279.77. That would extend the summer’s sequence of lower highs and lower lows, and it would mean the market had rejected both the raised guidance and the sector rally.
The upside opportunity is substantial but contingent.
Relative Strength Comparison
Talen Energy has lagged all four major U.S. benchmarks over the longer periods measured and has sharply outperformed all four over the shorter ones. All figures are price returns.
Returns are measured to the October 6, 2026 close from these starting closes: 1 Year, October 6, 2025; YTD, December 31, 2025; 3 Months, July 6, 2026; 1 Month, September 4, 2026; 1 Week, September 29, 2026. Nasdaq refers to the Nasdaq Composite and Dow refers to the Dow Jones Industrial Average.
This is a laggard-to-leader reversal pattern. Over the past year, Talen trailed the S&P 500 by about 29 percentage points and the Nasdaq by more than 33 points. Year to date it is essentially flat while every index is up between 7% and 19%. Over three months it is slightly negative, although it has still beaten the Dow and the Russell 2000. Then the picture flips. Over the past month, Talen rose 17.70% while the S&P 500 gained 1.30% and the Dow and Russell 2000 both fell. Over the past week, it rose 18.51% while no index gained more than 3%.
It is worth being precise about what this kind of relative strength means. Short-window leadership after a long stretch of underperformance is often a snapback from oversold levels, and much of the past week’s gain came in a single session driven by sector news. Snapbacks can turn into new trends, but they need confirmation over weeks, not days. Outperformance is not permanence, and a one-week lead built on a competitor’s announcement is the least durable kind.
VantagePoint AI Predictive Blue Line
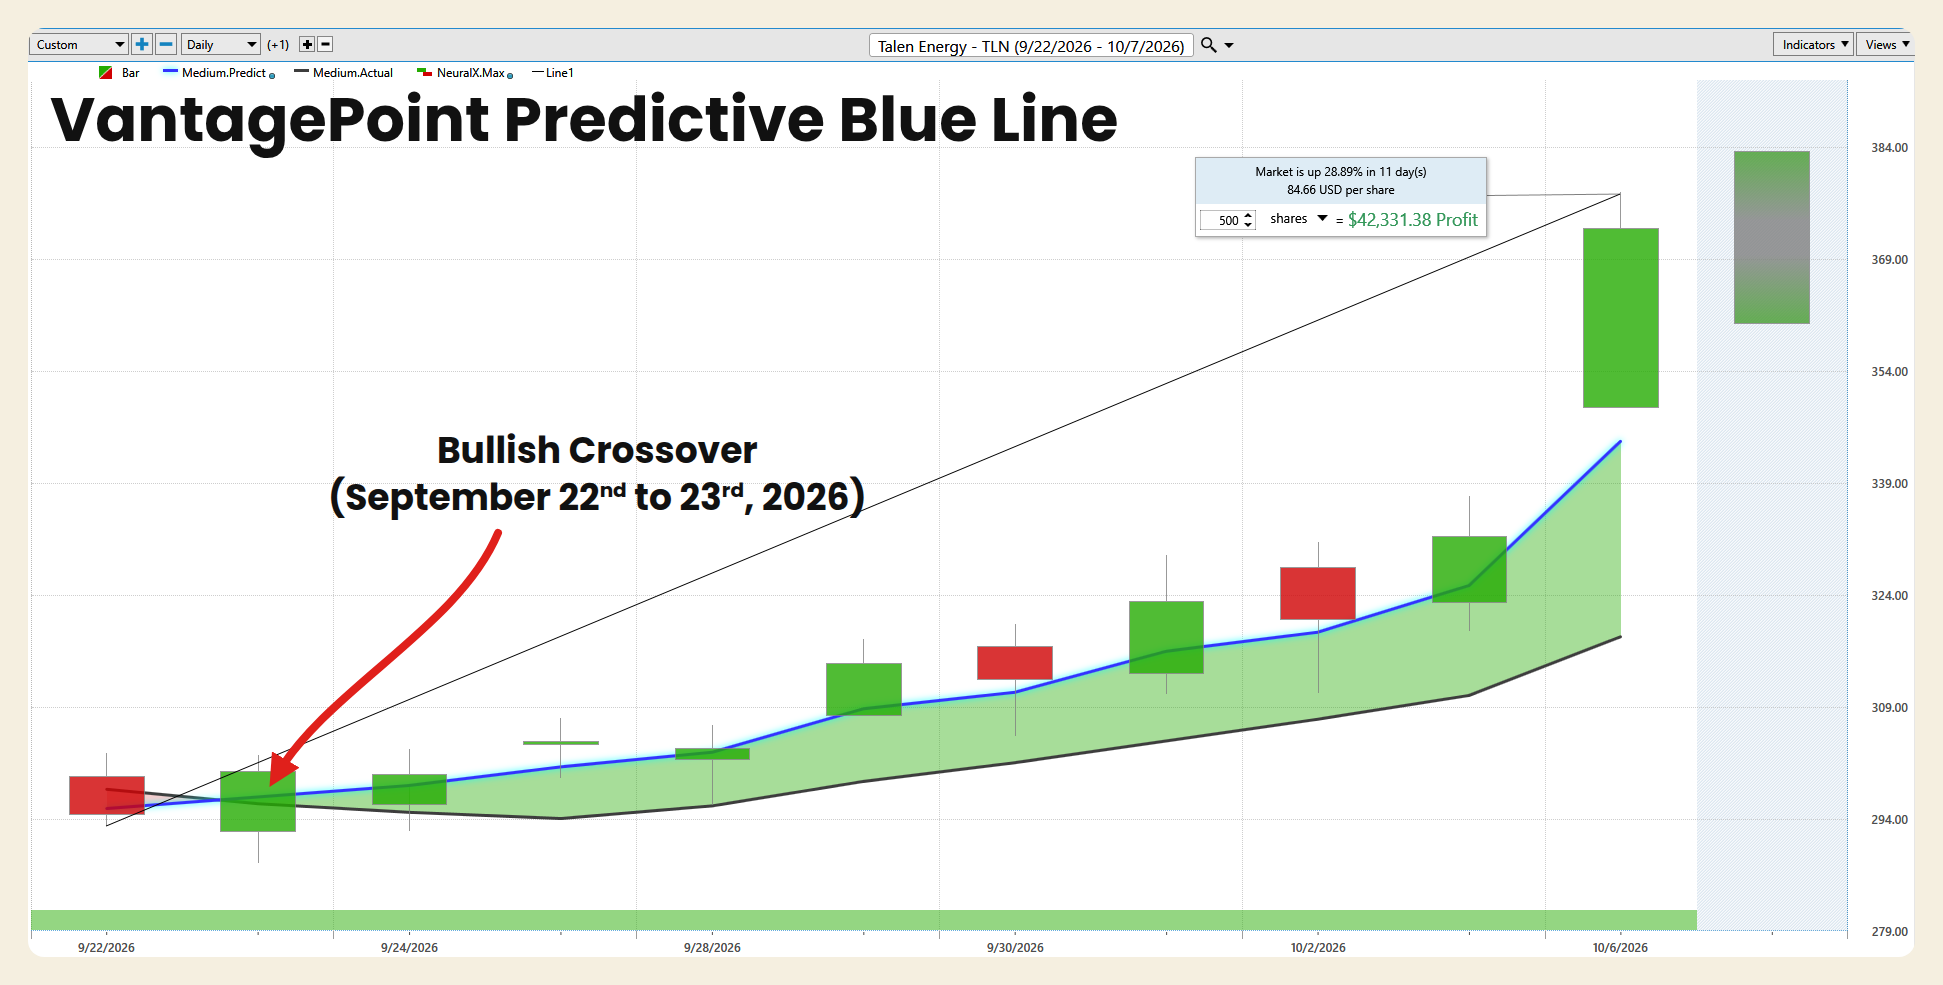
The VantagePoint AI Predictive Blue Line is a forecasted moving average that uses artificial intelligence to anticipate where the trend is heading, rather than simply reporting where it has been. The key reading is the relationship between the blue line and the black line, which represents the actual moving average of price. When the blue line is above the black line and rising, the forecast is pointing to strength ahead. When it crosses below, the forecast is warning of weakness.
The chart covers the 11 trading sessions from September 22 through October 6, 2026, the heart of the recovery from the September 15 low. On September 22, the black actual moving average sat slightly above the Predictive Blue Line, both near $296. The blue line then crossed above the black line between the September 22 and September 23 sessions, and the shading between the two lines turned green. That bullish crossover arrived when the stock was still trading near $300, nearly two weeks before the sector rally made headlines.
Since the crossover, the blue line has risen in every session and the green band has widened steadily. By the October 6 session, the Predictive Blue Line read approximately $344.50 while the black actual moving average read approximately $318.30, a gap of about $26, or roughly 8%. The slope of the blue line steepened sharply on the final day. VantagePoint’s own measurement on the chart shows the market up 28.89%, or $84.66 per share, over the 11-day window, measured from the September 22 low area to the October 6 high.
The distinction matters. The Blue Line turned before the big move, not because of it, which is exactly what a forecasted moving average is designed to do. The current reading is bullish, with a rising forecast and a widening separation. It is also worth noting that the October 6 close of $373.11 sits well above both lines, which tells you price has run ahead of even the forecasted trend. The reading that would change the picture is a flattening of the blue line followed by a cross back below the black line.
VantagePoint AI Neural Index
The VantagePoint AI Neural Index is a short-term strength indicator that forecasts whether the market is likely to be higher or lower over the next 48 hours. It appears as the colored strip along the bottom of the chart: green indicates predicted short-term strength and red indicates predicted short-term weakness.
Across all 11 trading sessions shown, from September 22 through October 6, 2026, the Neural Index was green. There was not a single red reading in the window. That unbroken strength lines up with the price action: the stock moved from the $293 area on September 22 to the $373.11 close on October 6, and after the September 23 session, which held above the September 15 low, the only red candles were small ones on September 30 and October 2.
When the Neural Index and the Predictive Blue Line agree, VantagePoint refers to the setup as a double confirmation, and from September 23 onward, they have agreed every day. The blue line has been above the black line and rising while the Neural Index has stayed green, which is the double confirmation setup marked on the chart. The item to watch is the first red reading. After an 11-session green run and a 12% single-day gain, a red print would be the earliest sign that short-term momentum is cooling, even if the Blue Line still points higher.
VantagePoint AI Daily Range Forecast
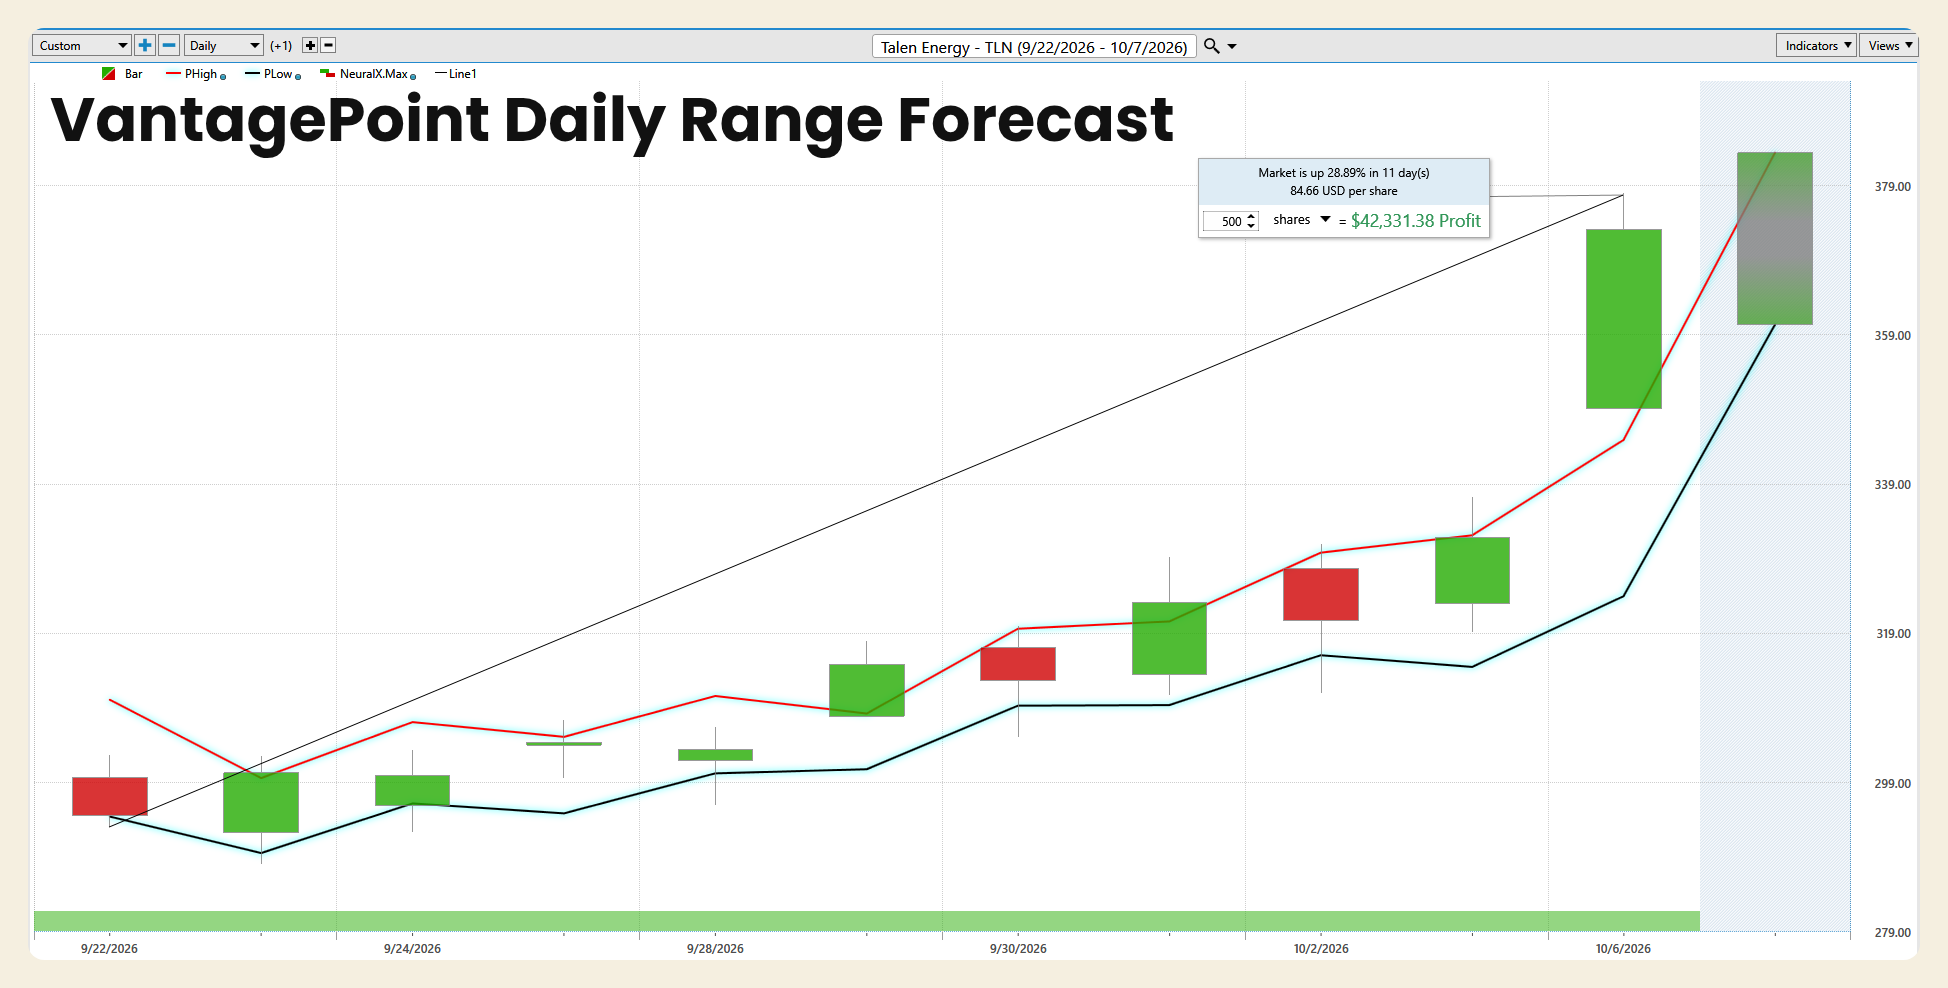
The VantagePoint AI Daily Range Forecast projects a predicted high and a predicted low for the next trading session. The red line marks the predicted high and the dark line marks the predicted low. Together they frame where price is expected to trade, giving traders a structure for entries, exits and stop placement.
For October 7, 2026, the forecast bar spans from a predicted high of approximately $383.56 to a predicted low of approximately $360.50, a projected range of about $23.06, or 6.18% of the October 6 close. That is notably wider than the stock’s recent behavior: across the past 20 sessions, Talen’s average daily range was 4.26% of its closing price. The forecast is expecting a volatile session. The October 6 close of $373.11 sits just above the roughly $372 midpoint of the projected band.
The more important observation is the direction of both boundaries. The predicted high and predicted low have been rising since September 23, and both turned sharply higher into October 6 and October 7. When both boundaries rise together, the forecast is describing a trending market rather than a range-bound one. The October 6 session also shows how stretched the move became. The predicted high for that day was approximately $346, yet the stock opened at $349.15, above the entire projected band, and closed roughly $27 above the predicted high. A close that far outside the projected range is a sign of strong momentum, and it also marks a short-term zone where pullbacks become more likely.
For a trader, the practical use is straightforward. A pullback toward the predicted low, near $360.50 for October 7, would be a test of the short-term trend rather than a break of it. A close below the predicted low, especially on a day when the Neural Index turns red, would be the first sign that the rising structure is weakening. Upper-band trading near $383.56 is the zone where short-term traders tend to tighten stops rather than chase.
Intermarket Analysis
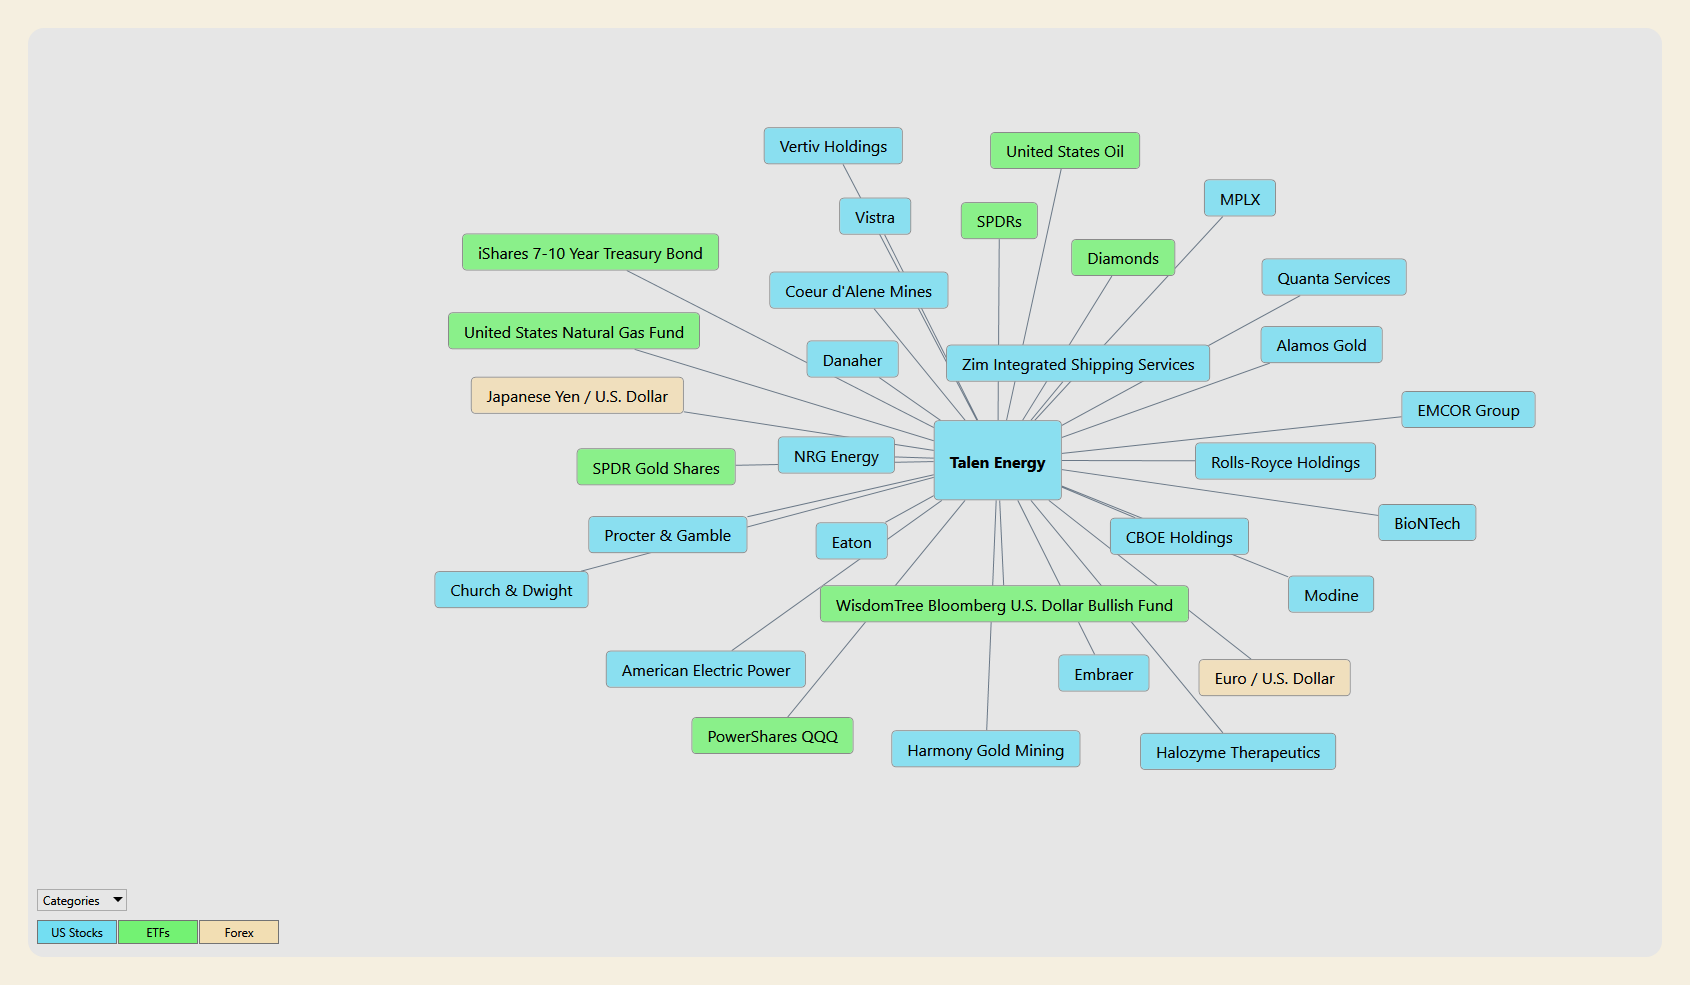
No stock trades in isolation. VantagePoint’s Intermarket Analysis identifies the related markets whose price behavior has the greatest influence on the forecast for a given stock, and it feeds those relationships into the AI models behind the readings above.
For Talen Energy, the map includes 21 U.S. stocks, 8 exchange-traded funds and 2 currency pairs. The U.S. stocks are Vertiv Holdings, Vistra, Coeur d’Alene Mines, Danaher, NRG Energy, Procter & Gamble, Church & Dwight, Eaton, American Electric Power, Zim Integrated Shipping Services, MPLX, Quanta Services, Alamos Gold, EMCOR Group, Rolls-Royce Holdings, BioNTech, CBOE Holdings, Modine, Embraer, Harmony Gold Mining and Halozyme Therapeutics. The ETFs are United States Oil, SPDRs, Diamonds, the iShares 7-10 Year Treasury Bond fund, the United States Natural Gas Fund, SPDR Gold Shares, the WisdomTree Bloomberg U.S. Dollar Bullish Fund and PowerShares QQQ. The currency pairs are the Japanese yen against the U.S. dollar and the euro against the U.S. dollar.
The most intuitive group is the power and grid complex. Vistra and NRG Energy are direct competitors in competitive power markets, and American Electric Power is a large regulated utility operating inside PJM. Around them sits the data center build-out supply chain: Vertiv supplies power and cooling equipment for data centers, Eaton makes electrical distribution equipment, Quanta Services and EMCOR build and service grid and electrical infrastructure, and Modine supplies data center cooling systems. Rolls-Royce Holdings, which is developing small modular reactors, connects to the nuclear side of the story. Together these markets capture the same investment theme that drove Talen’s move this week, which is why the AI treats them as related.
The energy and macro entries matter just as much. The United States Natural Gas Fund is particularly relevant, because natural gas sets the marginal price of electricity in PJM much of the time and fuels most of Talen’s newly acquired plants. United States Oil and MPLX, a midstream energy partnership, extend that energy link. The iShares 7-10 Year Treasury Bond fund connects to interest rates, which matter for a company that financed more than $6 billion of acquisitions largely with debt. The gold miners, Coeur d’Alene Mines, Alamos Gold and Harmony Gold Mining, along with SPDR Gold Shares, the dollar fund and the yen and euro pairs, describe the broader macro and currency backdrop, while the broad index funds, PowerShares QQQ and the defensive consumer names such as Procter & Gamble and Church & Dwight capture shifts between growth and defensive positioning.
The distinction matters. Intermarket Analysis does not claim that any one of these markets moves Talen on a given day. It recognizes that a power producer tied to data center demand is exposed to natural gas, interest rates, sector rotation and the capital spending cycle all at once, and it lets the AI weigh those influences together rather than asking a trader to track 31 charts by hand.
Our Suggestion
Talen Energy is a company where two honest stories are true at the same time. The first is a heavily acquisitive, debt-funded power producer that reports volatile GAAP results, missed earnings estimates last quarter, pulled forward future capacity revenue to fund share repurchases, is changing CEOs and just rallied 12% on a contract it did not sign. The second is a company whose fleet has nearly doubled, whose 2026 cash flow guidance implies roughly a 7% free cash flow yield at today’s price, whose Susquehanna nuclear plant is contracted to Amazon through 2042, and which expects to retire more than a tenth of its shares in the next two quarters. The market spent the summer giving more weight to the first story. In the past three weeks it has started giving more weight to the second.
That is the trade in one sentence: Talen is a leveraged bet that AI-driven power demand in PJM keeps rising fast enough to turn a much larger fleet and a shrinking share count into durable per-share cash flow growth, and the bet holds only if the company’s own results, not just its competitors’ contracts, keep confirming it.
The weekly chart frames the opportunity and the risk. Talen sits at the 54.42nd percentile of its 52-week range, just above the $365.53 midpoint, with 20.95% of room to the $451.28 high and 25.02% of downside to the $279.77 low. Twice in the past year the stock has rallied toward the $450 area and twice it has failed there. The October 6 surge broke a summer pattern of lower highs, but one week of strength does not yet make a new trend.
Taken together, the VantagePoint readings are aligned. The Predictive Blue Line crossed above the black line between September 22 and 23 and has widened its lead since, reading about $344.50 against $318.30 at the end of the chart. The Neural Index has printed green for 11 consecutive sessions, giving a double confirmation setup every day since September 23. The Daily Range Forecast shows both boundaries rising, with a projected band of approximately $360.50 to $383.56 for October 7. The short-term forecasting tools are pointing in the same direction as the one-month and one-week relative strength data.
The risks are clear. The next earnings report on November 4 will be the first full quarter with the Cornerstone plants, and the last report produced a miss despite raised guidance. The balance sheet now carries debt from two large acquisitions alongside a $1.5 billion accelerated repurchase. PJM capacity prices are capped, and the rules for serving data centers remain under regulatory review. On the chart, the October 6 close finished far above both the Predictive Blue Line and the predicted high for the day, which means price is stretched in the short term. Momentum is not safety, and a stock that can gain 33% in three weeks can give back a large share of that just as quickly, as it did in the summer when it fell nearly 38% in three months.
For traders, the disciplined approach is to let the VantagePoint readings define the risk rather than the headlines. A Neural Index turning red, a flattening Predictive Blue Line or a close below the predicted low would each be a reason to tighten risk. A close back below the October 6 gap at $331.87 would suggest the sector rally is fading, and a close below the September 15 low of $279.77 would indicate that the character of the trend has changed. Until then, the evidence favors respecting the rebound while keeping position size modest enough to absorb a normal Talen-sized pullback.
Historical returns and technical signals are not guarantees of future results. They are tools for framing probability and managing risk.
Practice great money management on every trade, and use the VantagePoint AI Daily Range Forecast to identify short-term trading opportunities while keeping risk firmly under control.
It’s not magic.
It’s machine learning.
Disclaimer: THERE IS A HIGH DEGREE OF RISK INVOLVED IN TRADING. IT IS NOT PRUDENT OR ADVISABLE TO MAKE TRADING DECISIONS THAT ARE BEYOND YOUR FINANCIAL MEANS OR INVOLVE TRADING CAPITAL THAT YOU ARE NOT WILLING AND CAPABLE OF LOSING.
EXAMPLES ARE SUCCESS STORIES AND ATYPICAL. PAST RESULTS DO NOT GUARANTEE FUTURE PERFORMANCE.
VANTAGEPOINT’S MARKETING CAMPAIGNS, OF ANY KIND, DO NOT CONSTITUTE TRADING ADVICE OR AN ENDORSEMENT OR RECOMMENDATION BY VANTAGEPOINT AI OR ANY ASSOCIATED AFFILIATES OF ANY TRADING METHODS, PROGRAMS, SYSTEMS OR ROUTINES. VANTAGEPOINT’S PERSONNEL ARE NOT LICENSED BROKERS OR ADVISORS AND DO NOT OFFER TRADING ADVICE.