




This week’s AI stock spotlight is Viatris Inc. ($VTRS).
Viatris is one of the youngest large companies in global pharmaceuticals and, at the same time, one of the oldest. The corporate name dates only to November 2020, when Mylan, the generic drug maker founded in 1961, combined with Upjohn, the off-patent branded medicines division of Pfizer. The result was a company that owns household brand names that lost patent protection years ago, including Lipitor, Norvasc, Lyrica, Viagra, Celebrex and Effexor, alongside EpiPen, Creon, the respiratory medicine Yupelri, a large generics catalog, complex injectables and a biosimilars franchise. Headquartered in Canonsburg, Pennsylvania and led by Chief Executive Officer Scott A. Smith, Viatris employs roughly 30,000 people and markets its medicines around the world.
The business model is simple to describe and difficult to execute. Viatris manufactures and distributes established medicines at enormous scale, accepts steady price erosion as the cost of being in that business, and uses the cash flow to pay a dividend, reduce debt, repurchase shares and fund a smaller portfolio of newer, higher-margin products. The company reports four geographic segments: Developed Markets, which covers North America and Europe and is the largest; Greater China; JANZ, which covers Japan, Australia and New Zealand; and Emerging Markets. Inside those segments, revenue splits between Brands, which are established branded medicines, and Generics, which includes complex generics and biosimilars.
Its competitors come from two directions. In generics and biosimilars, Viatris competes with Teva, Sandoz, Hikma, Amneal and large Indian manufacturers such as Sun Pharma and Dr. Reddy’s. In established brands, it competes with the same generic versions of its own products and with branded peers that compete in the same therapeutic classes. The differentiation is reach. Few companies can take a mature brand like Lipitor and keep it relevant in Chinese hospitals, Japanese pharmacies and European tender markets at the same time, and that global commercial infrastructure is the platform Viatris is now trying to fill with new products.
On September 28, 2026, Viatris closed at $18.27, up 2.47% on the day, within 0.7% of its 52-week high of $18.39 and roughly 3% below the post-merger weekly high of $18.86 set in the final week of 2020. That is why the stock is relevant this week. A company that spent most of its first five years as a public entity drifting lower, and that touched $7.21 in April 2025, has nearly erased its entire post-merger decline. The question for traders is whether this is a durable rerating of a cash-generating business or a crowded recovery trade running into a seasonally difficult stretch of the calendar.
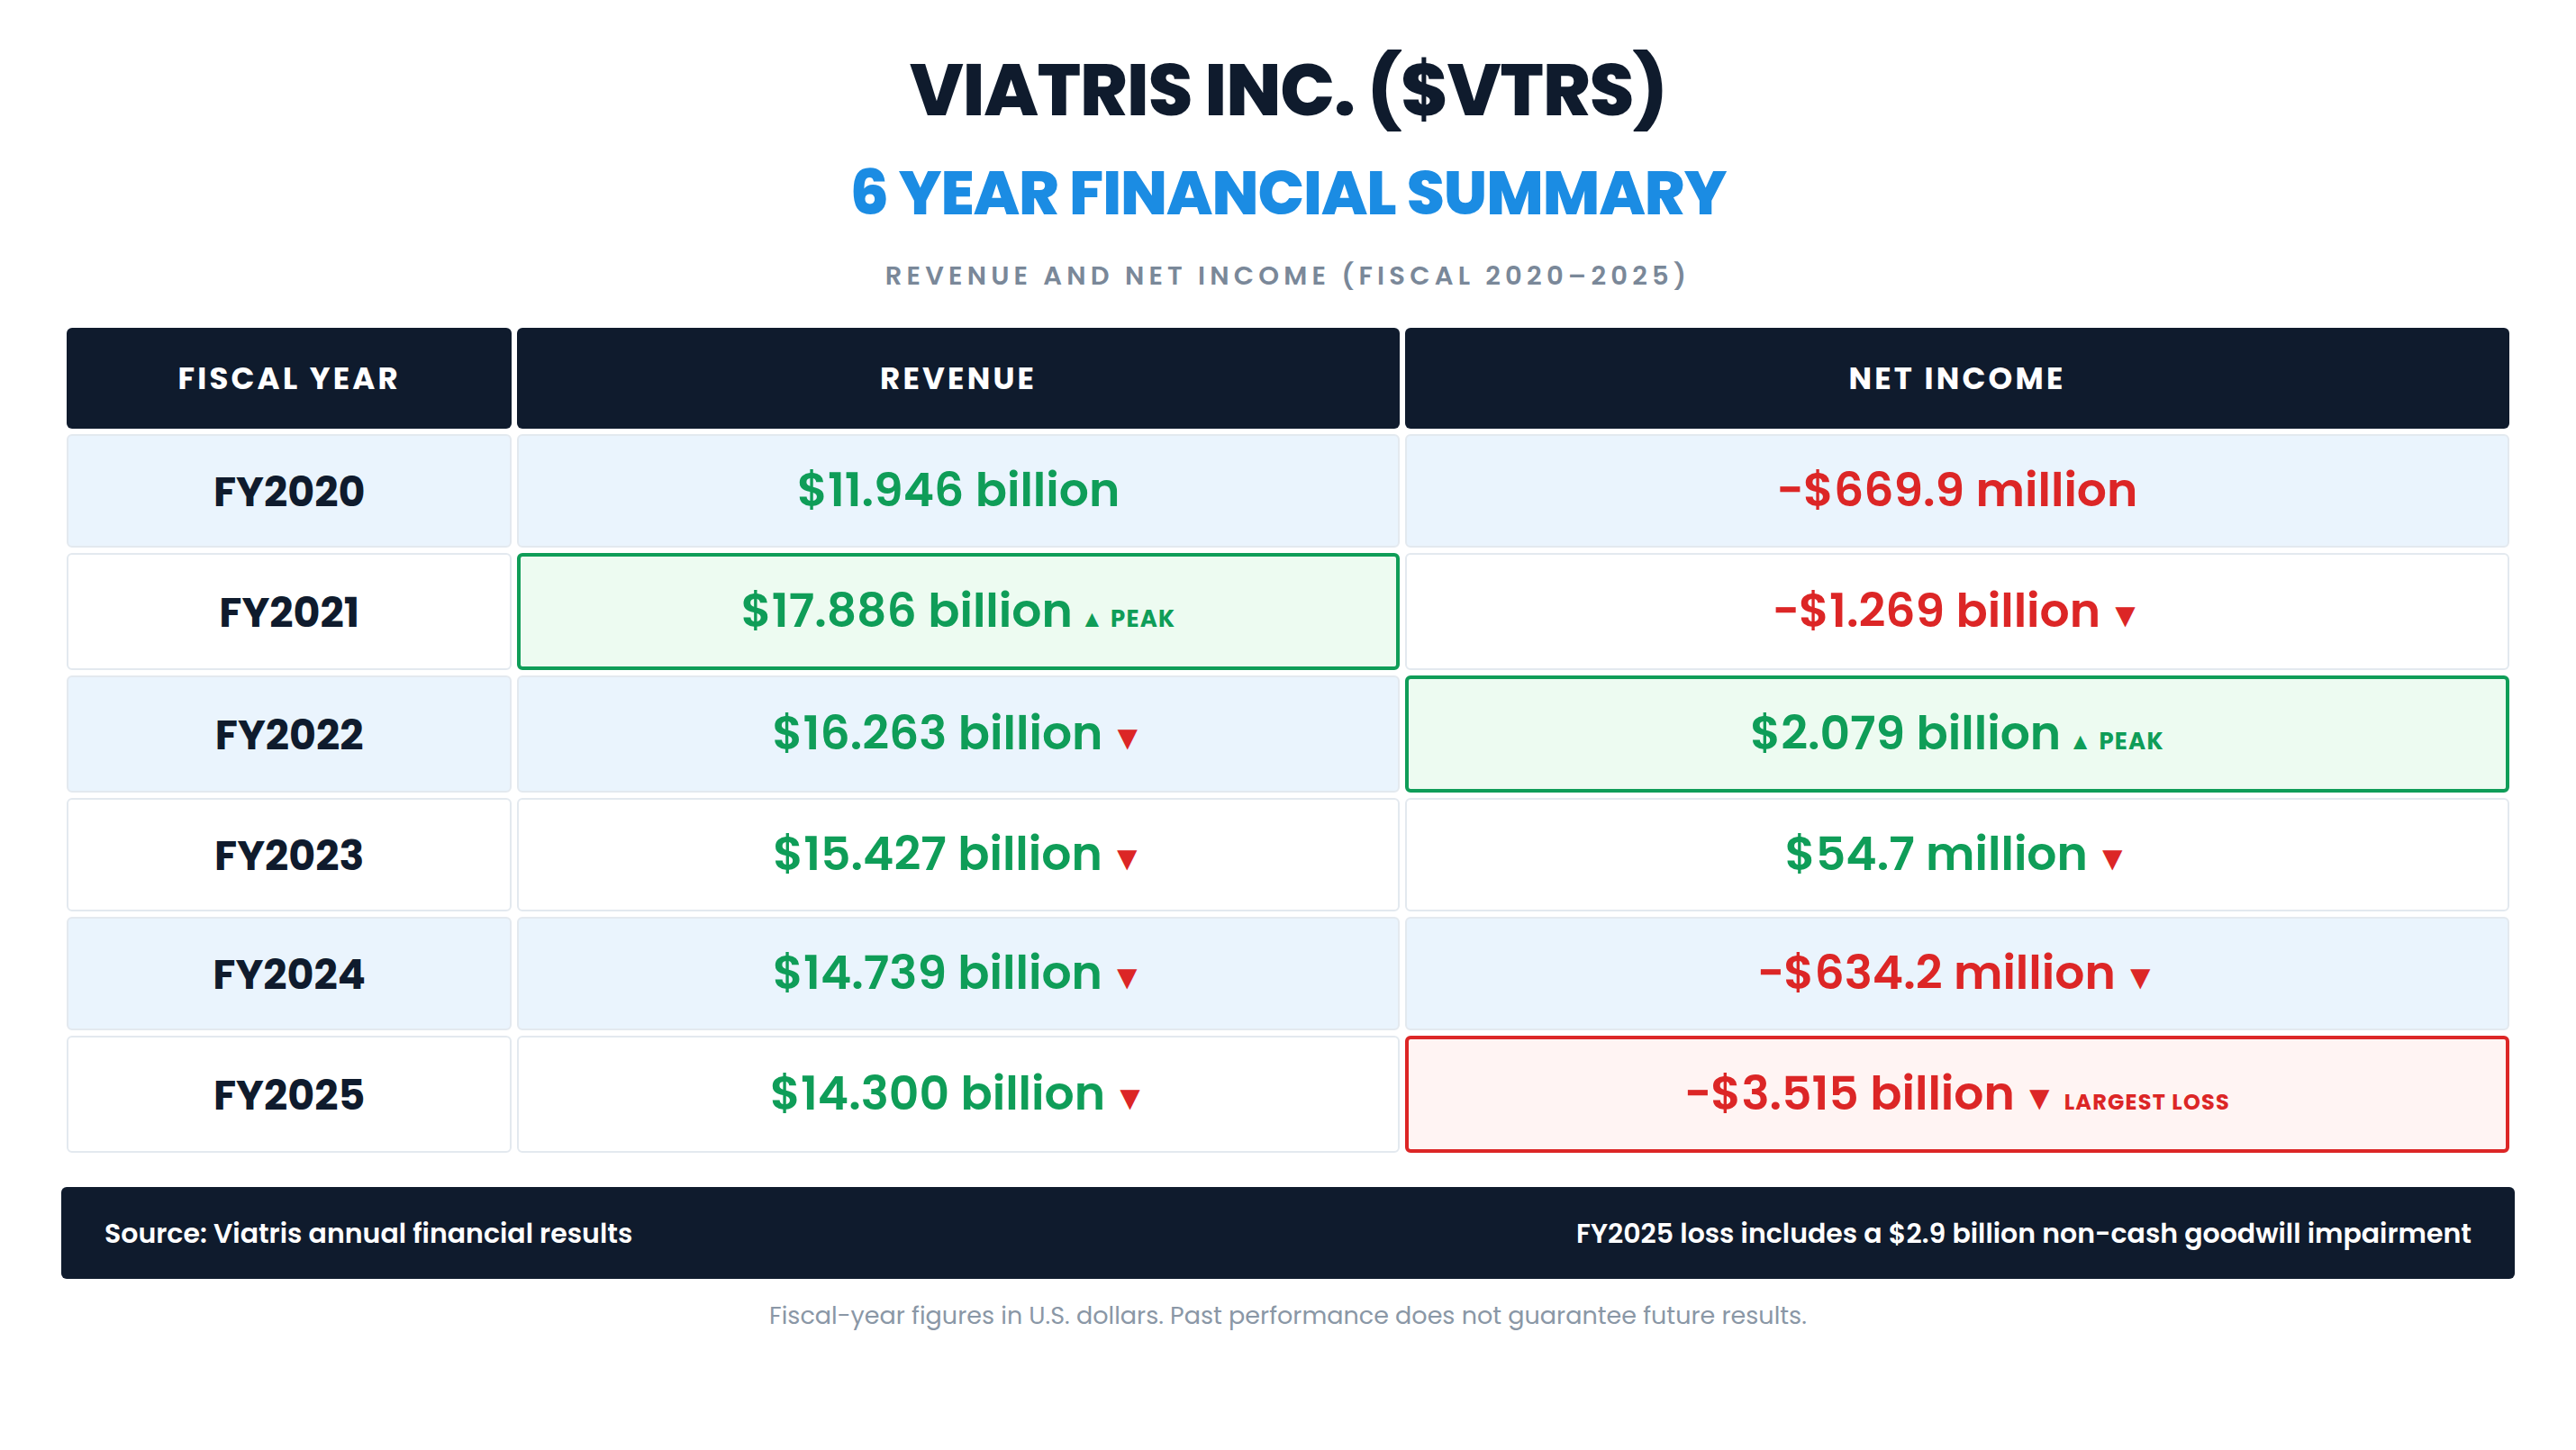
The six-year record is not flattering, and it should not be read casually. Revenue was $11.946 billion in fiscal 2020, a figure that includes only about six weeks of the combined company because the merger closed in November of that year. Revenue then reached a peak of $17.886 billion in fiscal 2021, the first full year, and declined every year after that: $16.263 billion in 2022, $15.427 billion in 2023, $14.739 billion in 2024 and $14.300 billion in 2025. Fiscal 2025 revenue sits 20% below the 2021 peak.
Net income is even more uneven. Viatris lost $669.9 million in 2020 and $1.269 billion in 2021 as merger and integration costs worked through the income statement. It earned $2.079 billion in 2022, its best year, then just $54.7 million in 2023. It lost $634.2 million in 2024, a year dominated by charges tied to the divestiture of noncore businesses, and then lost $3.515 billion in 2025, the largest loss in the table. The distinction matters. Most of the 2025 loss came from a $2.9 billion non-cash goodwill impairment recorded in the first quarter of 2025, after the market value of the company fell sharply that spring. Diluted earnings per share moved from a loss of $1.11 in 2020 to a loss of $1.05 in 2021, a profit of $1.71 in 2022 and $0.05 in 2023, and losses of $0.53 in 2024 and $3.00 in 2025.
Some of the revenue decline was deliberate. Between 2022 and 2024 Viatris sold its biosimilars business to Biocon Biologics and exited several noncore franchises, including its over-the-counter, women’s health and active pharmaceutical ingredient businesses, trading revenue for simplicity and debt reduction. Some of it was not deliberate. In December 2024 the U.S. Food and Drug Administration issued a warning letter and an import alert for Viatris’ oral finished dose manufacturing facility in Indore, India, which blocked 11 actively distributed products from the U.S. market, including lenalidomide and everolimus. The company has said the Indore impact cost it about $370 million of revenue in 2025.
Here is the number the annual table hides. In the second quarter of 2026, Viatris reported a GAAP net loss of $118.8 million, or a loss of $0.10 per share. In the same quarter it reported adjusted earnings per share of $0.69. That gap of $0.79 per share is the whole debate in one line. It is made up mostly of $586.4 million of non-cash amortization from purchase accounting on acquired products, a $177.8 million write-down tied to the planned sale of Tyrvaya, litigation, restructuring and deal costs. Management’s 2026 guidance midpoint for adjusted earnings per share is $2.52. At the September 28 close, the stock trades at roughly 7.3 times that figure, and the midpoint of 2026 free cash flow guidance, excluding transaction and restructuring costs, is $2.2 billion against a market value of about $21 billion. The GAAP table describes a company that keeps losing money. The cash flow describes a company that generates roughly a tenth of its market value in free cash every year.
The second quarter of 2026, reported on August 6, 2026, is the most recent evidence. Total revenue was $3.757 billion, up 5% on a reported basis and 3.5% operationally from $3.582 billion a year earlier. Adjusted gross margin was 57.5%, nearly a full percentage point higher than a year ago. Adjusted EBITDA was $1.188 billion, a 31.6% margin, up 8% operationally from $1.079 billion. Adjusted net earnings were $808.5 million, and adjusted earnings per share of $0.69 rose from $0.62 a year earlier. Operating cash flow was $381.8 million against capital expenditures of $52.8 million, and free cash flow excluding $120 million of transaction and restructuring costs was $449 million. Viatris paid $139.8 million in dividends and spent $150.3 million on share repurchases during the quarter.
The segment detail is where the quarter came from. Greater China was the standout, with net sales of $713.8 million, up 21% on a reported basis and 16% operationally, and it now represents about 19% of total net sales. Developed Markets grew 4% on a reported basis to $2.194 billion, helped by new product sales. JANZ declined 3% to $296.1 million and Emerging Markets declined 2% to $542.3 million. Brands net sales were $2.418 billion, about 65% of the total, while Generics contributed $1.328 billion. New product revenue was about $101 million in the quarter and $172 million for the first half, against a full-year expectation of $450 million to $550 million.
What the quarter proves is that the core business can grow modestly again after a period of divestitures and supply disruption, and that the margin structure is holding while it does. What it does not prove is that growth is broad. The quarter leaned heavily on China, where branded off-patent medicines have held up unusually well, while two of four segments shrank. It also came with a warning: management expects product supply disruptions to reduce total revenue by $100 million to $150 million in the second half of 2026, the result of a February 2026 fire at the company’s oral solid dose plant in Nashik, India, followed by an FDA inspection in May 2026 that produced Form 483 observations and an ongoing remediation plan.
Traders are really asking two questions now. First, is the cash engine strong enough that the GAAP losses stop mattering, or will impairments, write-downs and manufacturing charges keep resurfacing and keep the valuation discount in place? Second, can the pipeline convert a slow-growth established-medicines company into a genuine growth story before price erosion and India manufacturing problems absorb the progress?
The bullish evidence is concrete. Viatris raised the midpoint of every 2026 guidance metric on August 6, 2026. Total revenue guidance moved to $14.55 billion to $14.95 billion, a midpoint of $14.75 billion. Adjusted EBITDA guidance moved to $4.30 billion to $4.50 billion from $4.15 billion to $4.45 billion. Adjusted earnings per share guidance moved to $2.45 to $2.59 from $2.33 to $2.47. Free cash flow guidance, excluding transaction and restructuring costs, moved to $2.05 billion to $2.35 billion, and operating cash flow guidance moved to $1.9 billion to $2.1 billion. The balance sheet is steadily improving: long-term debt fell to $11.612 billion at the end of June 2026 from $12.792 billion a year earlier, the company repaid about $900 million of maturing debt in June, and gross leverage stood at 2.9 times adjusted EBITDA, inside its 2.8 to 3.2 times target. In April 2026, Fitch revised its outlook on Viatris’ BBB rating to Stable from Negative. A restructuring program launched in February 2026, which includes up to a 10% reduction in the global workforce, targets about $650 million of gross cost savings and about $400 million of net savings by the end of 2028.
The pipeline gives the story a second act. The FDA approved Gwyn Lo, a low-dose estrogen weekly contraceptive patch, in July 2026, with a launch expected later this year. The FDA accepted the new drug application for fast-acting meloxicam, a non-opioid treatment for moderate-to-severe acute pain, with a PDUFA goal date of December 27, 2026. Effexor received approval for generalized anxiety disorder in Japan, the Nefecon program posted positive Phase 3 results in Japanese patients with IgA nephropathy, and on September 16, 2026, Viatris announced approval of Wakix in Japan for narcolepsy and excessive daytime sleepiness associated with obstructive sleep apnea syndrome. Further out, the two Phase 3 programs licensed through Viatris’ partnership with Idorsia are the long-duration upside: cenerimod in systemic lupus erythematosus, where both Phase 3 studies are fully enrolled and a readout is targeted for the first half of 2027, and selatogrel for acute myocardial infarction, which is targeting full Phase 3 enrollment in 2026. Management has described both as potential blockbuster opportunities if the data succeed.
That is also where the market could be wrong. The main risk case has three parts. The first is manufacturing. India is a central manufacturing hub for Viatris, and the company is now managing two separate facility problems there at the same time: the Indore warning letter and import alert, where the company has said remediation is substantially complete but a reinspection is still required, and the Nashik fire and inspection findings, which are already built into second-half revenue guidance. Regulatory problems at pharmaceutical plants rarely resolve on the timetable companies hope for. The second is the market’s willingness to look through the GAAP numbers. The Tyrvaya charge in the second quarter is a reminder that the company’s intangible assets are large and that write-downs can arrive with little warning. The third is the reaction itself. On August 6, 2026, the same day Viatris beat expectations and raised guidance, the stock hit its 52-week high of $18.39 intraday and then reversed to close at $16.29, a one-day loss of 7.7%, before bottoming at $15.88 on August 14. A strong report was not enough to hold a new high the first time. Pricing pressure in generics, trade and tariff policy on imported medicines, and the possibility of a disappointing FDA decision on fast-acting meloxicam all sit on top of that.
The near-term catalyst calendar is clear. Third-quarter 2026 results are scheduled for November 5, 2026 at 8:30 a.m. Eastern Time, and that report will be the first full quarter to show the Nashik supply impact. Traders should watch for updates on the Indore reinspection, the commercial launch of Gwyn Lo, progress toward the December 27, 2026 PDUFA date for fast-acting meloxicam, the regulatory calendar for Nefecon in Japan and selatogrel enrollment. Viatris pays a regular quarterly dividend of $0.12 per share, and its 2026 dividend policy is $0.48 per share, a yield of about 2.6% at the current price. There is no special dividend. The most recent regular dividend was paid on September 16, 2026. Through early August the company had repurchased about $270 million of stock in 2026 at a weighted average price of $16.42, with about $730 million of authorization remaining.
This setup suits swing traders and position traders who are comfortable with a lower-volatility, cash-flow story that has turned into a momentum chart, and who can tolerate event risk around earnings and regulatory decisions. It is less suitable for traders who need clean GAAP profitability, or for anyone who treats a pharmaceutical stock with a dividend as a low-risk holding. The same shares fell by more than half between late 2020 and late 2022, and fell by nearly half again between early 2024 and April 2025.
The early-warning signal to watch is the gap between guidance and supply. If the November 5 report shows the second-half supply disruption running above the $100 million to $150 million range, or if management attaches new costs or a longer timeline to either India facility, the market is likely to question the raised guidance before it questions anything else. A second, faster signal is price behavior near the old high. After the August 6 reversal, a second failure in the $18.39 area would suggest that the recovery trade is exhausted for now.
So the picture heading into this week is a company with an improving cash profile, a genuinely catalyst-rich next nine months and a share price that has already moved a long way. The trend says stay interested. The volatility says stay alert. With that in mind, here is what the professional analyst community currently expects.
Wall Street Analysts Annual Forecasts
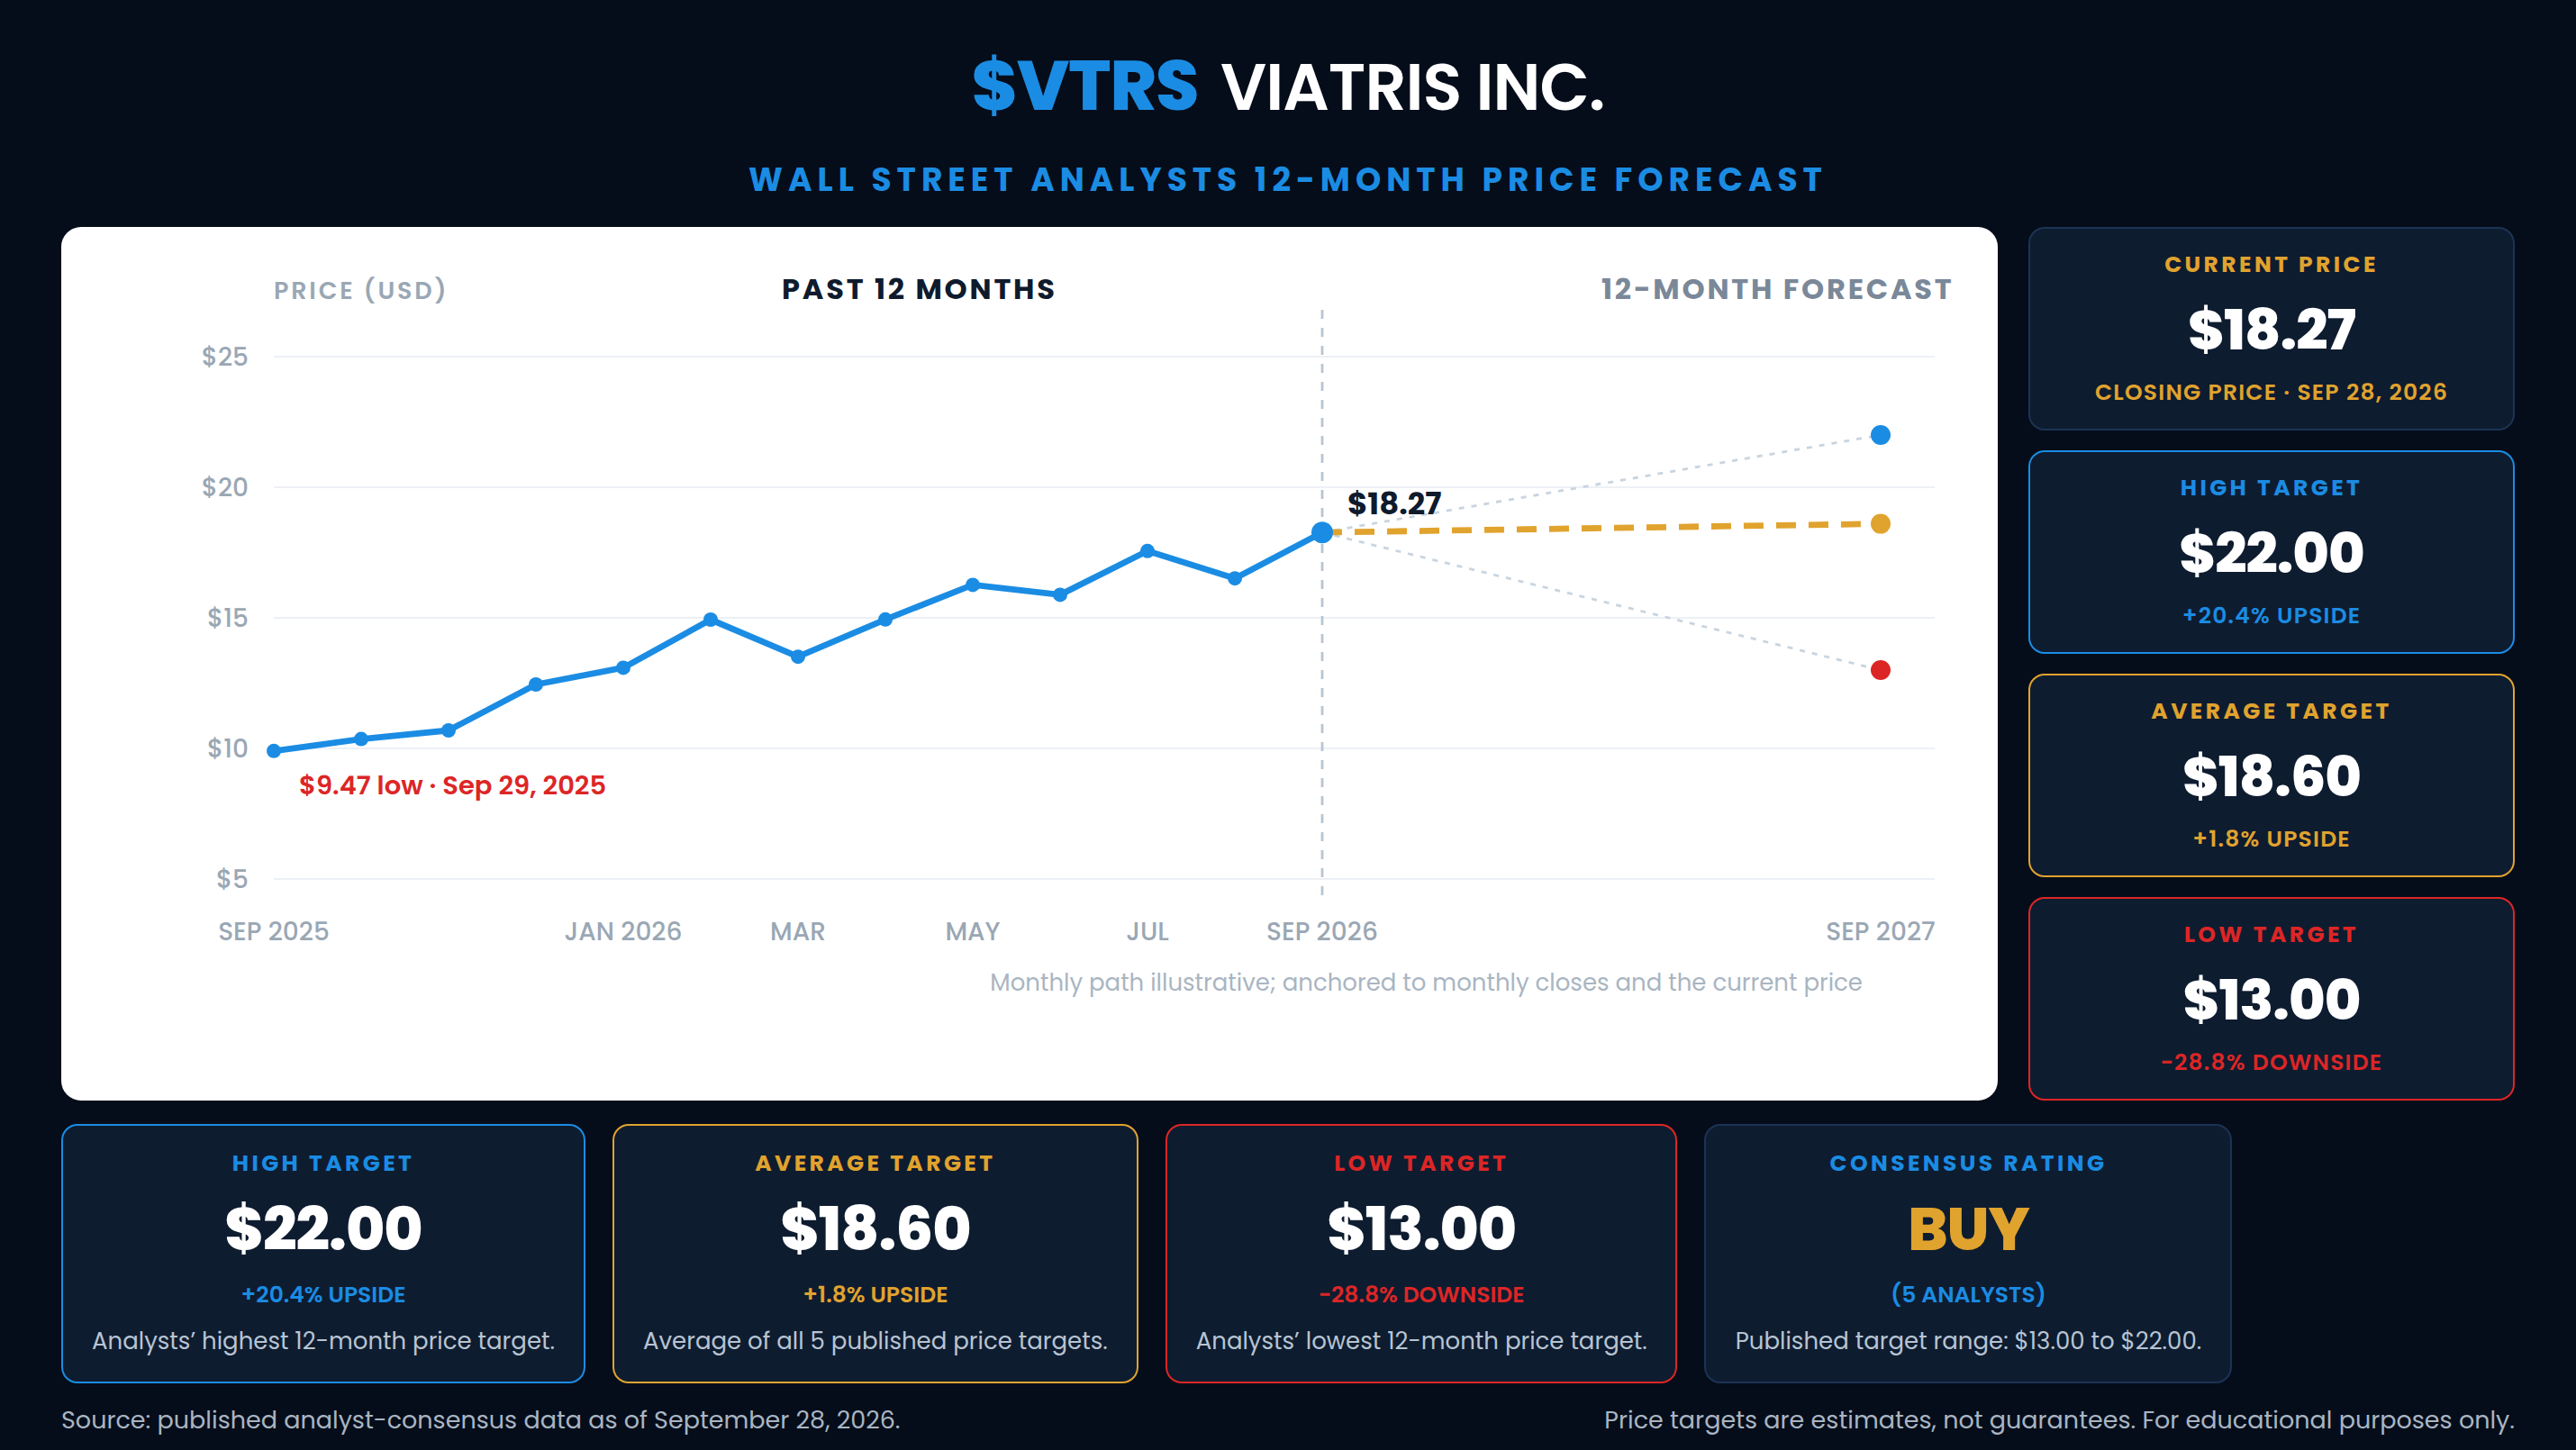
Measured against the September 28, 2026 close of $18.27, the average target implies a 1.81% gain. The median target implies a 9.47% gain. The high target implies a 20.42% gain. The low target implies a 28.84% decline. The spread between the high and low target is $9.00, which is 49.26% of the current share price.
The revision trail explains why the average is so close to the price. Barclays holds the high target at $22 with an Overweight rating, raised from $17 on May 19, 2026. Truist raised its target to $20 from $18 on May 8, 2026, and Argus raised its target to $20 from $15 on September 8, 2026, both with bullish ratings. JPMorgan is Neutral with an $18 target, raised from $17 on May 8, 2026. Piper Sandler is the low target at $13 with a Neutral rating, and it only raised that target from $12 on September 16, 2026, while the stock was already trading above $16.
The practical takeaway is that the bullish analysts see meaningful room from here, while the skeptics are anchored far below the market. That split is honest. It reflects a genuine disagreement about whether a company with shrinking annual revenue and recurring GAAP losses deserves a higher multiple, or whether its cash flow and pipeline have been mispriced for years. With only five analysts in the consensus, a single revision can move the average noticeably. Price targets are estimates of what a security might be worth over a twelve-month horizon under a specific set of assumptions. They are not certainties, and the $9 spread between the high and low target is a fair measure of how wide the range of reasonable outcomes remains.
52-Week High and Low Boundaries Analysis
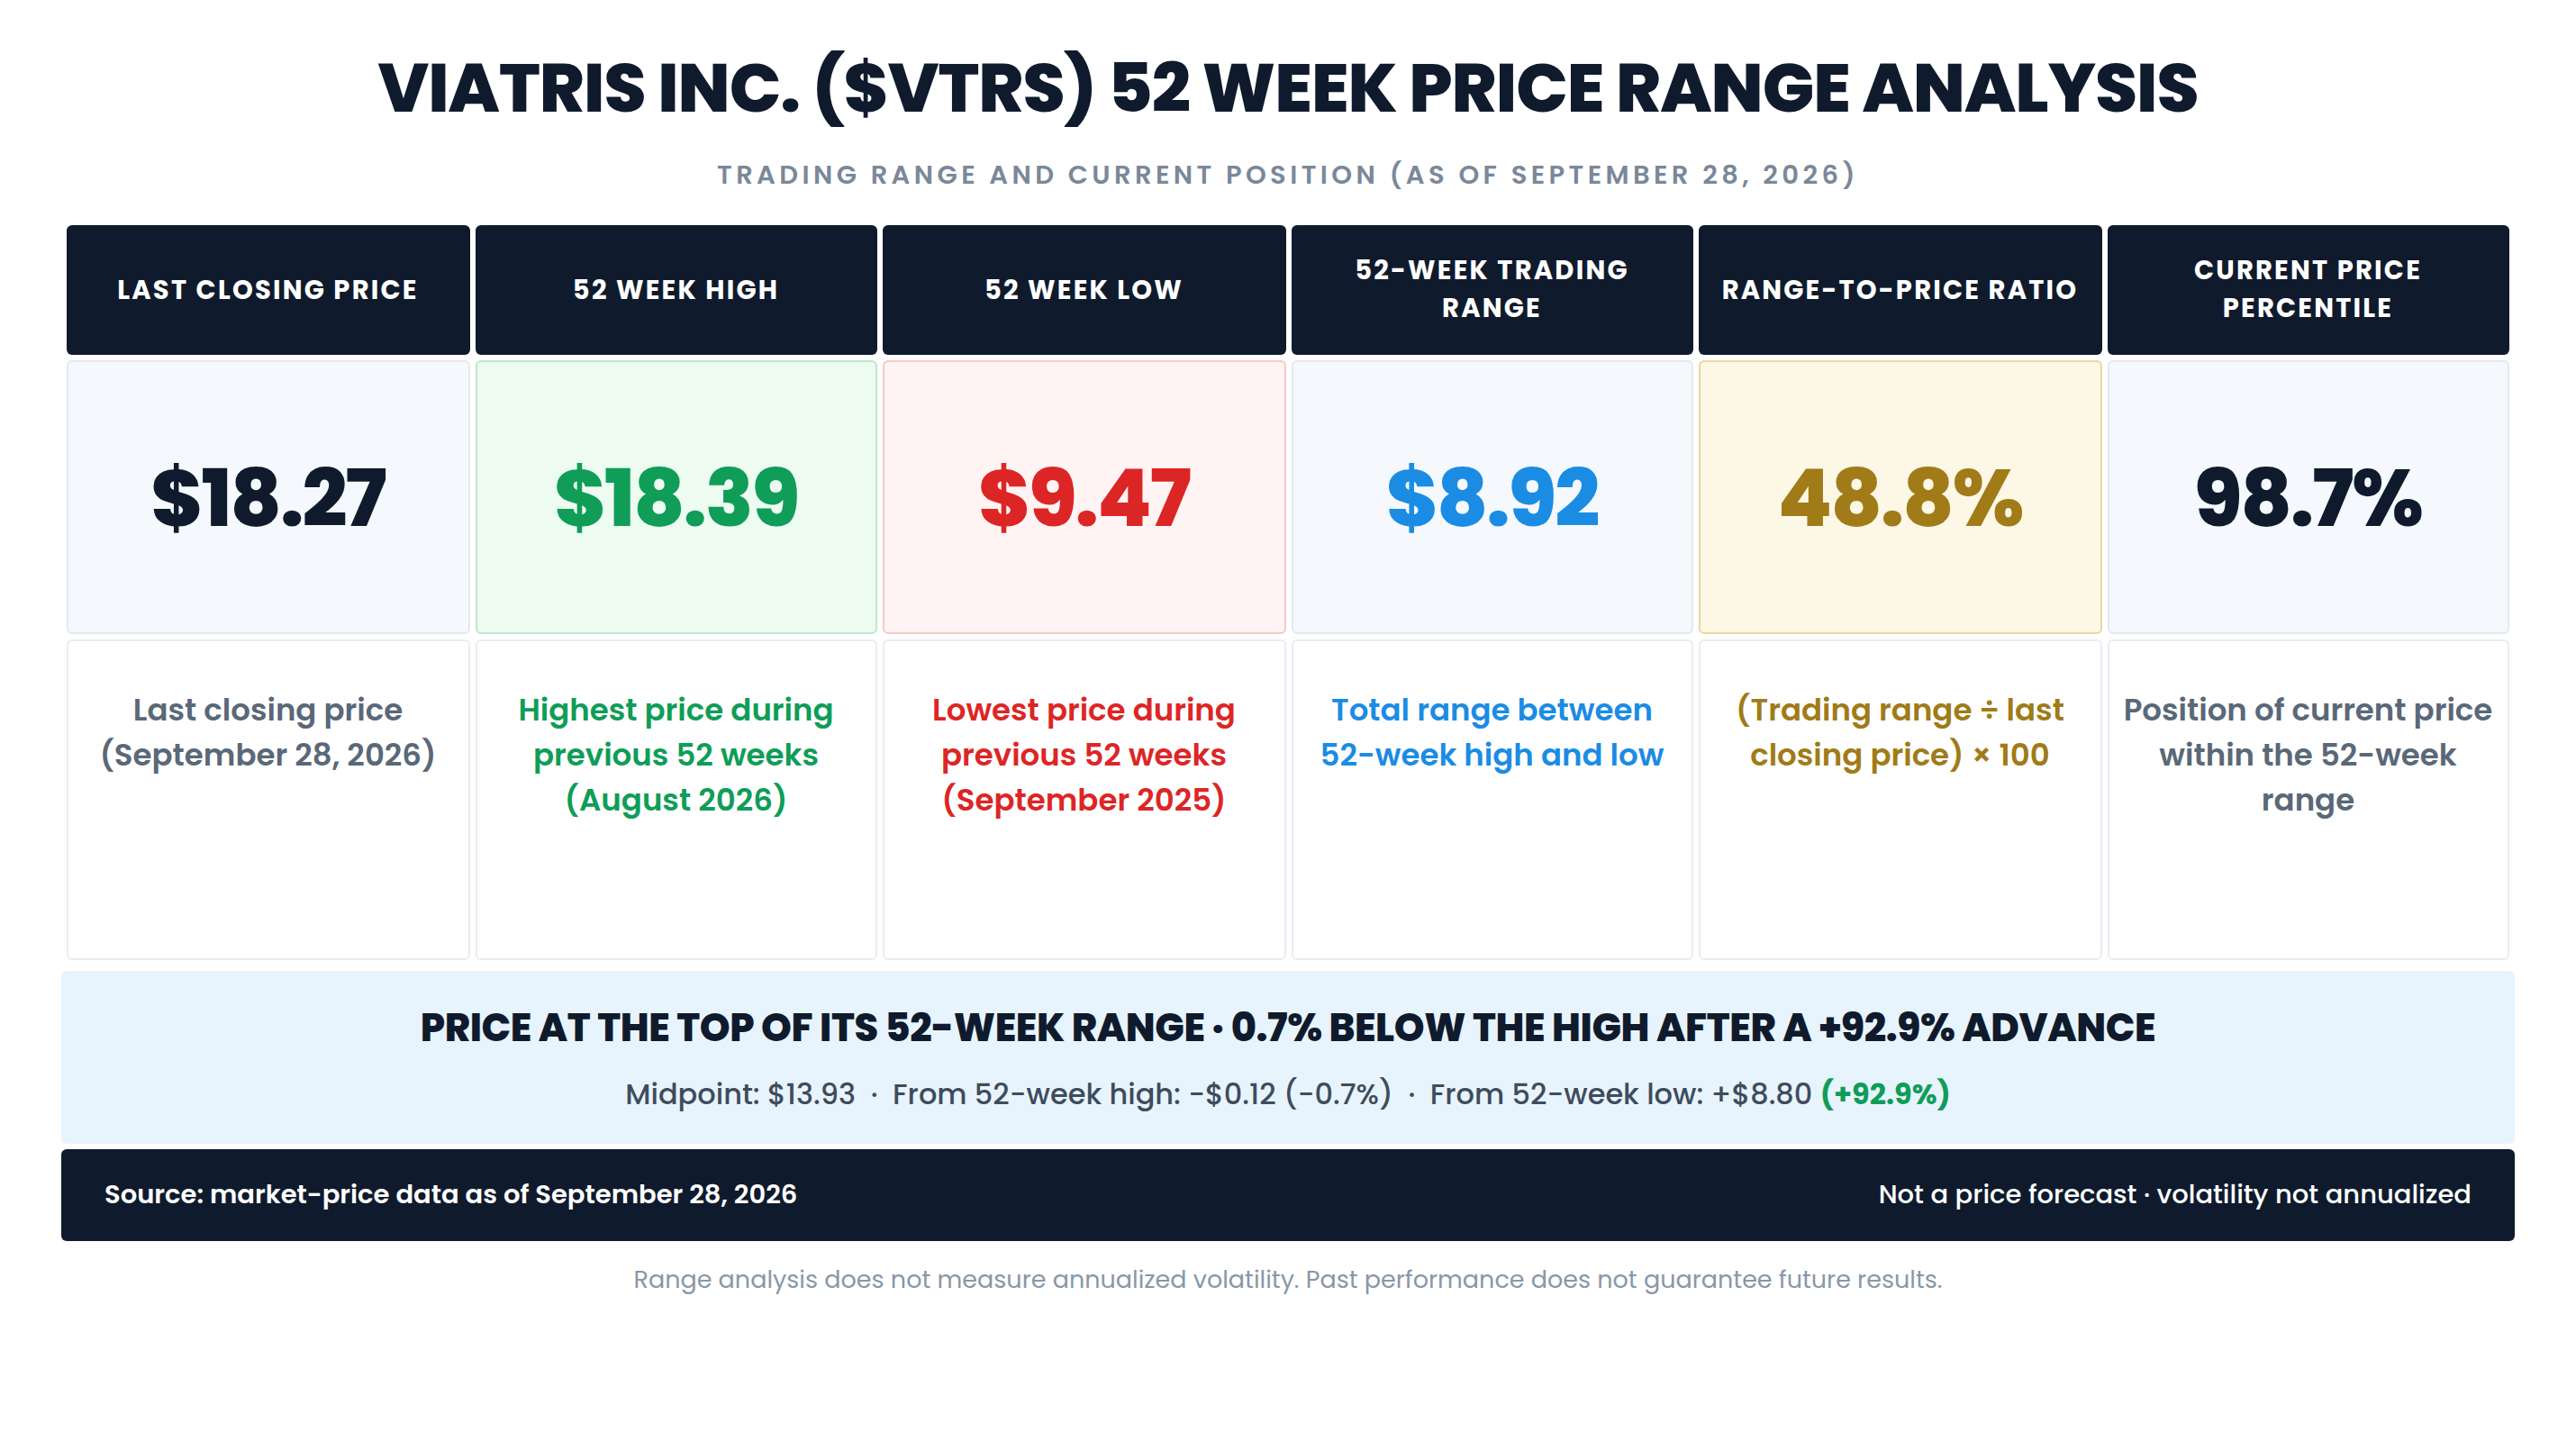
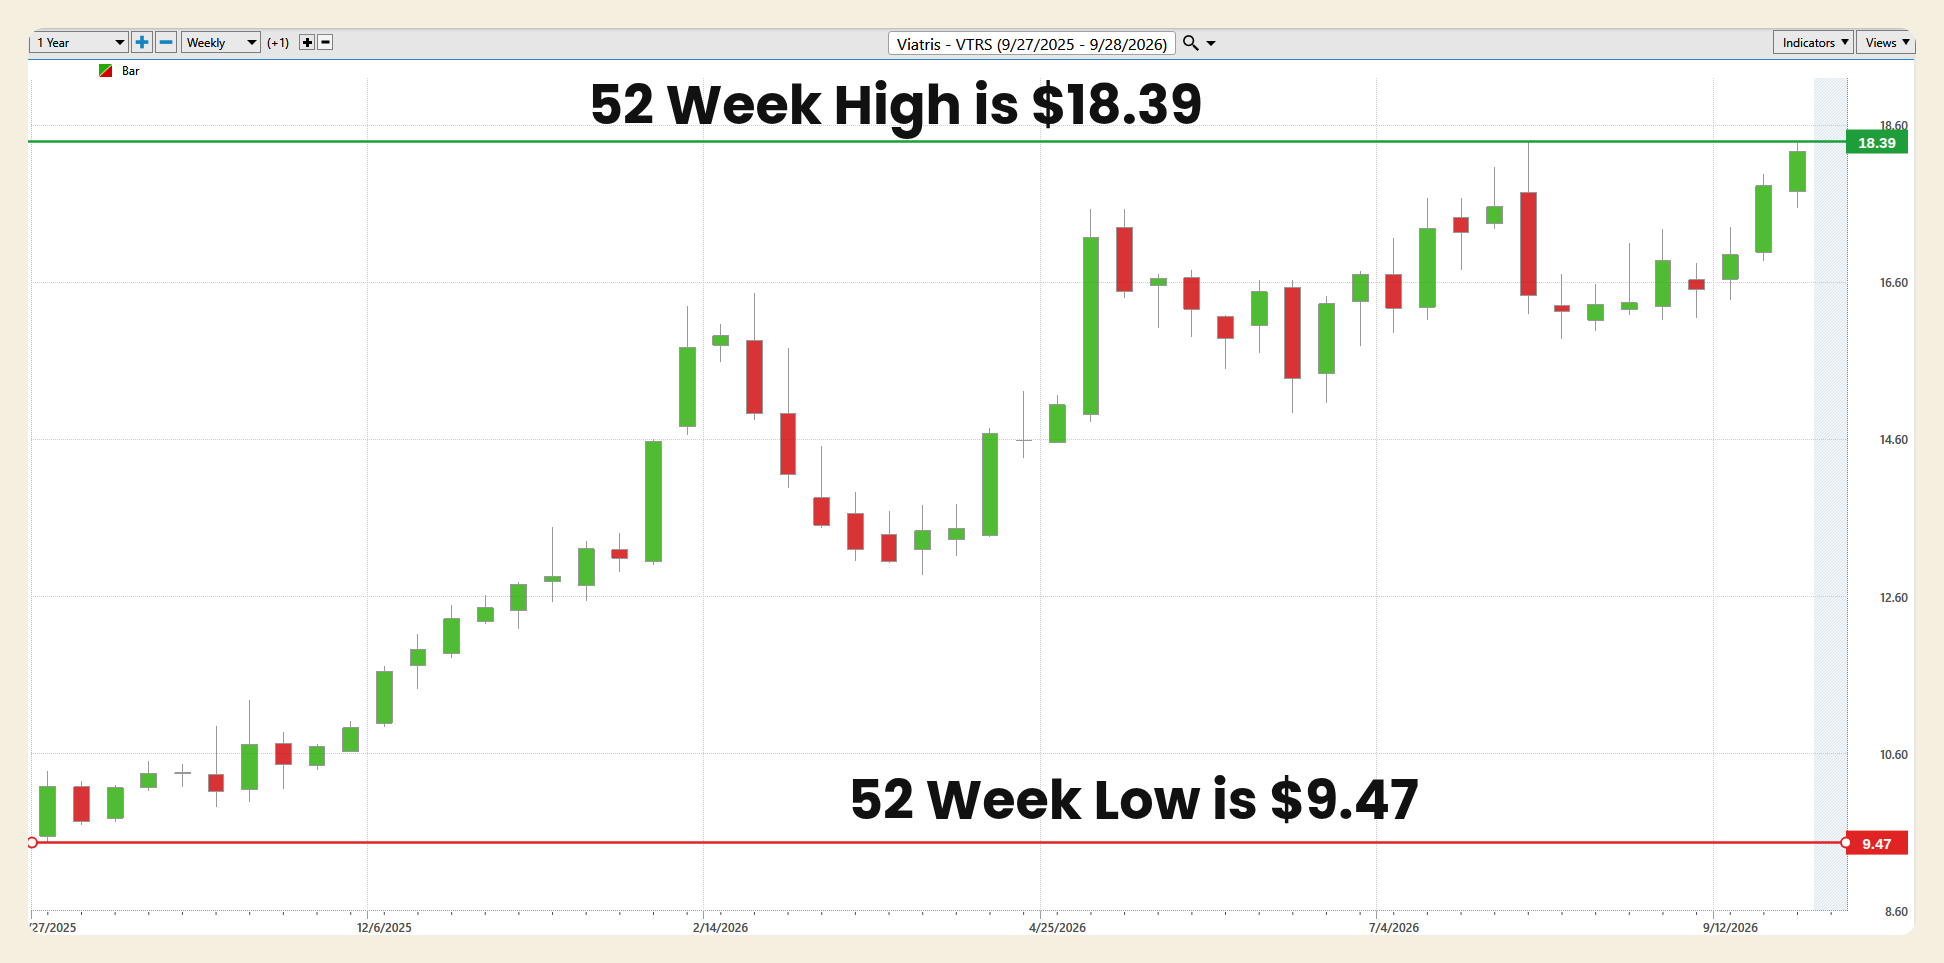
Viatris’ 52-week low is $9.47, set on September 29, 2025. Its 52-week high is $18.39, set intraday on August 6, 2026, the day of the second-quarter earnings report.
The 52-week trading range is $8.92. Divided by the $18.27 closing price, that produces a range-to-price ratio of 48.82%, meaning the distance between the year’s high and low is nearly half of today’s share price. The stock sits at the 98.65th percentile of its range. The midpoint of the range is $13.93, and the September 28 close is 31.16% above that midpoint. The stock needs only a 0.66% gain to reach the 52-week high, and it is 92.93% above the 52-week low.
For a mature pharmaceutical company, a range this wide is unusual. It tells you the market repriced Viatris dramatically inside a single year, from a stock that traded below $10 to one that is challenging its post-merger highs. It also tells you that there is very little room left under the 52-week high as a reference point. Because the $9.47 low was set exactly one year before this report, it rolls out of the trailing window this week, and the 52-week low will rise modestly toward the $9.55 area. That changes the arithmetic, not the story.
Best-Case/Worst-Case Analysis
The best-case historical move is substantial. From its April 11, 2025 weekly low of $7.21, the stock has gained 153.4% to the September 28, 2026 close. From the September 29, 2025 low of $9.47, it has gained 92.9%, and even from the late March 2026 pullback low of $13.03, it has gained 40.2% in six months.
The worst-case historical moves are just as instructive. From the post-merger weekly high of $18.86 at the end of December 2020, Viatris fell to $8.43 by September 2022, a drawdown of 55.3%. From a February 2024 high of $13.62, it fell to $7.21 by April 2025, a drawdown of 47.1%, a stretch that included the Indore import alert and a weaker 2025 outlook. Inside the current uptrend, the stock fell 18.6% from a February 2026 high of $16.00 to its March 27, 2026 low of $13.03, and it fell 13.6% from the August 6, 2026 intraday high of $18.39 to its August 14 low of $15.88.
Historical gains are not forecasts, and historical losses are not predictions. What these figures show is that this stock has real capacity for movement in both directions, far more than its reputation as a dividend-paying drug company suggests. Position sizing and an exit plan matter here as much as they would in a technology name.
The condition that keeps the bull case alive is a sequence of higher lows supported by execution: the stock holding above the mid-September swing low near $16.15 while guidance stays intact, the supply disruption stays within its stated range and pipeline milestones arrive on schedule. The change of character that would invalidate the thesis is a close back below the August 14 low of $15.88, especially if it arrives alongside a guidance cut, a new FDA action at an India facility or a negative regulatory decision on fast-acting meloxicam. That would turn the staircase pattern into a lower high and a lower low, which is a different chart entirely.
The upside opportunity is substantial but contingent.
Relative Strength Comparison
Viatris has outperformed all four major U.S. benchmarks across every period measured, and the margin of outperformance has widened recently rather than narrowed. All figures are price returns through the September 28, 2026 close.
Returns are measured to the September 28, 2026 close from these starting closes: 1 Year, September 26, 2025; YTD, December 31, 2025; 3 Months, June 26, 2026; 1 Month, August 28, 2026; 1 Week, September 21, 2026. Nasdaq refers to the Nasdaq Composite and Dow refers to the Dow Jones Industrial Average.
This is a multi-period leader pattern with a recent acceleration. Over the past year Viatris has beaten the S&P 500 by about 76 percentage points, although much of that gain reflects how depressed the stock was a year ago. The more telling rows are the shorter ones. Over the past month, the S&P 500 was roughly flat, the Dow and the Russell 2000 fell, and Viatris rose 11.81%. Over the past week, every index declined while Viatris rose 6.84%. That is relative strength in the most useful sense: the stock is moving on its own story while the broad market pauses.
It is also worth noting what kind of strength this is. Viatris is a defensive, cash-generating, dividend-paying health care company, and its outperformance during a week of index weakness suggests some rotation toward that profile. Rotation can reverse as quickly as it arrives. Outperformance is not permanence, and a stock that has led for twelve months carries more crowding risk than one that has just begun to lead.
VantagePoint AI Predictive Blue Line
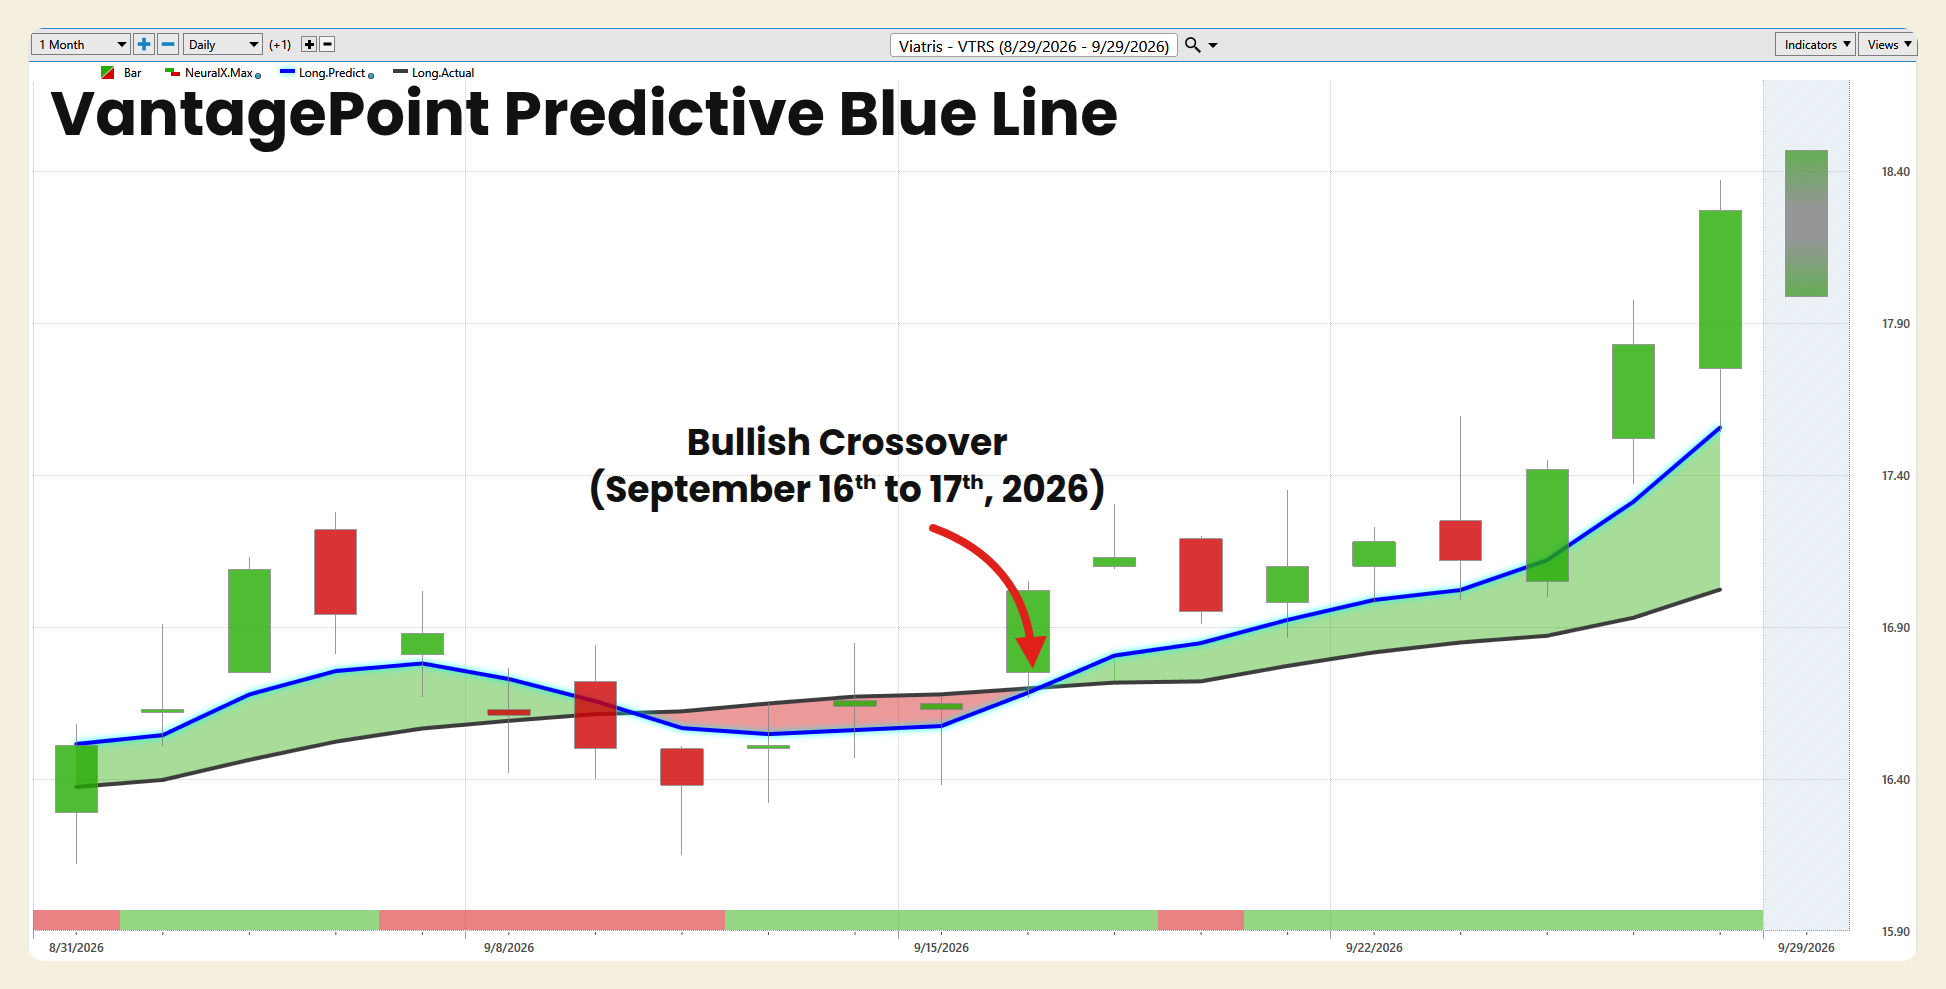
The VantagePoint AI Predictive Blue Line is a forecasted moving average that uses artificial intelligence to anticipate where the trend is heading, rather than simply reporting where it has been. The key reading is the relationship between the blue line and the black line, which represents the actual moving average of price. When the blue line is above the black line and rising, the forecast is pointing to strength ahead. When it crosses below, the forecast is warning of weakness.
The one-month chart shows one full cycle. From August 31 into early September, the Predictive Blue Line ran above the black line, shaded green, as the stock moved from $16.51 to $17.09. The blue line then rolled over and crossed below the black line between the September 9 and September 10 sessions, and the shading turned red. That warning arrived at the weakest point of the month: the stock closed at $16.38 on September 10 after trading as low as $16.15 intraday. The blue line then turned sharply higher with the 2.2% gain to $17.02 on September 16 and crossed back above the black line between the September 16 and September 17 sessions.
Since that bullish crossover, the chart has been decisively constructive. The green shading between the two lines has widened each session, and the slope of the blue line steepened sharply into September 28. At the end of the chart, the Predictive Blue Line reads approximately $17.55, while the black actual moving average reads approximately $17.02, a gap of about 3%. The stock has gained 7.3% from the September 16 close to the September 28 close, and 13.1% from the September 10 low.
The distinction matters. The red segment in the middle of the month shows the Blue Line doing what it is designed to do: flagging a short-term loss of momentum before price confirmed it, and then flagging the recovery early. The current reading is bullish, with a rising forecast and a widening separation. The reading that would change the picture is a flattening of the blue line followed by another cross below the black line, which is exactly the pattern that preceded the early-September pullback.
VantagePoint AI Neural Index
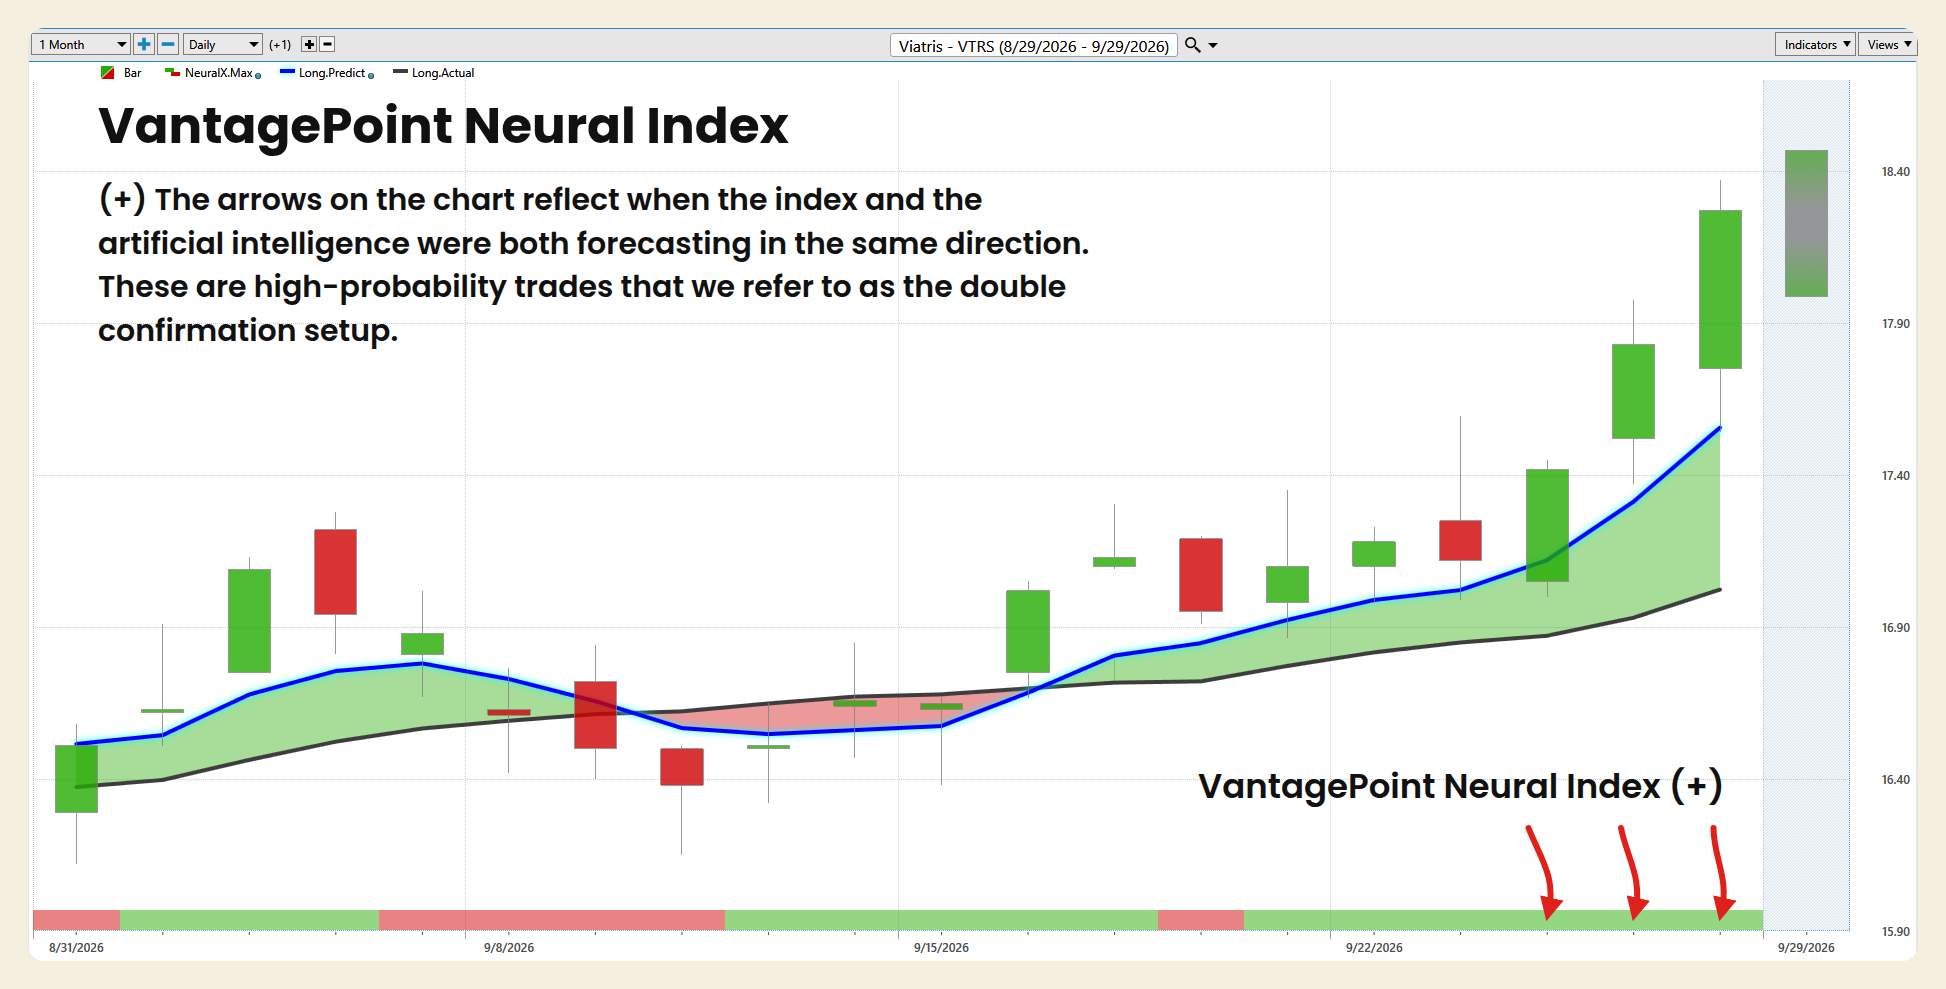
The VantagePoint AI Neural Index is a short-term strength indicator that forecasts whether the market is likely to be higher or lower over the next 48 hours. It appears as the colored strip along the bottom of the chart: green indicates predicted short-term strength and red indicates predicted short-term weakness.
Across the 20 trading sessions shown from August 31 through September 28, 2026, the Neural Index was green in 14 sessions and red in 6. The sequence reads as follows: red on August 31, green from September 1 through September 3, red for four sessions from September 4 through September 10, green for five sessions from September 11 through September 17, red on September 18, and green for six consecutive sessions from September 21 through September 28.
The pattern lines up closely with price. The four-session red stretch covered the slide from $16.94 to $16.38. The Neural Index turned green on September 11, the session after the low, and several sessions before the Predictive Blue Line crossed back above the black line. The single red reading on September 18 matched a 1.1% decline that day. The current six-session green run began September 21 and has coincided with the breakout from $17.10 to $18.27.
When the Neural Index and the Predictive Blue Line agree, the signal is stronger than either alone, and right now they agree. Both point to short-term strength. The item to watch is the first red reading, because the four-session red stretch in early September marked the month’s only meaningful pullback.
VantagePoint AI Daily Range Forecast
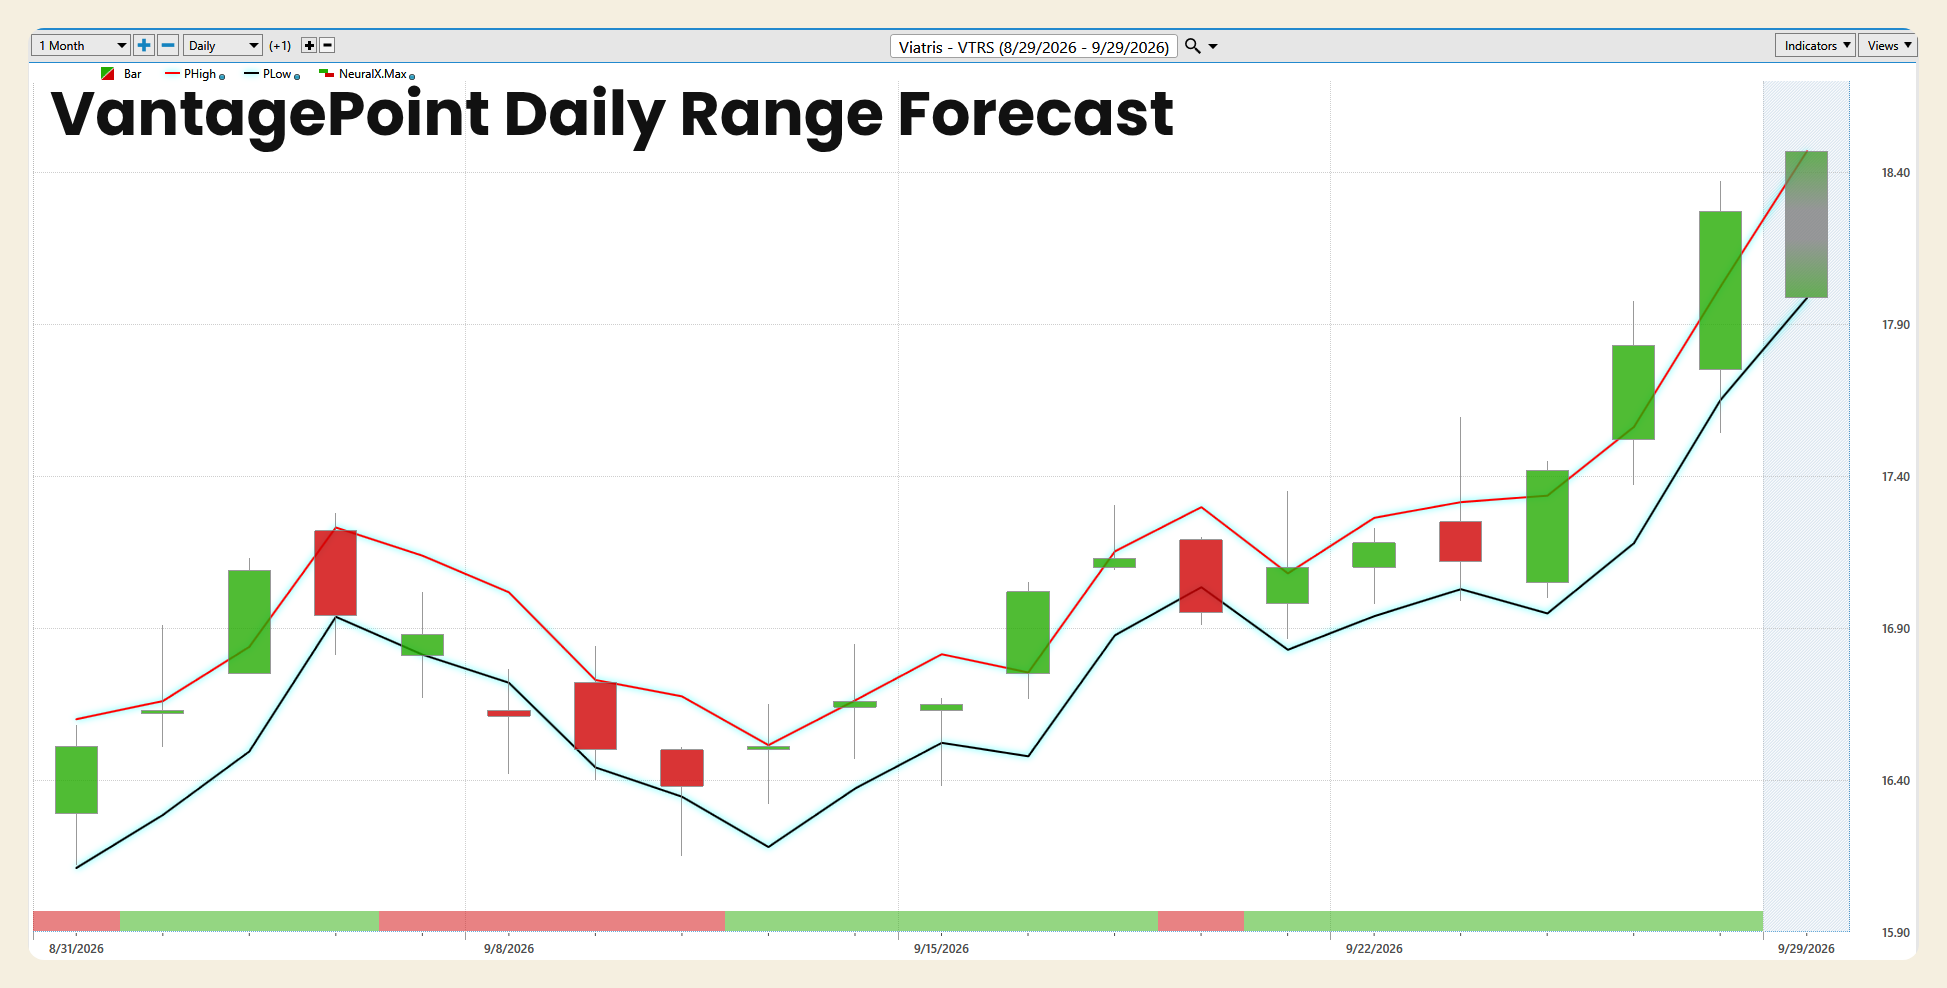
The VantagePoint AI Daily Range Forecast projects a predicted high and a predicted low for the next trading session. The red line marks the predicted high and the dark line marks the predicted low. Together they frame where price is expected to trade, giving traders a structure for entries, exits and stop placement.
For September 29, 2026, the forecast bar spans from a predicted high of approximately $18.47 to a predicted low of approximately $17.98, a projected range of about $0.49, or 2.7% of the September 28 close. That is in line with how the stock has actually traded: across the 20 sessions on the chart, Viatris’ average daily range was about 2.45% of its closing price. The September 28 close of $18.27 sits just above the midpoint of the projected band.
The more important observation is the direction of both boundaries. The predicted high and predicted low both turned higher around September 11 and have risen steeply through the end of the month, with the predicted high moving from roughly $16.50 to roughly $18.47 over that stretch. When both boundaries rise together, the forecast is describing a trending market rather than a range-bound one. The price bars have tracked that structure closely since mid-September, and the September 25 and September 28 sessions both closed above the predicted high, a sign of trend strength that also marks a stretched short-term zone.
For a trader, the practical use is straightforward. A pullback toward the predicted low, near $17.98 for September 29, would be a test of the short-term trend rather than a break of it. A close below the predicted low, especially on a day when the Neural Index turns red, would be the first sign that the rising structure is weakening. Upper-band closes near the predicted high are the zone where short-term traders tend to tighten stops rather than chase.
Intermarket Analysis
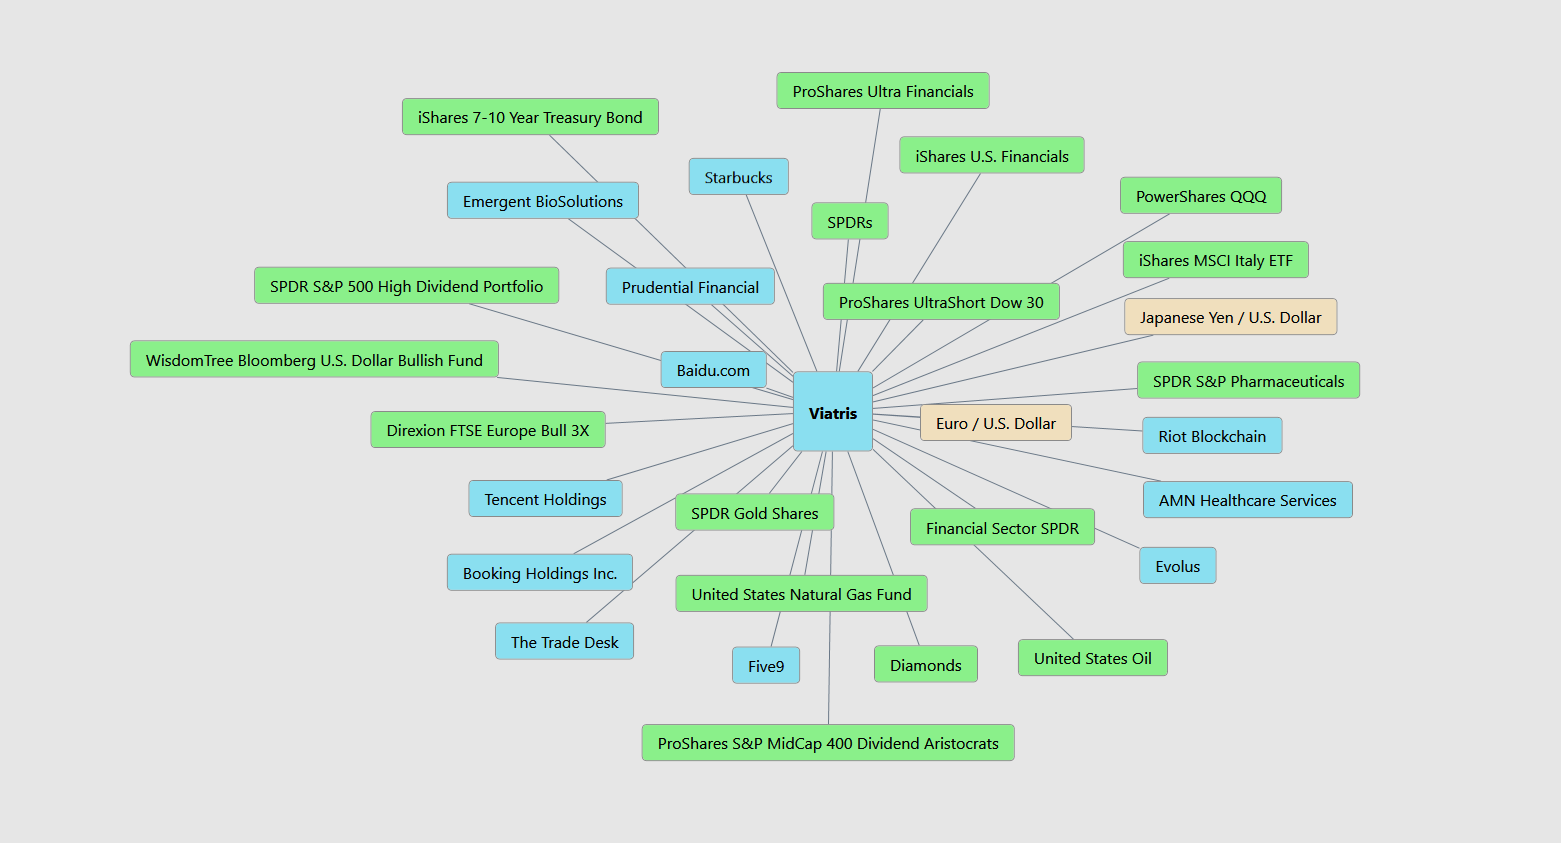
No stock trades in isolation. VantagePoint’s Intermarket Analysis identifies the related markets whose price behavior has the greatest influence on the forecast for a given stock, and it feeds those relationships into the AI models behind the readings above.
For Viatris, the map includes 11 U.S. stocks, 17 exchange-traded funds and 2 currency pairs. The U.S. stocks are Emergent BioSolutions, Starbucks, Prudential Financial, Baidu.com, Tencent Holdings, Booking Holdings, The Trade Desk, Five9, Riot Blockchain, AMN Healthcare Services and Evolus. The ETFs are the iShares 7-10 Year Treasury Bond fund, ProShares Ultra Financials, iShares U.S. Financials, SPDRs, PowerShares QQQ, the iShares MSCI Italy ETF, the SPDR S&P 500 High Dividend Portfolio, ProShares UltraShort Dow 30, the WisdomTree Bloomberg U.S. Dollar Bullish Fund, Direxion FTSE Europe Bull 3X, SPDR S&P Pharmaceuticals, SPDR Gold Shares, the Financial Sector SPDR, the United States Natural Gas Fund, Diamonds, United States Oil and the ProShares S&P MidCap 400 Dividend Aristocrats. The currency pairs are the Japanese yen against the U.S. dollar and the euro against the U.S. dollar.
Several of these groups line up with what a trader would expect for this company. SPDR S&P Pharmaceuticals, Emergent BioSolutions, Evolus and AMN Healthcare Services are health care and pharmaceutical markets, and they help the model separate a sector move from a company-specific one. The dividend-oriented funds, the S&P 500 High Dividend Portfolio and the MidCap 400 Dividend Aristocrats, reflect the income profile that has attracted a new group of holders to Viatris. The Treasury bond fund connects to interest rates, which matter for a company carrying about $11.6 billion of long-term debt and competing for income-oriented capital.
The currency and international entries are particularly relevant. Viatris generates most of its revenue outside the United States, and its second-quarter 2026 revenue grew 5% on a reported basis against 3.5% operationally, a gap that reflects currency translation. The yen maps to the JANZ segment, the euro and the Europe and Italy funds map to the European half of Developed Markets, and Baidu and Tencent are China-listed technology leaders that track the same Chinese economy where Greater China, Viatris’ fastest-growing segment, does business. The broad index funds, the financial sector funds, the dollar fund, commodities and Riot Blockchain, a proxy for speculative risk appetite, round out the macro backdrop.
The distinction matters. Intermarket Analysis does not claim that any one of these markets moves Viatris on a given day. It recognizes that a global pharmaceutical company is exposed to currencies, rates, sector rotation and risk appetite simultaneously, and it lets the AI weigh those influences together rather than asking a trader to track 30 charts by hand.
 Our Suggestion
Viatris is a company where two honest stories are true at the same time. The first is a business that has shrunk for four years, reports GAAP losses, depends heavily on Indian manufacturing that has drawn repeated FDA scrutiny and just took another write-down in the second quarter. The second is a business generating roughly $2 billion of free cash flow a year, trading at about 7.3 times the midpoint of its adjusted earnings guidance, paying a steady dividend, reducing debt, retiring shares and heading into the most catalyst-dense stretch in its short history. The market has spent the last year deciding that the second story deserves more weight, and the stock has nearly doubled as a result.
That is the trade in one sentence: Viatris is being rerated from a shrinking, write-down-prone generics company into a cash-generating platform with a real pipeline, and the rerating holds only as long as execution keeps showing up in the numbers.
There is one more piece of context that traders should weigh before acting on the current momentum, and that is the calendar.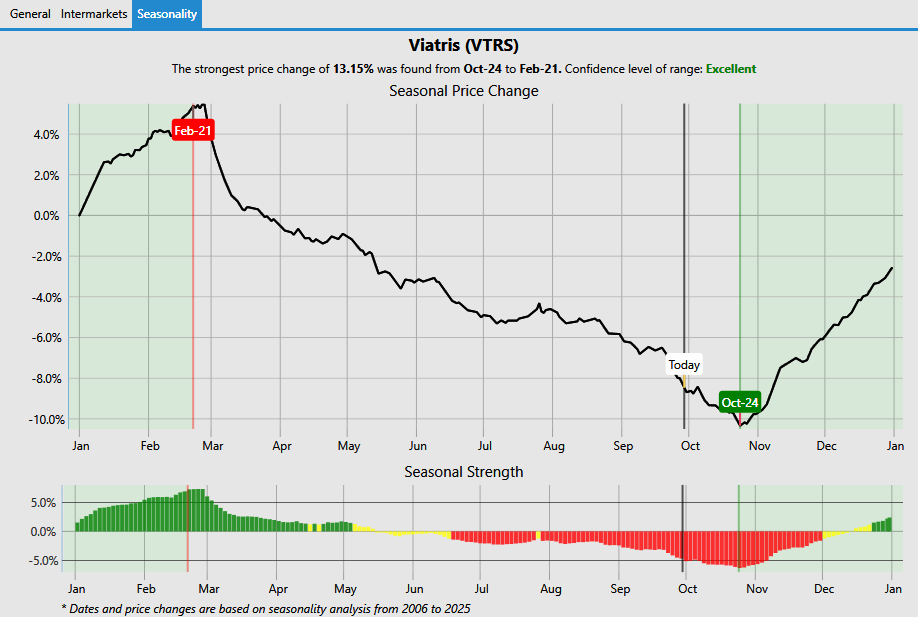
VantagePoint’s seasonality analysis, based on price history from 2006 through 2025, finds that the strongest seasonal price change for this stock was a gain of 13.15% from October 24 to February 21, with a confidence level rated Excellent. The chart also shows that the stock has historically been weak from mid-June through November, with the Seasonal Strength readings at their most negative in late September and October, and the seasonal curve bottoming near October 24. Today’s marker sits inside that weak window. In other words, the current rally is running against the stock’s typical seasonal tendency, and the historically favorable window does not open until late October, shortly before the November 5 earnings report. Seasonality describes historical tendencies, not a guarantee of future behavior, and a strong company-specific story can override it. It does argue for patience and for respecting the short-term, rather than assuming the trend continues unbroken.
Taken together, the VantagePoint readings are aligned in a way worth noting. The Predictive Blue Line crossed back above the black line in mid-September and has widened its lead since, reading about $17.55 against $17.02 at the end of the chart. The Neural Index has printed green for six consecutive sessions and 14 of the last 20. The Daily Range Forecast shows both boundaries rising steeply, with a projected band of approximately $17.98 to $18.47 for September 29. The short-term forecasting tools are pointing in the same direction as the relative strength data.
The risks are equally clear. The stock is at the 98.65th percentile of its 52-week range and less than 1% below a high that failed once already in August. The seasonal window may be unfavorable until late October. Two separate manufacturing issues in India remain unresolved, and the next earnings report on November 5 will be the first to show the full second-half supply impact. Momentum is not safety, and a stock that can gain 153% from its lows can also give back a large share of that gain quickly.
For traders, the disciplined approach is to let the VantagePoint readings define the risk rather than the headlines. A Neural Index turning red, a flattening Predictive Blue Line or a close below the predicted low would each be a reason to consider tightening risk. A close back below the August 14 low of $15.88 could indicate that the character of the trend has changed. Until then, the evidence favors respecting the uptrend while keeping position size modest enough to absorb a normal pullback.
Historical returns, seasonal tendencies and technical signals are not guarantees of future results. They are tools for framing probability and managing risk.
Practice great money management on every trade, and use the VantagePoint AI Daily Range Forecast to identify short-term trading opportunities while keeping risk firmly under control.
It’s not magic.
It’s machine learning.
Disclaimer: THERE IS A HIGH DEGREE OF RISK INVOLVED IN TRADING. IT IS NOT PRUDENT OR ADVISABLE TO MAKE TRADING DECISIONS THAT ARE BEYOND YOUR FINANCIAL MEANS OR INVOLVE TRADING CAPITAL THAT YOU ARE NOT WILLING AND CAPABLE OF LOSING.
EXAMPLES ARE SUCCESS STORIES AND ATYPICAL. PAST RESULTS DO NOT GUARANTEE FUTURE PERFORMANCE.
VANTAGEPOINT’S MARKETING CAMPAIGNS, OF ANY KIND, DO NOT CONSTITUTE TRADING ADVICE OR AN ENDORSEMENT OR RECOMMENDATION BY VANTAGEPOINT AI OR ANY ASSOCIATED AFFILIATES OF ANY TRADING METHODS, PROGRAMS, SYSTEMS OR ROUTINES. VANTAGEPOINT’S PERSONNEL ARE NOT LICENSED BROKERS OR ADVISORS AND DO NOT OFFER TRADING ADVICE.