




This week’s AI stock spotlight is Bank of America ($BAC)
Bank of America has been around so long that it has survived wars, recessions, inflation, deflation, politicians, economists, and television financial commentators. That last one may be the greatest accomplishment. It began in 1904 as Bank of Italy and expanded aggressively after World War II through acquisitions, including NationsBank. The company evolved into a universal banking powerhouse after buying Merrill Lynch during the 2008 financial crisis and now serves millions of consumers and businesses in more than 35 countries. If money is the fuel of capitalism, Bank of America owns one of the country’s largest gas stations.
Bank of America is not simply a bank. It is really four businesses wearing the same suit. Consumer Banking collects deposits, issues credit cards, writes mortgages, and finances automobiles. Global Wealth and Investment Management oversees trillions of dollars in client assets through Merrill and Private Bank, while Global Banking lends money to corporations and governments. Global Markets trades stocks, bonds, currencies, and derivatives for institutional clients.
Those four businesses work together remarkably well. Consumer deposits provide inexpensive funding for the rest of the company. Corporate relationships generate investment banking business, while wealth management creates recurring fee income. Trading desks benefit whenever markets become exciting enough that everyone else starts panicking. In other words, the bank makes money whether customers are buying homes, issuing bonds, trading stocks, or simply leaving cash in checking accounts.
The company is headquartered in Charlotte, North Carolina. Brian Moynihan continues leading the company after more than a decade of steady rebuilding. Bank of America employs roughly 213,000 people worldwide. Its primary competitors include JPMorgan Chase, Wells Fargo, Citigroup, Goldman Sachs, and Morgan Stanley. Among traditional commercial banks, only JPMorgan consistently ranks ahead of Bank of America across most major businesses.
One mistake traders frequently make is believing banks are simply interest rate bets. They are not. Net interest income remains the largest earnings driver, but investment banking, trading revenue, wealth management fees, and payment activity all contribute meaningful profits. When volatility increases, Wall Street often assumes banks suffer. Ironically, Bank of America’s trading desks frequently throw a party.
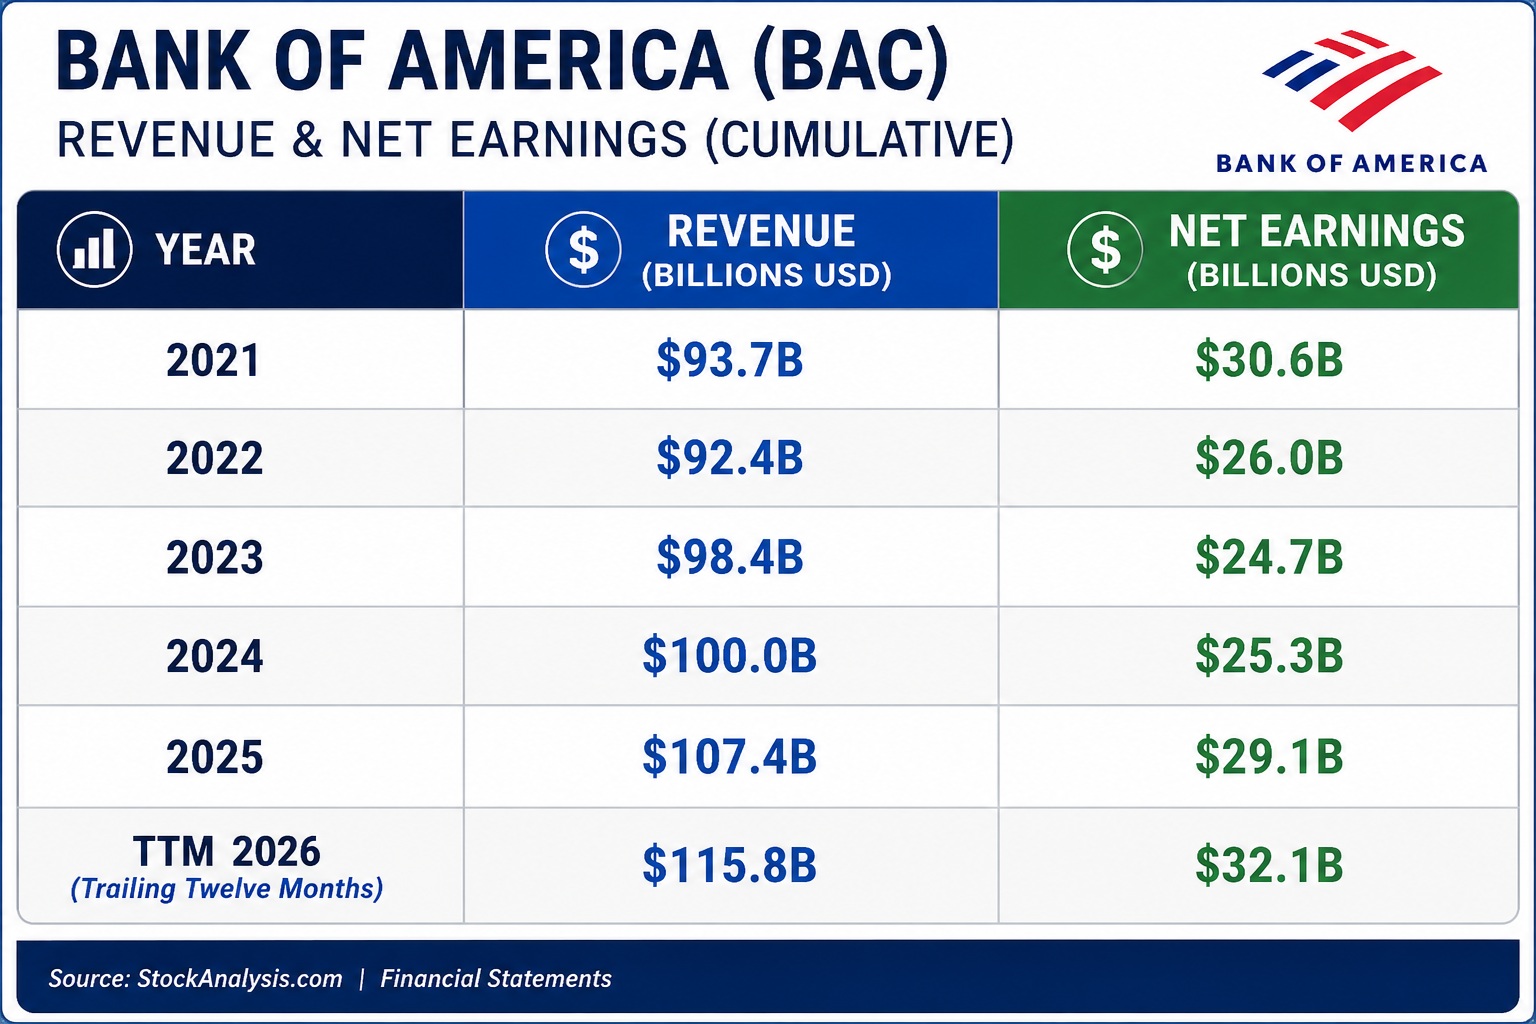
Financially, the story has quietly improved over the past several years. Revenue has increased from approximately $93.7 billion in 2021 to more than $107 billion in 2025, while trailing twelve month revenue now exceeds $115 billion. Net income recovered from the unusually profitable post-pandemic period and now exceeds $32 billion on a trailing twelve month basis. These are not startup numbers. They represent industrial-scale cash generation.
Banks naturally carry enormous debt because customer deposits appear as liabilities on the balance sheet. That often scares inexperienced investors. It should not. Professional traders focus on capital ratios, loan quality, liquidity, and credit losses instead of total liabilities. Bank of America continues returning capital through dividends and share repurchases while maintaining capital levels comfortably above regulatory requirements.
Right now traders are asking two important questions. The first is whether net interest income has peaked after several years of changing Federal Reserve policy. The second is whether investment banking activity has entered another sustained expansion fueled by mergers, acquisitions, IPOs, and corporate financing. Both questions will determine whether earnings continue growing over the next several quarters. Those answers will largely shape the stock’s next major move.
Most of the important news during the past month came from second-quarter earnings. Bank of America reported revenue of $31.6 billion and net income of $9.1 billion, comfortably ahead of Wall Street expectations. Trading revenue surged, investment banking fees jumped sharply, and consumer spending remained resilient. Management also projected net interest income toward the upper end of previous guidance. Those results reinforced investor confidence that the earnings recovery remains intact.
The earnings beat itself is already reflected in today’s stock price. What may still be underestimated is operating leverage. Expenses have remained relatively disciplined while revenue continues accelerating. That combination allows earnings to grow faster than sales. Wall Street consistently rewards companies that discover how to make more money without dramatically increasing expenses.
The stock’s advance over the past 90 days has been driven by three major themes. First, fears of a consumer credit collapse never materialized. Second, capital markets activity recovered faster than expected. Third, investors rotated into financial stocks as confidence in economic growth improved. Those same themes continue supporting the stock today.
Loan demand has improved while consumer spending remains surprisingly healthy. Investment banking has strengthened, and record trading activity has created another earnings tailwind. Financial stocks have broadly outperformed as investors recognized banks were benefiting from stronger business conditions rather than merely surviving them. Compared with the Financial Select Sector SPDR ETF, Bank of America has benefited from sector rotation as well as stronger company-specific execution. Better profitability and improving fee income have given investors reasons to own Bank of America instead of simply buying the entire financial sector.
Most analysts remain optimistic because earnings estimates continue moving higher. That optimism is generally supported by improving fundamentals. However, analysts sometimes assume favorable credit conditions will continue indefinitely. Banks always appear safest near the top of the credit cycle. History repeatedly reminds investors that loan losses eventually return.
The upside case is straightforward. Continued economic expansion, healthy consumer spending, stronger corporate activity, improving capital markets, and disciplined expenses could all push earnings above current expectations. The downside case is equally clear. Credit quality could deteriorate, unemployment could rise, commercial real estate could weaken, or Federal Reserve policy could compress lending margins. Traders should weigh both possibilities instead of focusing only on recent earnings.
The largest long-term concern remains the securities portfolio accumulated during the low interest rate period. Much of that portfolio still carries significant unrealized losses because interest rates increased rapidly. Most of these securities are government backed and are expected to mature without credit losses. However, they reduce financial flexibility and earn below-market returns. This remains one of the bank’s biggest long-term challenges.
Credit quality deserves close attention. Banks rarely experience problems overnight. Loan losses usually build gradually before becoming obvious. Commercial real estate, consumer credit, and unemployment remain the areas traders should monitor most closely. Banking is ultimately a confidence business.
The biggest upside surprise would be a multiyear rebound in mergers, acquisitions, IPOs, and capital markets activity. Those businesses generate attractive fee income without requiring substantial lending risk. The biggest blind spot remains credit quality. Investors often become so focused on quarterly earnings beats that they overlook changing credit conditions. Credit problems usually develop slowly, then all at once.
Most investors think Bank of America is simply benefiting from higher interest rates. That explanation misses most of the story. Net interest income remains the largest earnings driver, but several powerful businesses are contributing simultaneously. Investment banking has recovered, trading revenue has reached record levels, and wealth management continues producing recurring fee income. Management is also reducing the share count through aggressive stock repurchases, allowing earnings per share to grow even faster.
Instead of depending on one engine, Bank of America now has several engines producing profits at the same time. That diversification helps explain why the company has outperformed many of its competitors. The next major catalyst will be third-quarter earnings on October 14, 2026. Investors will focus heavily on net interest income guidance and credit quality. Federal Reserve policy and continued strength in capital markets will remain the other major drivers.
Bank of America is best suited for traders who prefer steady compounders over lottery tickets. This is not a company that usually doubles overnight. It is a company that quietly compounds earnings until Wall Street notices the math has changed. For the rally to continue, consumer spending, credit quality, and investment banking activity must all remain healthy. If rising loan losses, weaker lending guidance, deteriorating commercial credit, and slowing deal activity begin appearing together, traders should pay far more attention to the exits than the headlines.
The following are the indicators and forecasts that we will use in this stock study to better comprehend the price action of $BAC.
Wall Street Analysts Ratings and Forecasts
52-Week High and Low Boundaries
Best-Case / Worst-Case Scenario Analysis
VantagePoint AI Predictive Blue Line
Neural Network Forecast (Machine Learning)
VantagePoint AI Daily Range Forecast
Intermarket Analysis
Our Suggestion
Patented artificial intelligence gives us an advantage. It does not give us permission to stop asking questions. Every VantagePoint analysis looks beyond the forecast to determine whether the market’s momentum is supported by lasting fundamentals or short-lived enthusiasm.
Wall Street Analysts Price Forecasts
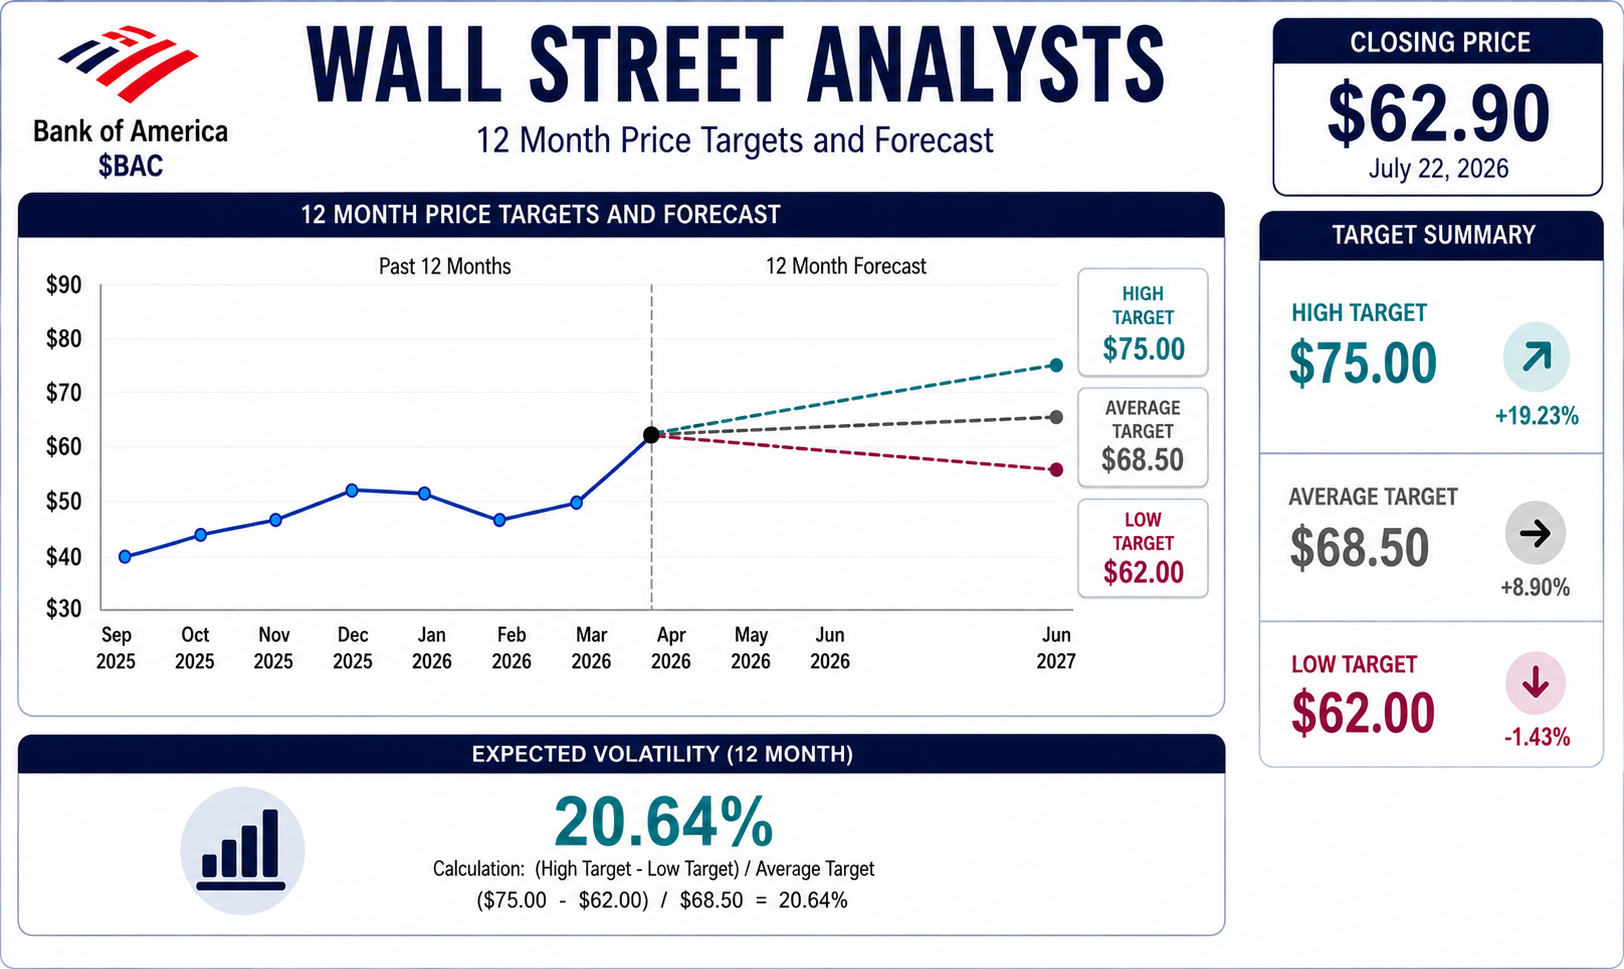
Wall Street’s view on Bank of America is surprisingly optimistic, but not wildly enthusiastic. The average analyst expects the stock to reach $68.50 over the next twelve months, implying an 8.9% gain from the current price of $62.90, while the most optimistic target reaches $75.00, nearly 19% above today’s price. On the other side of the ledger, the lowest published target is $62.00, suggesting that even the most cautious analysts see relatively limited downside. That narrow spread tells us something important. Wall Street largely agrees on where this company is headed, even if there is less agreement on how quickly it gets there.
The reason for that confidence is straightforward. Bank of America is no longer being viewed as a turnaround story, but as a consistently profitable financial institution benefiting from multiple earnings drivers. Net interest income remains healthy, investment banking has recovered, trading revenue has reached record levels, and management continues returning billions of dollars to shareholders through dividends and aggressive share repurchases. Those factors have steadily improved earnings expectations, making analysts increasingly comfortable projecting moderate, rather than spectacular, upside.
For traders, the consensus forecast is less important than the message behind it. Analysts are not predicting explosive gains because much of the company’s operational improvement has already been recognized by the market. Instead, they are signaling confidence that Bank of America can continue producing dependable earnings growth with relatively limited downside risk. That is often the profile institutions prefer, a high-quality compounder with improving fundamentals rather than a speculative turnaround or momentum stock.
The real catalyst now is execution. If management continues delivering stronger earnings, stable credit quality, disciplined expense control, and healthy capital markets activity, Wall Street’s price targets will likely move higher over time. Conversely, any deterioration in loan quality, weaker net interest income guidance, or slowing investment banking activity would probably result in analysts trimming their estimates. At this stage of the cycle, Bank of America does not need dramatic surprises. It simply needs to continue doing what it has been doing remarkably well.
52-Week High and Low Boundaries
Here’s something experienced traders understand that beginners often miss.
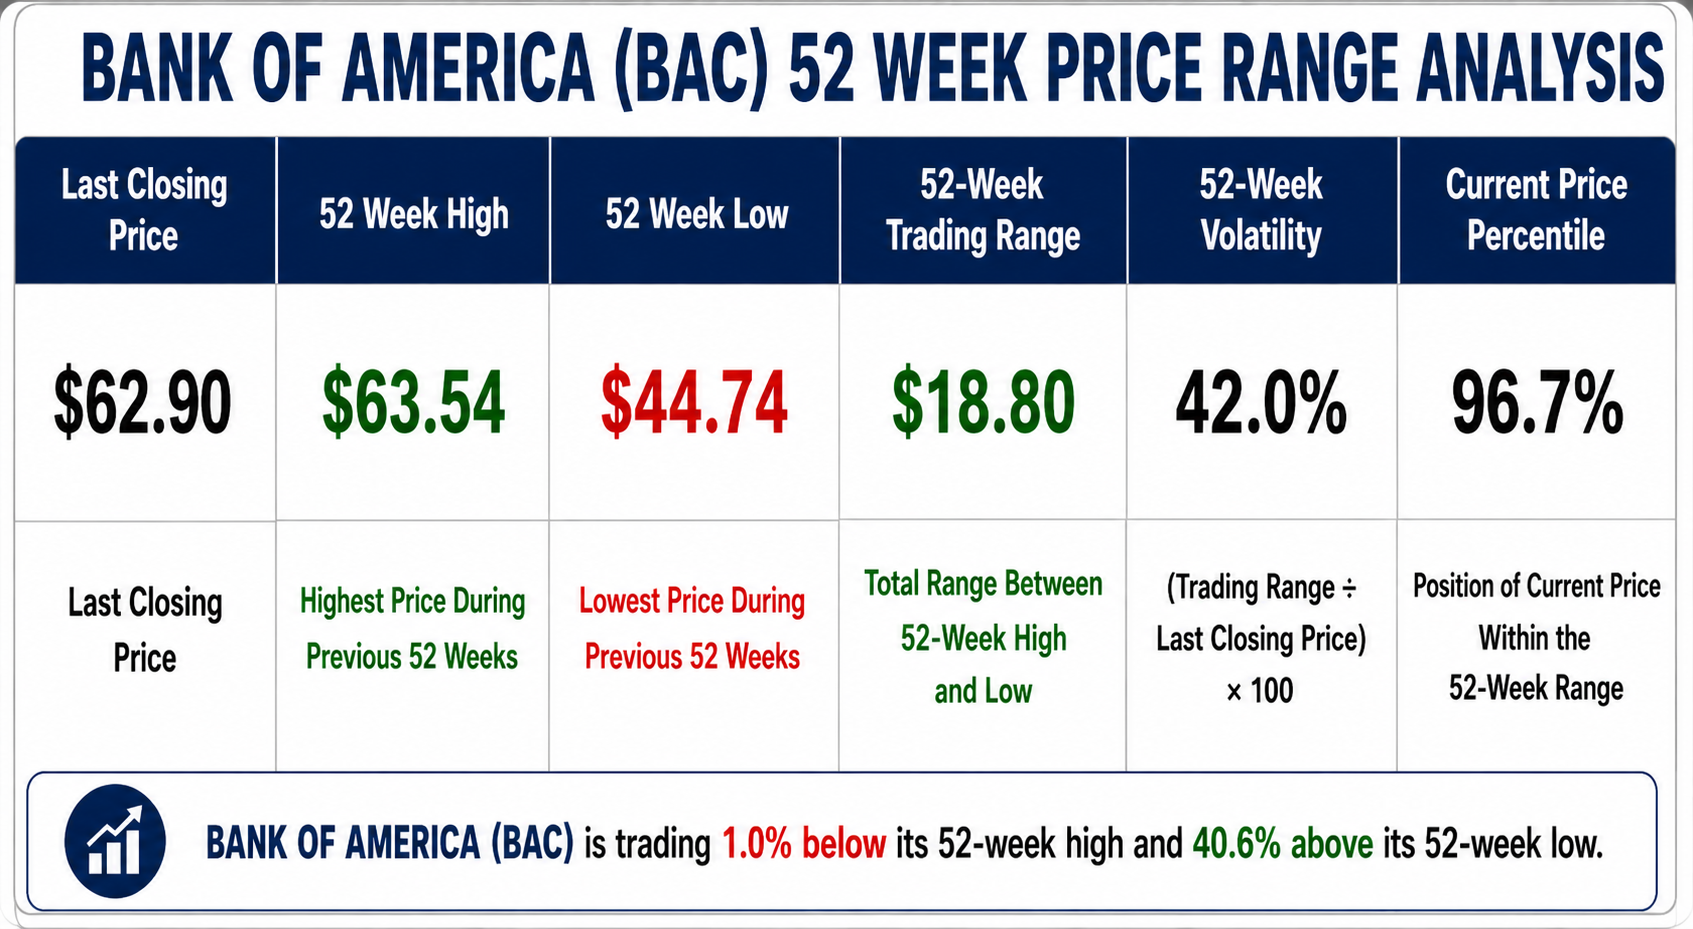
A stock making a new 52-week high is not automatically expensive. More often than not, it is expensive for a reason. Bank of America is closing at $62.90, just 1.0% below its 52-week high of $63.54. That tells you buyers have been willing to keep paying higher prices throughout the past year instead of taking profits and walking away. Strong stocks have a habit of staying strong far longer than most people expect.
Now look at the other end of the range. The 52-week low sits at $44.74, meaning BAC has rallied more than 40% from its lowest point during the past year. That is not the kind of move you usually see in a company that is struggling. It suggests investors have steadily gained confidence in improving earnings, healthier credit conditions, stronger investment banking activity, and rising profitability. Institutions rarely accumulate millions of shares by accident.
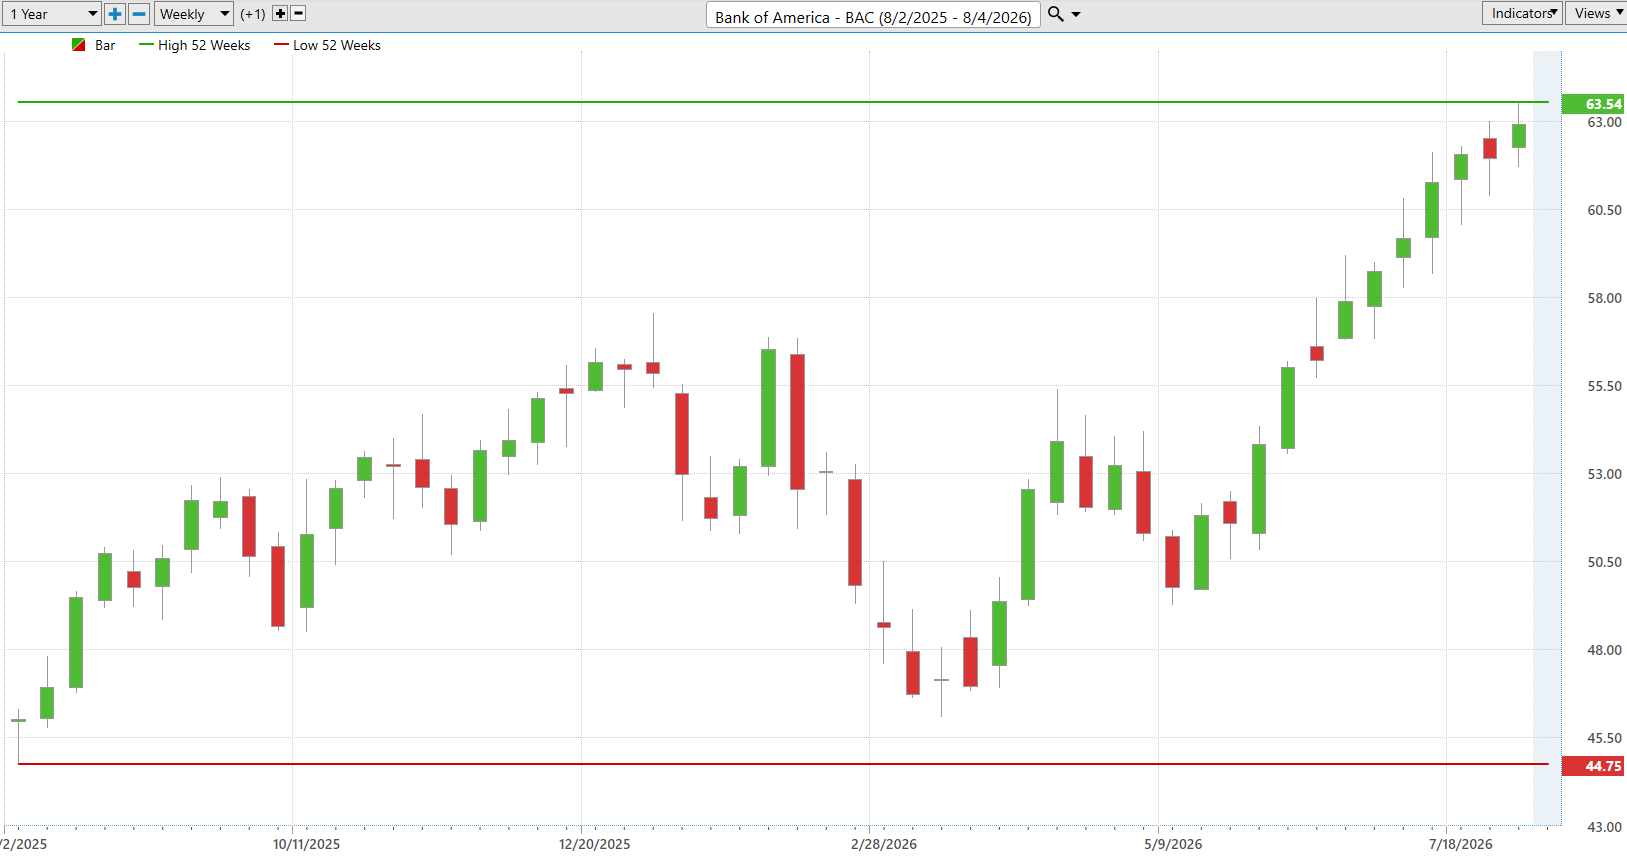
The weekly chart tells an equally important story. Since bottoming near its annual low, the stock has built a series of higher highs and higher lows, the classic fingerprint of an established uptrend. Even the periodic pullbacks have been relatively shallow before buyers stepped back in. That is exactly what healthy trends look like. Instead of collapsing after reaching new highs, BAC has spent recent weeks consolidating near the top of its range, a sign that buyers remain in control.
The biggest lesson is not that Bank of America is close to a new high. The lesson is that strong stocks often spend much of their time near their highs because demand continues overwhelming supply. Many investors wait for large pullbacks that never arrive. Professional traders recognize that leadership stocks frequently pause, catch their breath, and then continue climbing as long as the underlying business keeps delivering stronger earnings.
Our view remains constructive. A stock trading in the 97th percentile of its 52-week range deserves attention because it tells you where institutional money has been flowing. As long as earnings continue improving, credit quality remains healthy, and the broader financial sector stays supportive, Bank of America appears positioned to challenge and potentially exceed its previous 52-week high. Until the chart begins producing lower highs, deteriorating momentum, or clear signs of institutional selling, the trend deserves the benefit of the doubt.
Best-Case/ Worst-Case Scenario Analysis
Every stock has two stories unfolding at the same time. One is the story investors hope will happen. The other is the story risk managers prepare for. Bank of America is no different. The two charts illustrate just how quickly sentiment can change, even when the long-term trend remains healthy.
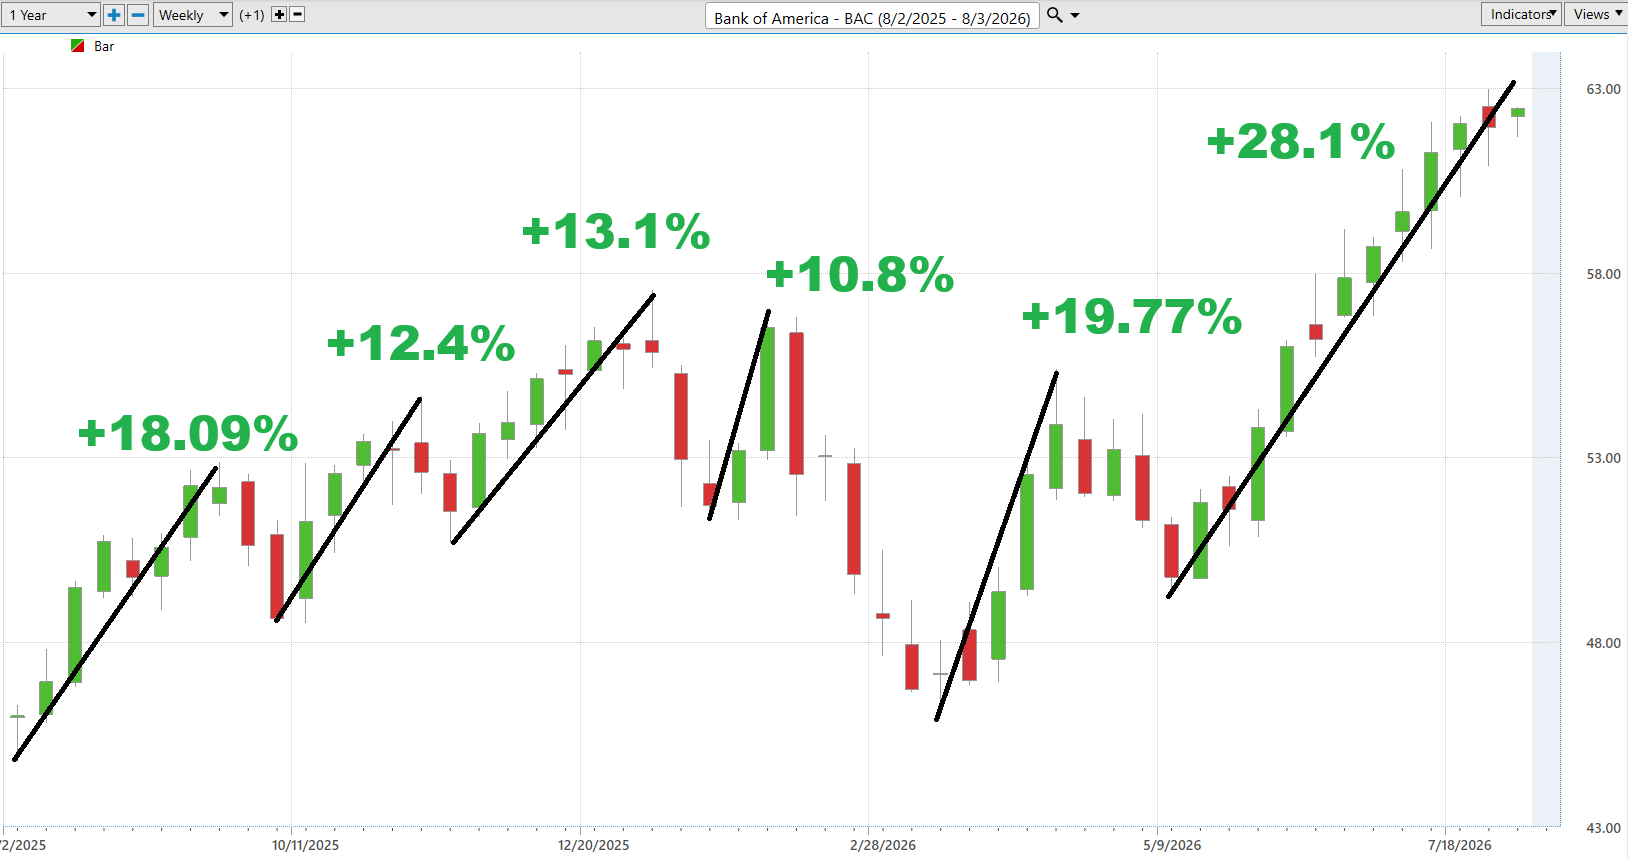
The best-case scenario is difficult to ignore. During the past year, every meaningful pullback eventually attracted buyers, producing rallies ranging from 10.8% to 28.1%. The current advance is the strongest of the group, carrying the stock from its spring low to within striking distance of a new 52-week high. That is exactly what institutional accumulation looks like. Buyers have consistently stepped in before fear had a chance to become panic, suggesting confidence in the company’s improving earnings outlook and the broader financial sector.
The message behind those rallies is important. Institutions are not chasing headlines. They are responding to stronger fundamentals, including rising net interest income, recovering investment banking activity, healthy consumer credit, disciplined expense management, and continued share repurchases. As long as those drivers remain intact, every orderly pullback has the potential to become another buying opportunity rather than the beginning of a prolonged decline.
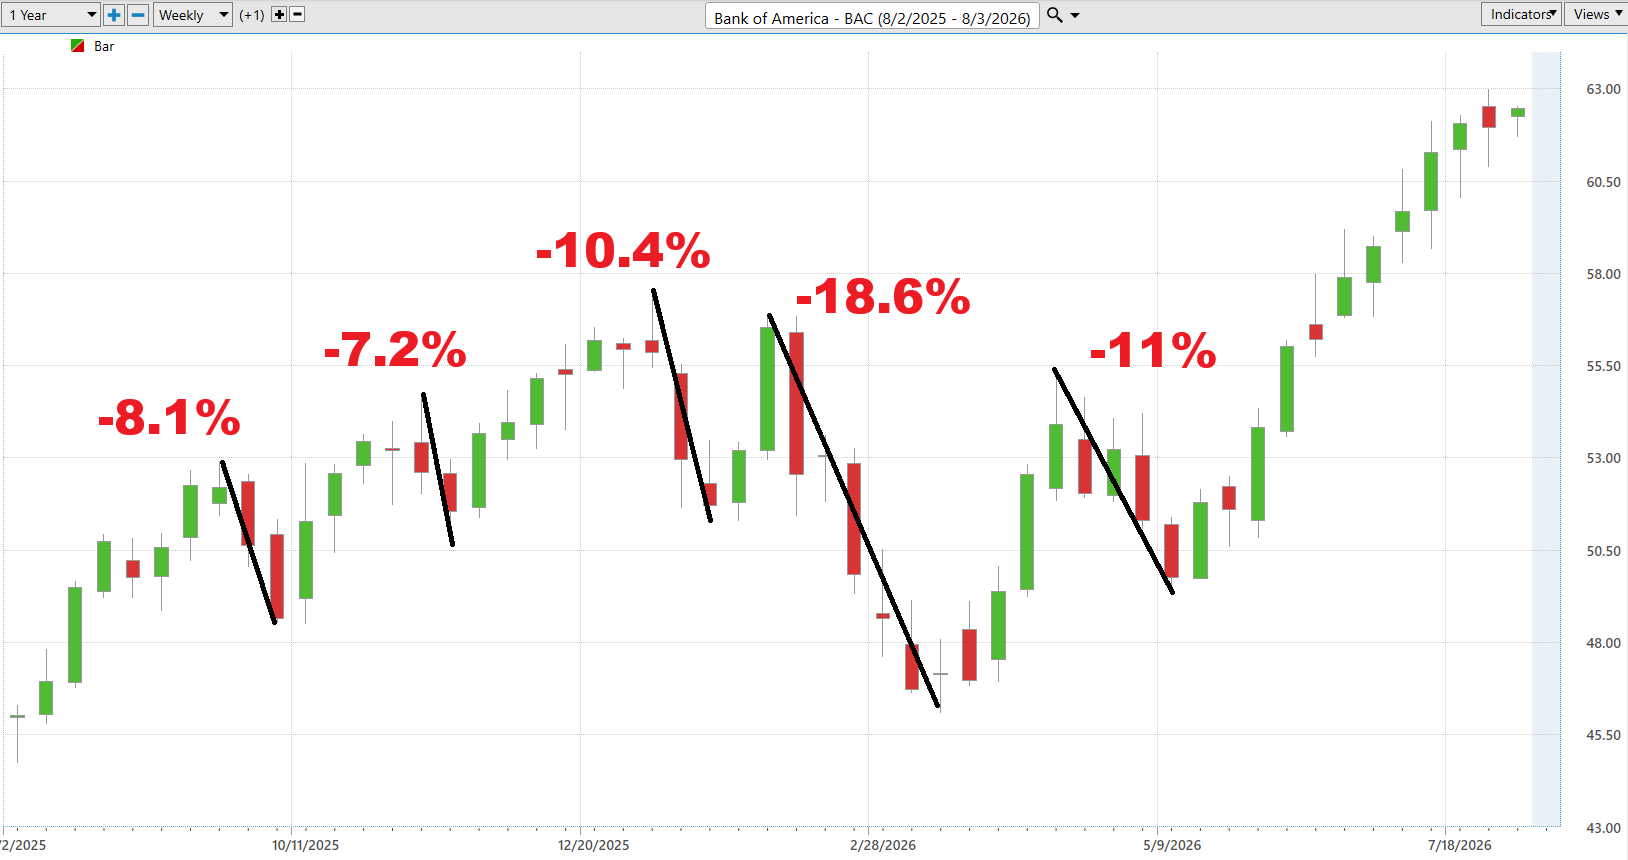
The worst-case chart delivers an equally valuable lesson. Even in a strong uptrend, Bank of America experienced corrections of 7.2%, 8.1%, 10.4%, 11.0%, and one much deeper decline of 18.6%. None of those pullbacks felt comfortable while they were happening. Each tested investor conviction. Yet every decline eventually gave way to another advance that carried the stock to higher highs.
That perspective matters because corrections are a normal cost of owning leadership stocks. Experienced traders understand that volatility is not the enemy. Permanent losses are. The objective is not to avoid every decline. The objective is to determine whether a decline reflects temporary profit-taking or a genuine deterioration in the company’s earnings outlook.
Today, the evidence still favors the bulls. Bank of America is trading less than 1% below its 52-week high while maintaining a clear pattern of higher highs and higher lows. Until that pattern changes, the primary trend remains constructive. Traders should expect periodic pullbacks, but unless those declines are accompanied by weaker earnings, deteriorating credit quality, or slowing capital markets activity, history suggests they are more likely to represent pauses in the trend than the end of it.
The takeaway is straightforward. The best-case chart reminds us how rewarding it can be to stay with a quality company during a sustained uptrend. The worst-case chart reminds us that even great stocks rarely move straight up. Successful traders prepare for both outcomes, respect risk, and allow the market, not emotion, to determine which story ultimately wins.
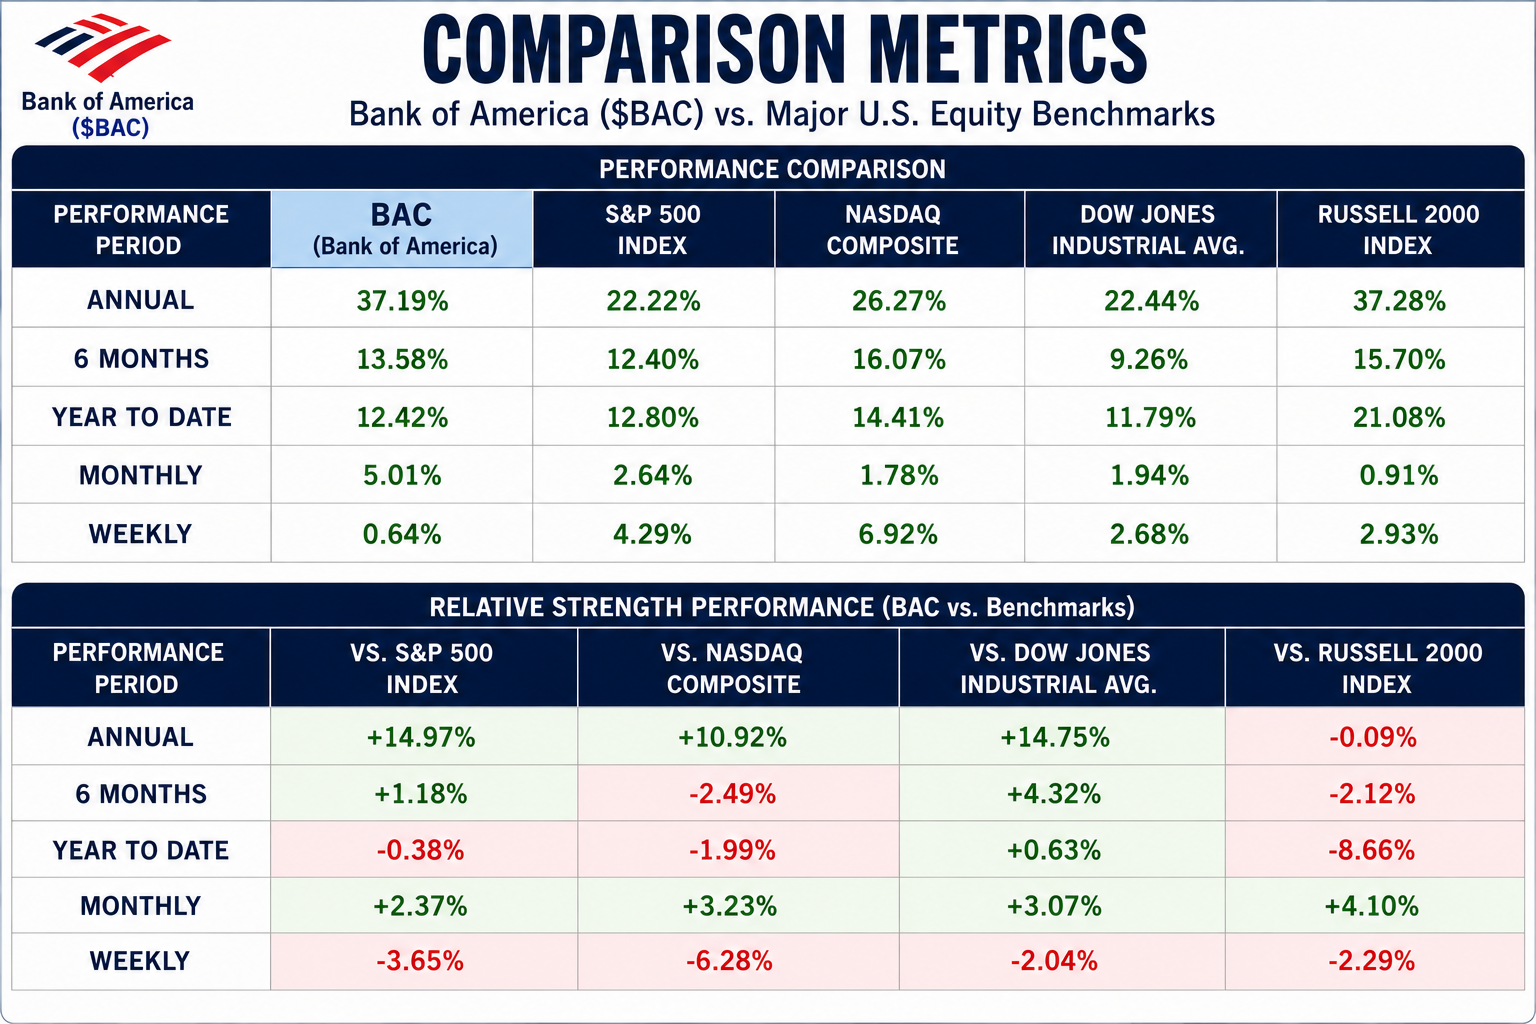
Price tells the truth long before headlines catch up. The comparison table shows that Bank of America has been quietly outperforming much of the market over the longer time frames, even though its short-term performance has cooled. That is exactly what leadership stocks often do after a strong advance. They pause, consolidate, and then wait for the next catalyst.
The one-year numbers tell the biggest story. Bank of America has gained 37.19%, easily outperforming the S&P 500 (+22.22%) and the Dow Jones (+22.44%), while also beating the Nasdaq (+26.27%) by nearly 11 percentage points. Only the Russell 2000 (+37.28%) has essentially matched BAC’s annual return. That tells us institutional investors have been rewarding large financial companies as earnings expectations improved throughout the year.
The intermediate trend remains encouraging. Over the past six months, BAC has slightly outperformed the S&P 500 and Dow Jones, although it has trailed the Nasdaq and Russell 2000 by a modest margin. Year-to-date performance paints a similar picture. BAC has remained competitive with the major averages, outperforming the Dow while only modestly trailing the S&P 500 and Nasdaq. That suggests leadership has broadened beyond financial stocks into other sectors, rather than indicating a deterioration in Bank of America’s underlying business.
The shorter-term numbers deserve attention because they reveal a change in momentum. During the past month, BAC has clearly regained leadership, outperforming every major benchmark by more than two percentage points. However, the weekly numbers show the stock lagging all four indexes. That is not necessarily a warning sign. After a stock rallies nearly to a new 52-week high, short periods of consolidation are common as investors lock in profits and new buyers wait for an attractive entry point.
The relative strength table reinforces the bigger picture. Bank of America has consistently beaten the S&P 500, Nasdaq, and Dow over the past year, demonstrating that its advance has been driven by company-specific execution, not simply a rising market. The only notable weakness appears in the very short term, where relative performance has softened. Unless that weakness begins extending into the monthly and six-month periods, it looks more like a pause in an established uptrend than the beginning of a meaningful reversal.
Our takeaway is constructive. Bank of America remains one of the stronger large-cap financial stocks because its long-term relative performance continues to favor the bulls. Traders should continue monitoring whether the recent weekly softness spreads into longer time frames. If the monthly and six-month relative strength numbers remain positive while earnings continue improving, the stock is well positioned to continue outperforming many of its peers and potentially challenge new highs.
Vantagepoint AI Predictive Blue Line
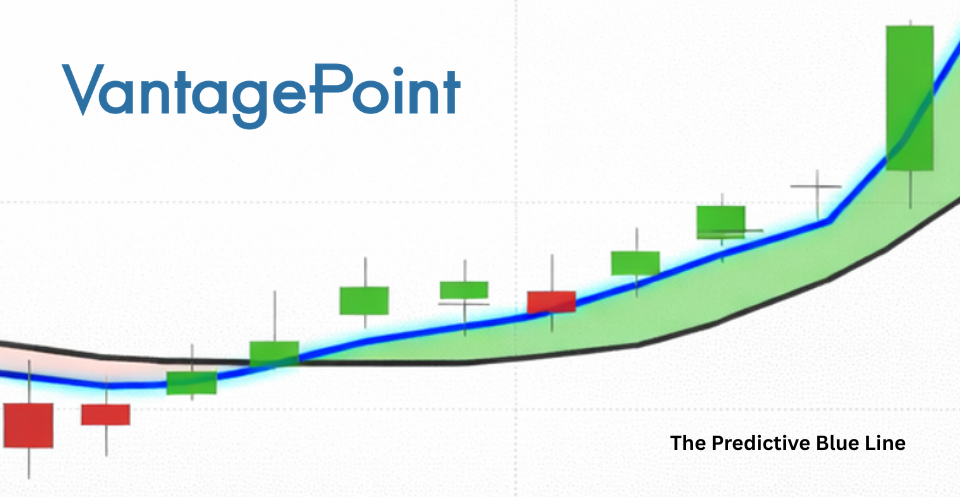
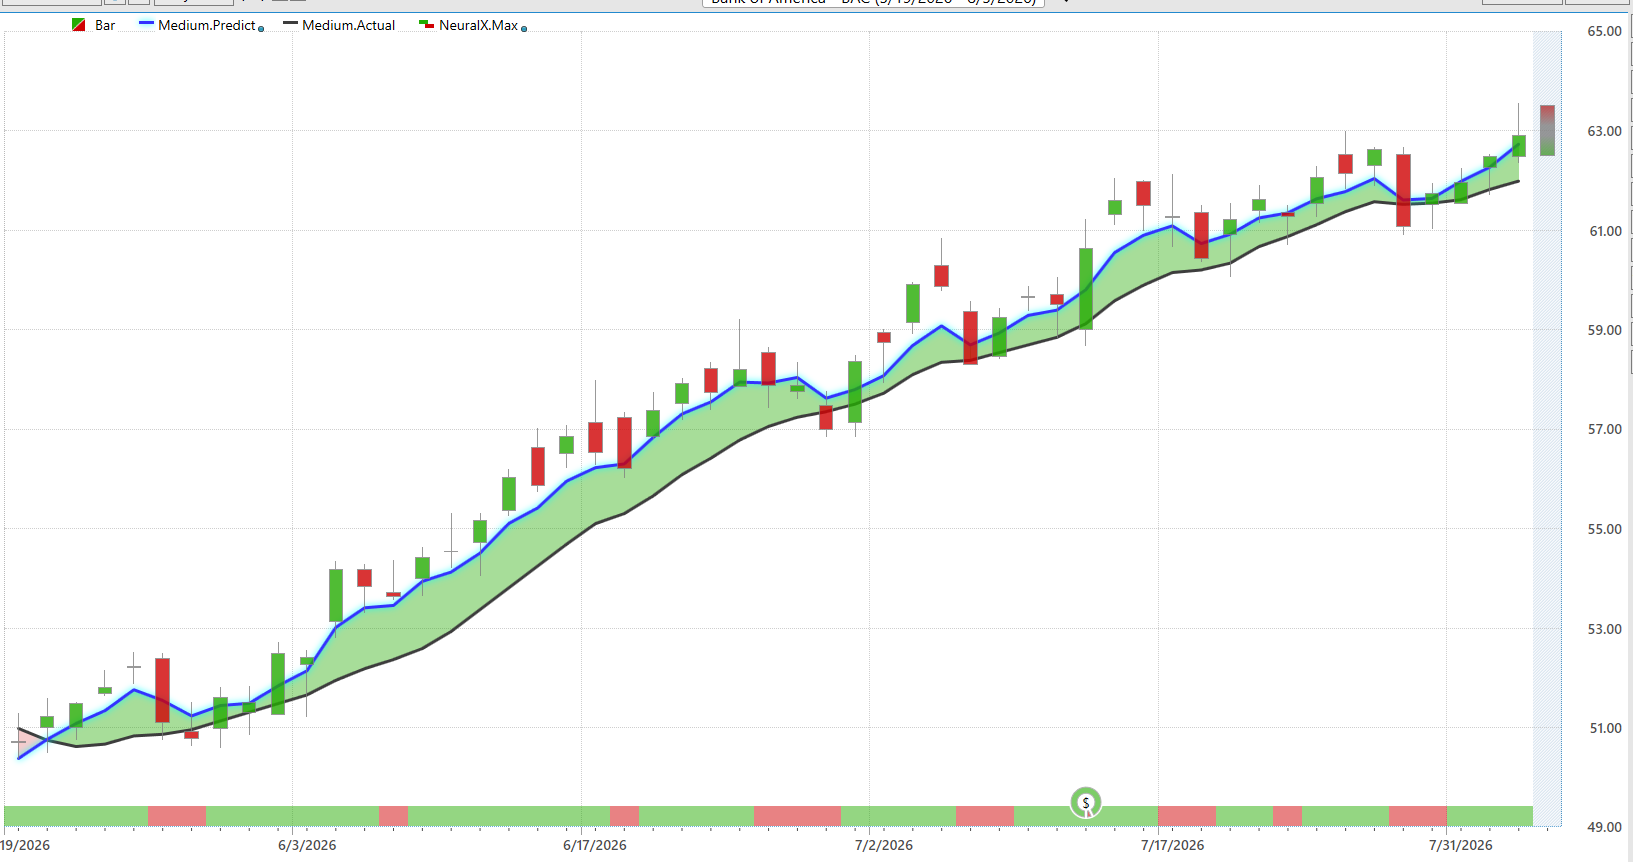
If Wall Street were a poker game, the Predictive Blue Line would be the one player quietly counting cards while everyone else argues about the last hand. Most traders spend their time staring at yesterday’s price. The Predictive Blue Line is trying to estimate where tomorrow’s trend is headed. That is a meaningful distinction because markets pay you for anticipating change, not admiring history.
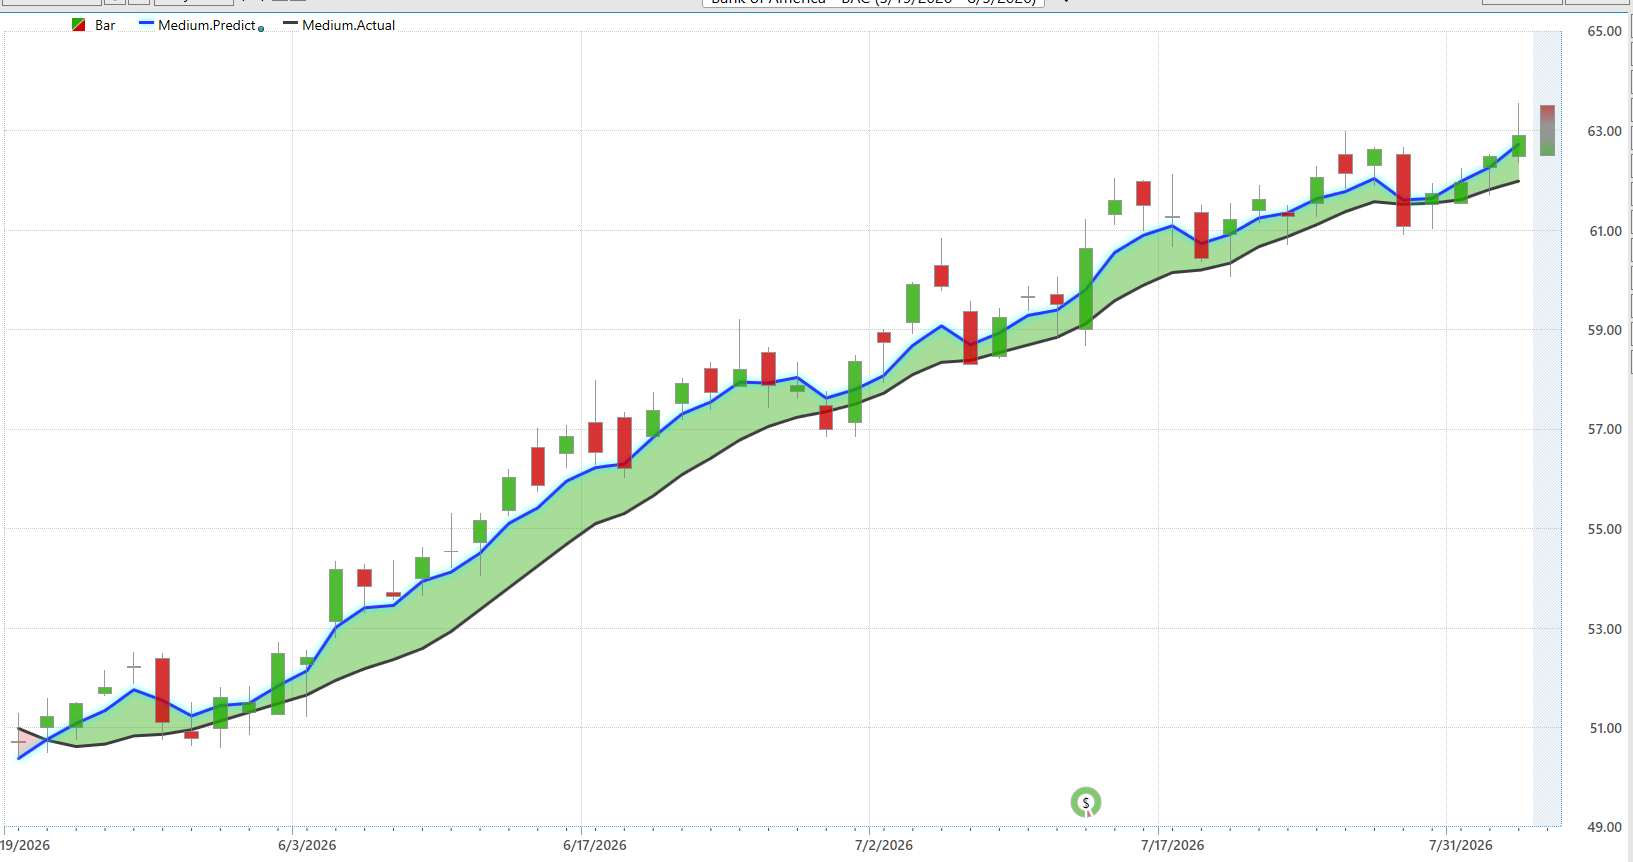
The chart currently tells a constructive story. The Predictive Blue Line remains above the simple 10 day moving average, and both lines continue sloping higher. More importantly, the gap between the two has remained positive throughout most of the advance, suggesting bullish momentum has been persistent rather than fleeting. Instead of racing higher in a speculative burst, the stock has climbed in a steady, orderly fashion. That is often the signature of institutional buying rather than emotional retail speculation.
There is another encouraging detail hiding in plain sight. Every time the blue line flattened or dipped slightly during the past two months, buyers stepped back in before the longer-term trend broke down. Those brief pauses became resting stops instead of reversals. Think of a mountain climber catching his breath before tackling the next section of the trail. The trend slowed, but it never lost its footing.
The green predictive zone between the two lines also remains intact, telling us the forecast continues to favor higher prices. That does not guarantee Bank of America will rise every day. Markets have an annoying habit of reminding us they can do whatever they please. It does suggest the underlying trend remains healthy, and that short-term weakness is still being absorbed without meaningful technical damage.
Our interpretation remains bullish, but disciplined. As long as the Predictive Blue Line stays above the actual moving average and both continue trending upward, the path of least resistance favors the bulls. A decisive crossover lower, accompanied by a flattening of both lines, would be the first indication that institutional momentum is beginning to fade. Until that happens, the chart continues to argue that Bank of America remains in an established uptrend, with the predictive indicators still leaning in favor of higher prices.
VantagePoint AI Neural Index
The Neural Index is designed to answer one question that every trader asks, whether they realize it or not. What are the odds the current trend continues over the next 48 to 72 hours? Instead of measuring how far the stock has already moved, the Neural Index looks for subtle shifts in market conditions that often appear before price reacts. Think of it as an early warning system rather than a rearview mirror.
The chart is sending a constructive message. Most of the recent Neural Index readings have remained green, indicating that the short-term probability continues to favor higher prices. While there have been a handful of brief red signals during the advance, they have been short-lived and quickly followed by renewed buying. That tells us the bears have managed to interrupt the trend, but they have not been able to reverse it.
One of the most encouraging features is how well the Neural Index agrees with the Predictive Blue Line. When both indicators point in the same direction, traders have what VantagePoint refers to as double confirmation. The Predictive Blue Line continues trending higher, and the Neural Index has returned to green after only brief interruptions. When two independent predictive indicators reach the same conclusion, traders typically have greater confidence in the prevailing trend.
The short periods of red should not be ignored. They remind us that even strong uptrends experience pauses, profit-taking, and temporary weakness. In this chart, however, each red signal was followed by buyers stepping back into the market before meaningful technical damage occurred. That pattern suggests institutional demand has remained strong enough to absorb selling pressure.
Our interpretation remains bullish. The current green Neural Index supports the existing uptrend and indicates that the near-term probability still favors higher prices over the next several trading sessions. As long as the Neural Index remains predominantly green while the Predictive Blue Line continues rising, the path of least resistance favors the bulls. A sustained shift to consecutive red readings, especially if accompanied by a flattening or declining Predictive Blue Line, would be the first indication that short-term momentum is beginning to weaken.
VantagePoint AI Daily Range Forecast
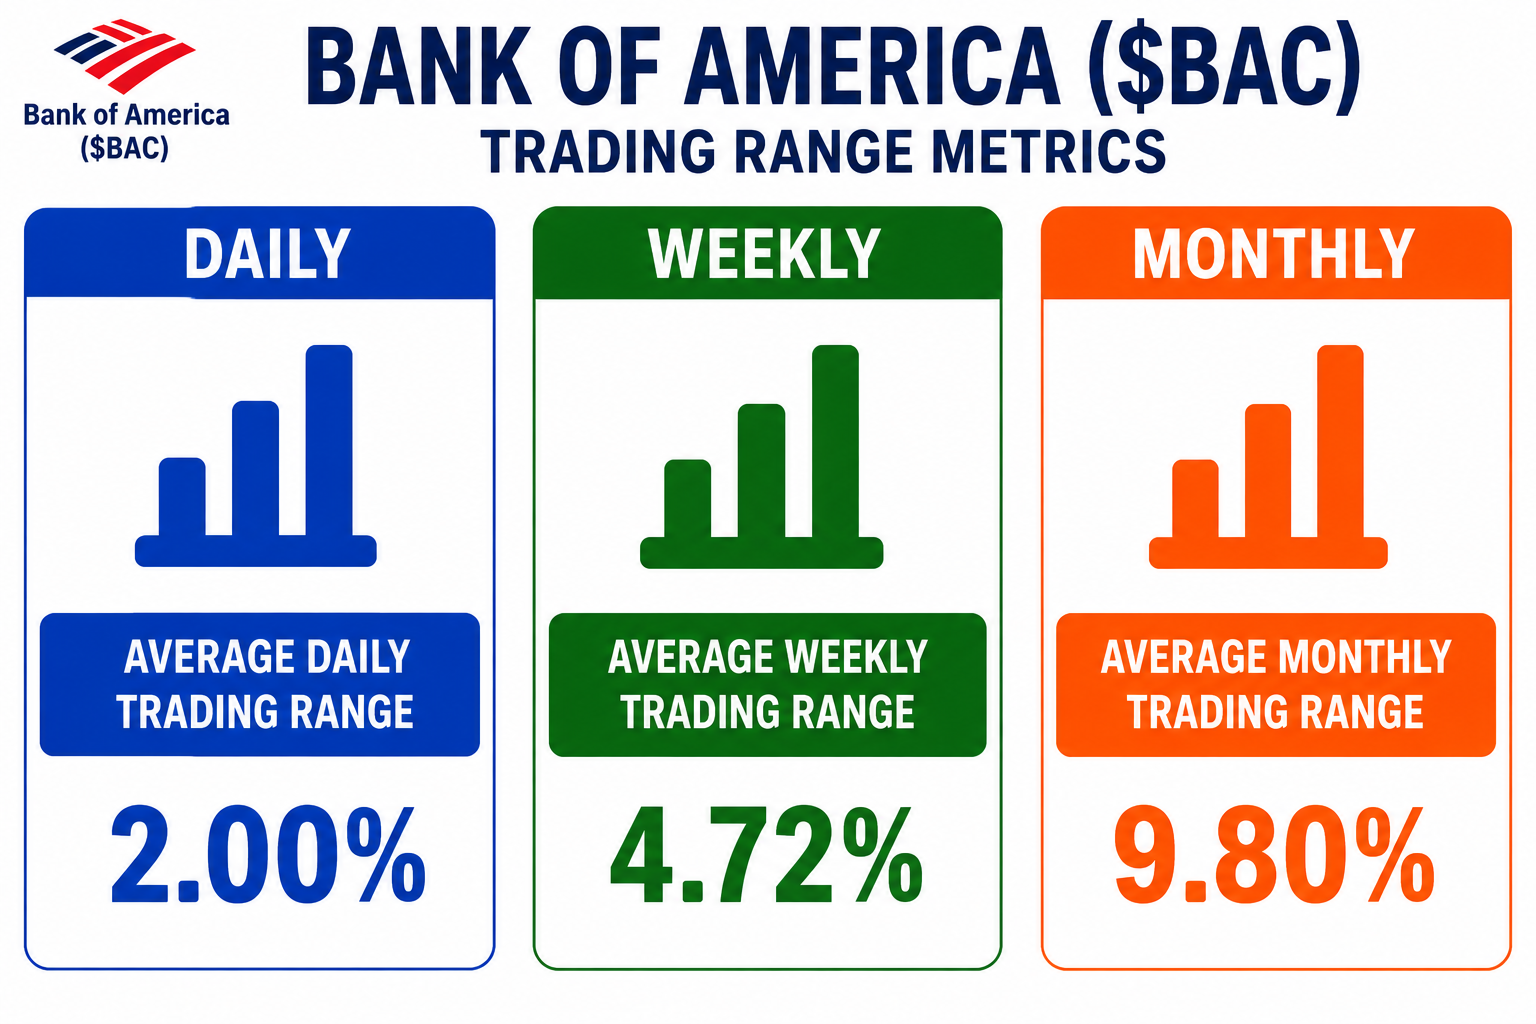
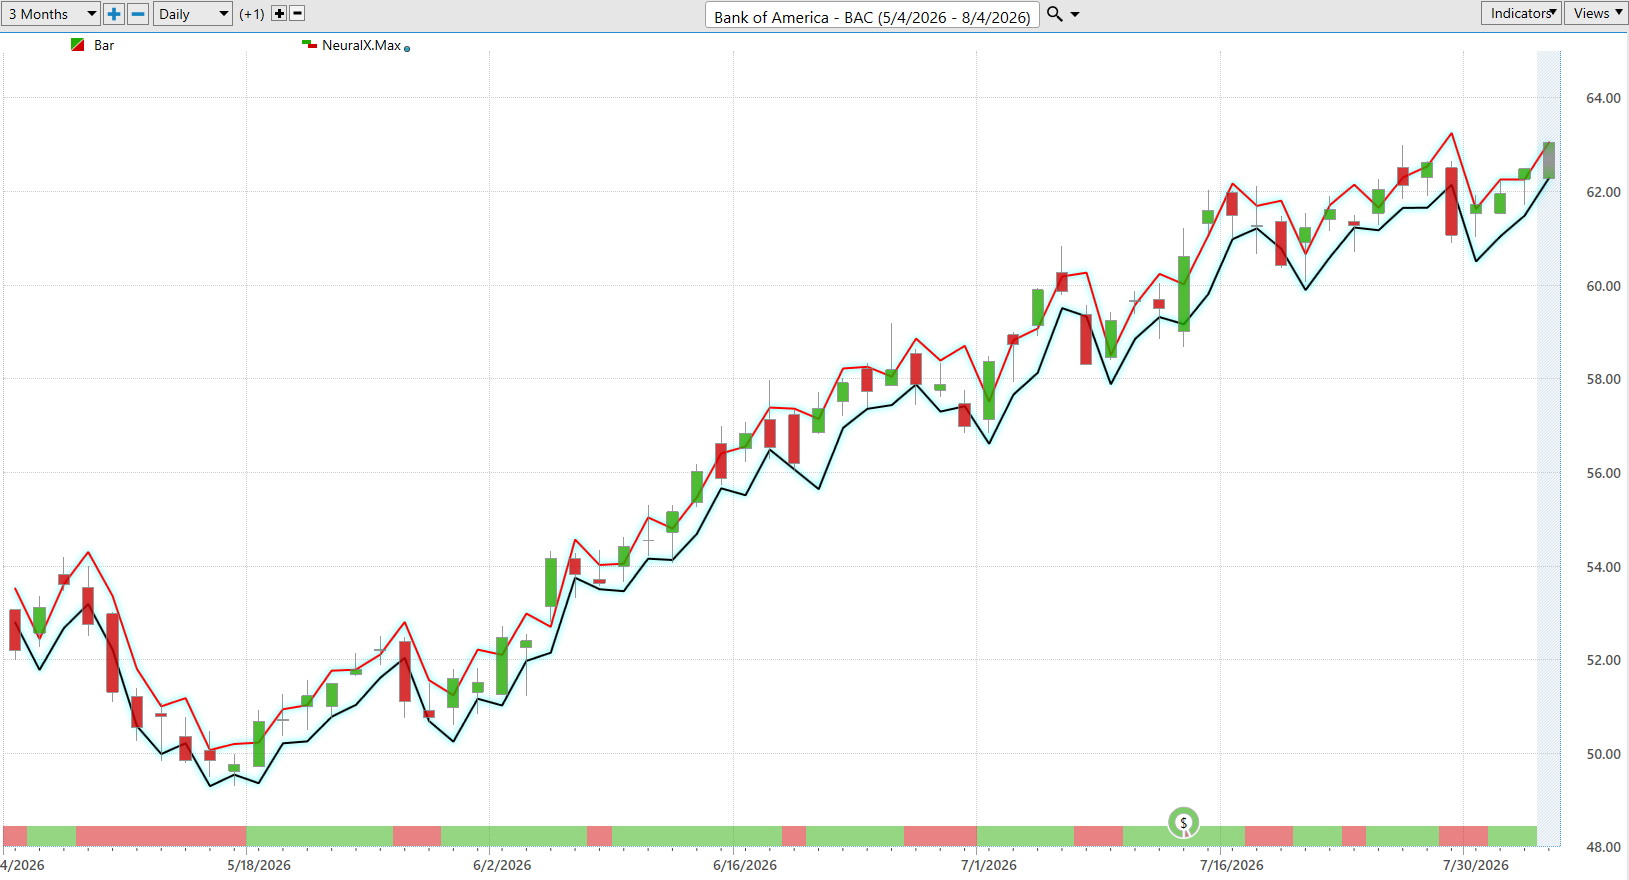
One of the biggest mistakes traders make is assuming tomorrow will look like yesterday. The Daily Range Forecast is built on the opposite idea. Instead of reacting to where the stock has been, it attempts to estimate the likely trading range before the next session begins. For active traders, that shifts the focus from prediction to preparation.
The current forecast remains constructive. The projected high and low continue to move upward alongside price, reinforcing the broader uptrend that has been developing for months. More importantly, the actual price bars have consistently respected the forecasted range, suggesting the model has remained well aligned with the market’s behavior. Rather than producing erratic swings, Bank of America has advanced in a series of orderly higher highs and higher lows. That type of price action is exactly what institutional accumulation often looks like.
There is another important takeaway from the chart. Although the stock has experienced several short-term pullbacks, each decline has remained contained within the broader forecast before buyers regained control. The forecast has adapted to those pauses without breaking the upward trajectory, indicating that the underlying trend remains healthy. In other words, weakness has looked more like normal profit-taking than evidence of a deteriorating market.
The Daily Range Forecast should not be viewed as a crystal ball. It is better thought of as a road map that helps traders define expectations before the market opens. When price continues trading within an upward-sloping forecast, it suggests buyers remain in control. A decisive break below the projected range, particularly if accompanied by weakening predictive indicators and consecutive bearish Neural Index signals, would be the first indication that the character of the trend is beginning to change.
For now, the evidence continues to favor the bulls. The forecast supports the broader message being delivered by the Predictive Blue Line and the Neural Index, namely that Bank of America’s intermediate trend remains intact. As long as the projected range continues climbing and price respects those boundaries, traders should view normal pullbacks as part of a healthy advance rather than assume every pause marks the beginning of a reversal.
VantagePoint AI Intermarket Analysis
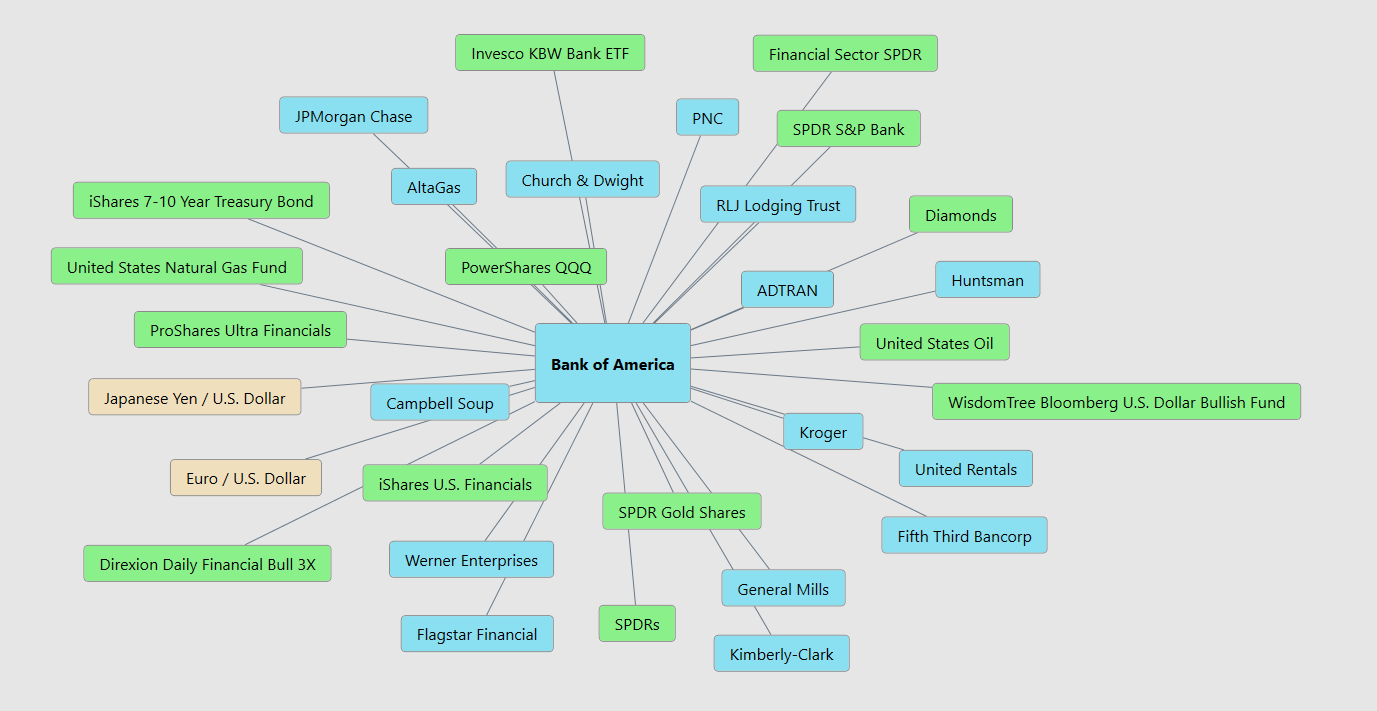
Bank of America does not trade in isolation. Its strongest drivers are interest rates, the banking sector, and the health of the U.S. economy. The intermarket map shows BAC closely tied to banking ETFs, Treasury bonds, the U.S. dollar, commodities, and major financial institutions, all of which influence investor expectations for future earnings.
Interest rates remain the single most important catalyst. Higher Treasury yields and a steeper yield curve generally increase Bank of America’s net interest income, allowing the bank to earn more on loans than it pays on deposits. The Financial Select Sector SPDR, KBW Bank ETF, and other banking ETFs reinforce this relationship. When the financial sector strengthens, BAC typically follows.
Economic growth is the second major driver. Strong employment, healthy consumer spending, and rising business investment increase loan demand while keeping credit losses under control. The dollar and commodity markets play supporting roles. A stronger dollar can pressure international operations, while higher oil prices often keep inflation and interest rates elevated, extending a favorable environment for bank profitability.
Overall, the intermarket picture remains constructive. Financial stocks continue to show relative strength, the economy remains supportive of lending activity, and the current interest-rate backdrop favors bank earnings. As long as those relationships remain intact, the intermarket evidence continues to support Bank of America’s bullish trend.
Our Suggestion
Bank of America has quietly transformed from a slow-growing traditional bank into one of Wall Street’s strongest earnings stories. The company is no longer relying on a single profit engine. Consumer banking, wealth management, investment banking, and trading are all contributing to rising profits at the same time. That diversification has helped BAC outperform many of its largest competitors while producing consistent earnings growth. The fundamental story remains firmly bullish.
For traders, the most important takeaway is that BAC is no longer a deep value play. It is an earnings momentum stock supported by improving fundamentals. Revenue continues growing, expenses remain well controlled, management is aggressively repurchasing shares, and Wall Street analysts continue raising earnings estimates. Those are exactly the characteristics institutional investors typically reward with higher valuations. The challenge is that much of this good news is already reflected in the current stock price.
The next several quarters will likely determine whether the rally has another leg higher. Traders should closely monitor net interest income guidance, consumer credit quality, commercial real estate exposure, and investment banking activity. If those four areas remain healthy, BAC has a realistic opportunity to continue outperforming both its banking peers and the broader financial sector. If they begin weakening together, the stock’s premium valuation could come under pressure much faster than many investors expect.
Our view remains constructive, but disciplined. We would rather own Bank of America on pullbacks into areas of support than chase extended rallies after strong earnings headlines. Momentum remains positive, earnings revisions continue moving higher, and management has demonstrated consistent operational execution. Those are characteristics that deserve respect, but successful traders also recognize that every great company can become overpriced for a period of time.
Overall, we believe Bank of America deserves a place on every trader’s watch list. It combines one of the strongest deposit franchises in the world with growing fee income, improving capital markets businesses, disciplined expense management, and shareholder-friendly capital returns. This is not the type of stock that usually doubles overnight. Instead, it is the kind of company that quietly compounds earnings year after year until Wall Street eventually notices the math has changed.
Practice great money management and always use the VantagePoint AI Daily Range Forecast to help identify favorable risk/reward opportunities.
It’s not magic.
It’s machine learning.
Disclaimer: THERE IS A HIGH DEGREE OF RISK INVOLVED IN TRADING. IT IS NOT PRUDENT OR ADVISABLE TO MAKE TRADING DECISIONS THAT ARE BEYOND YOUR FINANCIAL MEANS OR INVOLVE TRADING CAPITAL THAT YOU ARE NOT WILLING AND CAPABLE OF LOSING.
VANTAGEPOINT’S MARKETING CAMPAIGNS, OF ANY KIND, DO NOT CONSTITUTE TRADING ADVICE OR AN ENDORSEMENT OR RECOMMENDATION BY VANTAGEPOINT AI OR ANY ASSOCIATED AFFILIATES OF ANY TRADING METHODS, PROGRAMS, SYSTEMS OR ROUTINES. VANTAGEPOINT’S PERSONNEL ARE NOT LICENSED BROKERS OR ADVISORS AND DO NOT OFFER TRADING ADVICE.