


This week’s AI stock spotlight is DELL ($DELL)
Dell is one of those companies that Wall Street keeps trying to put out to pasture, only to discover that the horse has quietly purchased the ranch. Founded by Michael Dell in a University of Texas dorm room in 1984, built around the radical idea of selling computers directly to customers, transformed into an enterprise technology giant through acquisitions like EMC, survived multiple technology cycles that buried dozens of competitors, grew into a company generating well over $100 billion in annual revenue, and today sits squarely in the middle of the biggest AI infrastructure buildout since the internet itself. Dell matters because when corporations spend money on data centers, servers, storage, and AI hardware, Dell often gets a seat at the table.
The average investor still thinks Dell sells laptops to college students.
That is roughly like saying Boeing sells aluminum tubes.
Yes, Dell still sells PCs. Millions of them. But the real story is its Infrastructure Solutions Group. That division sells servers, storage systems, networking equipment, and increasingly the AI infrastructure needed to train and run large language models. The company has become one of the primary hardware suppliers in the AI gold rush. While Nvidia sells the shovels, Dell is increasingly selling the mining camps.
Dell operates through two major businesses. The Client Solutions Group handles PCs, workstations, monitors, and related products. The Infrastructure Solutions Group handles servers, storage, networking, and AI systems. The infrastructure side is where the excitement lives today because AI server demand has exploded. Revenue growth in that segment has dramatically outpaced the mature PC business.
Headquartered in Round Rock, Dell remains heavily influenced by founder Michael Dell. The company employs well over 100,000 people globally. Its customers range from small businesses to Fortune 500 companies, governments, universities, cloud providers, and AI startups. Competitors include Hewlett Packard Enterprise, Super Micro Computer, IBM, and countless cloud infrastructure providers. Dell’s competitive advantage is scale, customer relationships, logistics, and its ability to integrate complete systems rather than merely shipping components.
Financially, Dell is in a very different position than most traders assume.
Many traders see the debt and panic.
Others see the AI growth and ignore the debt entirely.
Both groups are wrong.
Dell generates enormous cash flow. Fiscal 2026 revenue reached approximately $113.5 billion, up 19% year over year, while earnings grew even faster. Operating cash flow exceeded $11 billion. The company continues returning capital through dividends and buybacks.
The debt load remains substantial because of past acquisitions, particularly EMC. However, Dell is not a fragile balance-sheet story. This is not a startup burning cash in pursuit of dreams and social media likes. It is a mature cash-generating machine. What traders often misunderstand is that Dell’s valuation is increasingly being driven by future AI infrastructure revenue rather than traditional PC sales. The market is no longer valuing Dell like a computer company. It is valuing Dell like an AI infrastructure company.
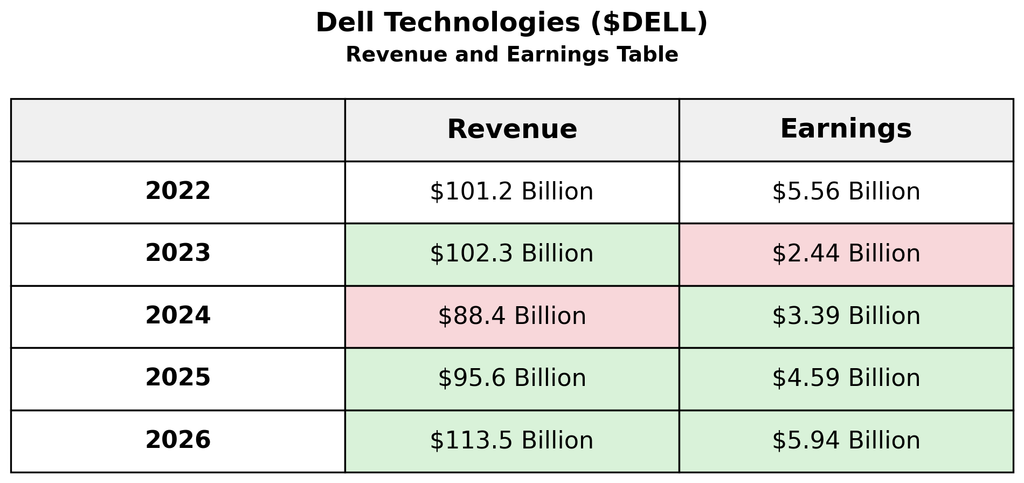
There is a fascinating story hidden inside these numbers. From 2022 through 2024, Dell looked like a mature technology company fighting through a post-pandemic hangover, with revenue stalling and earnings falling as corporate spending slowed. Then artificial intelligence arrived, and suddenly Wall Street stopped looking at Dell as a PC manufacturer and started viewing it as a critical supplier in the AI arms race. What jumps off the page is not merely that revenue reached a record $113.5 billion in 2026, but that both revenue and earnings accelerated simultaneously after years of uneven performance. In the stock market, companies rarely receive premium valuations because of what they have done. They receive them because investors believe the future will look dramatically better than the past, and this table shows exactly why Dell has become one of the market’s most closely watched AI infrastructure stories.
The key takeaway for traders is that Dell’s revenue spent three years essentially moving sideways after the post-pandemic technology boom. Revenue peaked above $102 billion in fiscal 2023, fell sharply during the enterprise technology slowdown in fiscal 2024, and then began recovering in fiscal 2025 as AI server demand accelerated. What has Wall Street excited is not the revenue recovery itself. It is the earnings recovery. Net income has nearly doubled from $2.44 billion in fiscal 2023 to $4.59 billion in fiscal 2025, largely because AI infrastructure carries significantly better economics than traditional PC sales.
For traders, the most important number is not the historical revenue growth. It is the acceleration in fiscal 2026. Dell’s record revenue was driven largely by explosive growth in AI servers and infrastructure solutions, which have become the primary driver of institutional interest in the stock. The company reported record AI-related demand, record backlog, and record cash flow, which explains why Wall Street increasingly views Dell as an AI infrastructure company rather than a traditional PC manufacturer.
The two biggest questions traders are asking right now are remarkably simple.
First, is AI demand real or temporary?
Second, can Dell maintain margins while aggressively expanding AI server production?
Those questions explain almost every major move in Dell shares over the past year.
The biggest news over the past 30 days was not merely that Dell beat expectations. Companies beat expectations every week. The important development was management dramatically increasing its AI server outlook. Dell now expects roughly $60 billion in AI server revenue for fiscal 2027, up sharply from previous projections. Revenue expectations for the broader company also moved significantly higher.
That guidance change matters because Wall Street values growth stories based on future expectations, not current conditions.
What is already priced in?
A lot.
The stock has rallied aggressively because investors now view Dell as one of the clearest beneficiaries of enterprise AI spending. The market understands the AI story. It understands the backlog. It understands the demand. None of that is secret information anymore.
What Wall Street may be missing is that AI infrastructure spending has historically been cyclical. Every boom eventually encounters capacity limits, budget constraints, or periods of digestion. Analysts tend to extrapolate current demand into infinity. History suggests that infinity usually arrives later than expected.
So why is Dell up?
Because performance attracts attention.
Because institutions buy growth.
Because AI server orders have become enormous.
Because backlog visibility has improved dramatically.
Because management keeps raising guidance.
Because actual results continue validating the narrative.
Over the past 90 days, Dell has become one of the market’s premier AI infrastructure trades. AI order growth, expanding backlogs, rising earnings estimates, and repeated analyst upgrades have fueled institutional demand. The stock’s gains have substantially outperformed broad technology benchmarks and the sector as investors search for alternatives to simply buying Nvidia.
Year to date, the story is similar. AI server revenue growth has overwhelmed concerns about the slower PC market. Traders love simple stories. Dell’s story is simple: more AI spending equals more Dell servers. Sometimes the market really is that straightforward.
The opportunity is obvious.
If AI infrastructure spending continues growing at current rates, Dell could generate significantly more revenue and earnings than analysts currently forecast. The biggest upside surprise would be if enterprise AI adoption accelerates beyond the hyperscale customers and spreads broadly across traditional corporations. That would create a second wave of demand.
The risks are equally obvious.
If AI spending slows, order growth cools, or margins get squeezed by component costs, the stock could correct sharply. Traders should also remember that expectations have become extremely ambitious. Great companies often disappoint simply because investors expected miracles.
The single biggest blind spot is assuming AI demand grows in a straight line.
Nothing in markets grows in a straight line. Not railroads. Not the internet. Not smartphones. Not AI.
Key Catalysts traders should watch include:
Late August 2026: Fiscal Q2 Earnings Report.
This is where investors will judge whether AI demand remains as strong as management claims.
The trader’s takeaway is straightforward.
Dell is no longer a sleepy hardware company. It is an AI infrastructure momentum stock wearing a hardware company’s name tag. This makes it most suitable for trend-following growth traders and institutional momentum investors.
For the rally to continue, AI server demand must remain strong, backlog growth must stay healthy, and management must keep converting enthusiasm into revenue. The earliest warning sign would be slowing order growth or reduced guidance. If that happens, the market will suddenly remember that Dell still sells PCs.
Until then, the trend remains the boss. And in markets, just as in politics, economics, and human behavior, arguing with reality is rarely a profitable business model.
In this analysis we will review and evaluate forecasts using the following set of indicators and tools.
Wall Street Analysts Ratings and Forecasts
52 Week High and Low Boundaries
Best-Case / Worst-Case Scenario Analysis
VantagePoint AI Predictive Blue Line
Neural Network Forecast (Machine Learning)
VantagePoint AI Daily Range Forecast
Intermarket Analysis
Our Suggestion
We use artificial intelligence to improve probabilities, not replace judgment. A signal means almost nothing if the business behind it is weak. That’s why we study revenue, earnings, cash flow, and competitive strength alongside price action. When strong fundamentals and strong momentum align, the odds often move decisively in the trader’s favor.
Wall Street Analysts Price Forecasts
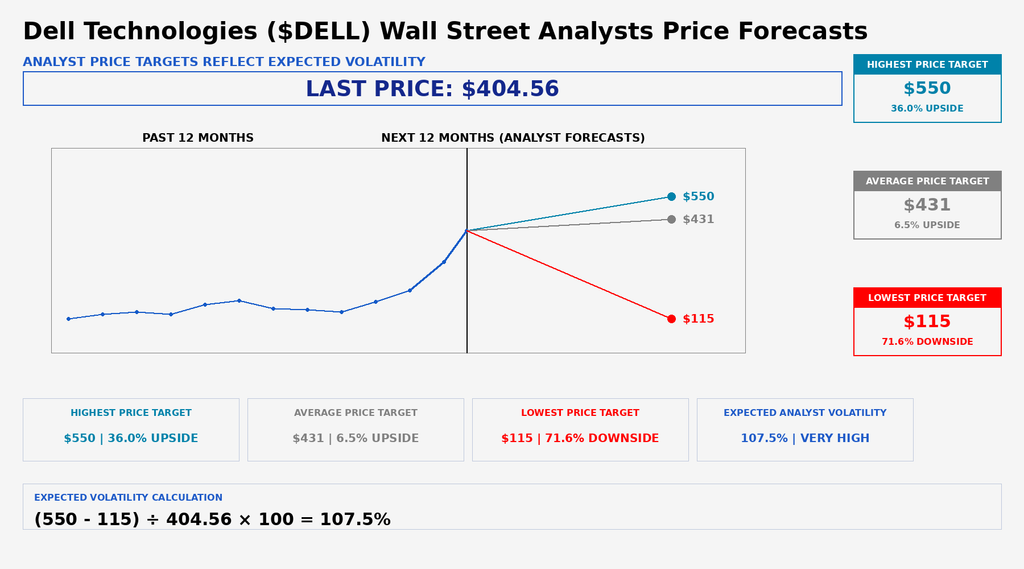
Wall Street’s analysts are looking at Dell the way a hungry man looks at a buffet. They generally like what they see, but nobody can agree on exactly how much food is on the table. The stock recently closed at $404.56. The most optimistic analyst sees it climbing to $550, a gain of 36%. The average target sits at $431, implying a more modest 6.5% upside. Meanwhile, one analyst is staring into the abyss and sees Dell falling to $115, a decline of more than 71%. That is not a difference of opinion. That is a family argument at Thanksgiving dinner.
The most important number on this graphic is not the highest target or the average target. It is the expected analyst volatility of 107.5%. Think about that for a moment. Wall Street’s own forecasts imply a future trading range larger than the stock’s current price. When analysts agree on a company, the target range is usually tight. When they disagree this dramatically, it tells you they are trying to value a business sitting in the middle of a massive transformation. Some analysts see Dell as a mature hardware company. Others see it as a critical supplier to the AI revolution. Those are two very different businesses and they deserve very different valuations.
Here’s what Wall Street may be missing. The analysts are spending a lot of time arguing about where Dell should trade and not enough time recognizing why the stock got here in the first place. Dell’s revenue is accelerating. Earnings are rising. AI server demand continues to explode. Institutions are not buying Dell because it makes laptops. They are buying Dell because it sits at the intersection of artificial intelligence, enterprise infrastructure, and corporate technology spending. In markets, performance attracts capital the same way a winning streak attracts attention in Las Vegas.
The trader’s takeaway is straightforward. Wall Street is bullish, but it is also deeply divided. The average target suggests analysts expect modest upside from current levels. The massive spread between the highest and lowest targets tells us conviction remains far lower than the headlines suggest. Analysts are essentially saying Dell could be one of the biggest beneficiaries of the AI boom, or one of the stocks most vulnerable if expectations get ahead of reality. In other words, the opportunity is real, the uncertainty is real, and traders would be wise to respect both.
52 Week High and Low Boundaries
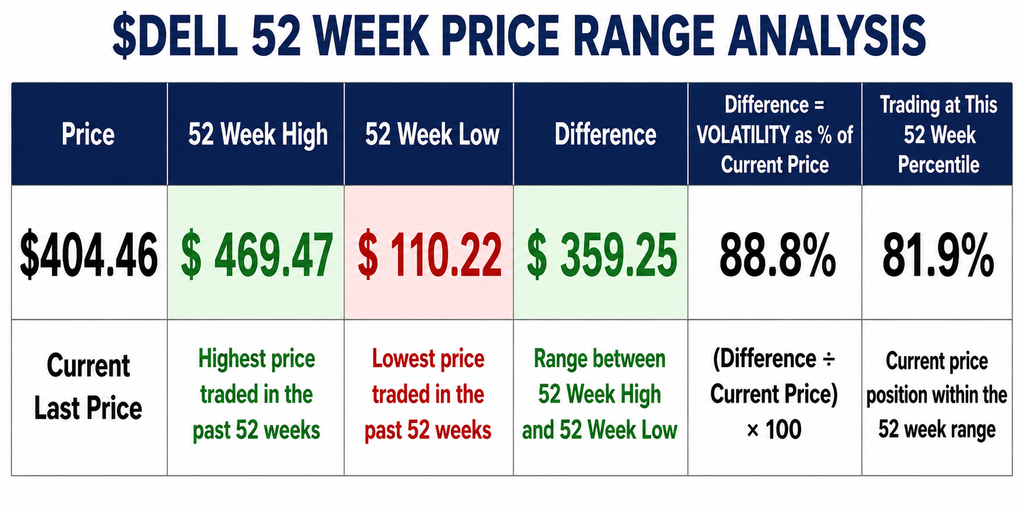
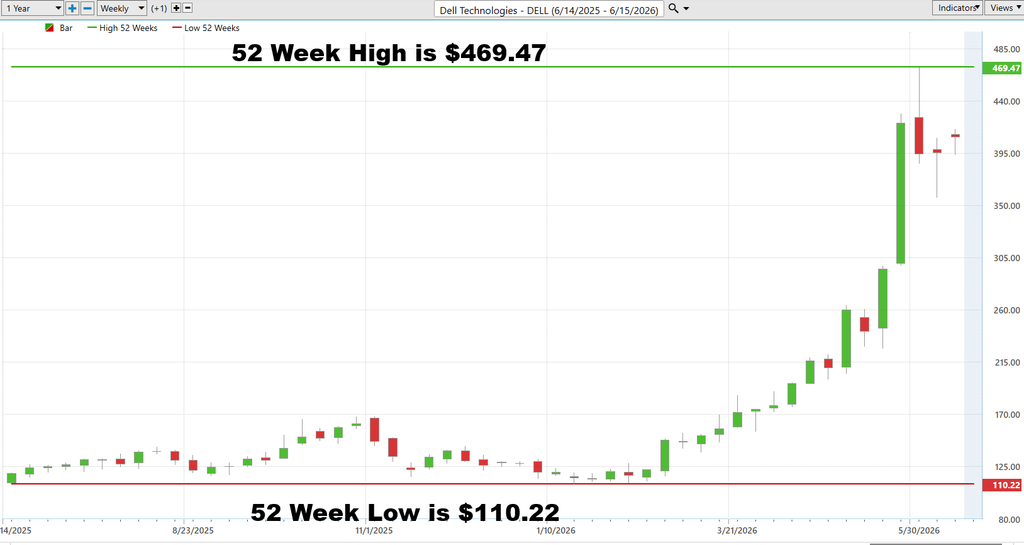
Dell is trading at $404.46, with a 52-week high of $469.47 and a 52-week low of $110.22. That places the stock at roughly the 81.9th percentile of its annual trading range, meaning it is much closer to its highs than its lows. In simple terms, if the past year’s trading range were a football field, Dell is already standing inside the opponent’s red zone. Traders should pay attention to this because strong stocks tend to spend most of their time near their highs, not their lows. The fact that Dell is trading within striking distance of its annual high suggests the stock is behaving more like a market leader than a laggard. One of the simplest ways to understand what an asset is capable of doing is to study the range it has traveled over the past year, and Dell’s range tells us this is not a sleepy stock.
The annual trading range between Dell’s high and low is $359.25 per share. When we divide that range by the current price, we arrive at a historical volatility proxy of approximately 88.8%. In plain English, Dell covered an amount equal to nearly 89% of its current share price during the past 52 weeks. That is a very large range and tells traders that Dell is capable of making meaningful moves in both directions. The recent advance from the lower end of the range toward the upper end suggests volatility has been expanding in favor of the bulls rather than compressing into a sideways consolidation. This is the type of behavior often seen when institutions are accumulating shares and momentum is feeding on itself.
From a trader’s perspective, the opportunity remains attractive, but it is no longer early. Dell is not emerging from a base near its lows. It is already trading near the upper boundary of its annual range, where expectations are naturally higher and mistakes become more expensive. A breakout above the $469.47 52-week high would signal that buyers remain willing to pay increasingly higher prices and could trigger another leg higher. Conversely, a decisive breakdown below the recent support area and a move away from the upper portion of the range would be an early warning that momentum is fading. For now, the trend remains firmly in the bulls’ favor, but traders should recognize that the stock’s strongest asset, its momentum, can quickly become its greatest risk if institutional demand begins to cool.
Best-Case/Worst-Case Scenario Analysis
Volatility is one of the most misunderstood concepts in trading. Many traders make volatility far more complicated than it needs to be. The fastest way to genuinely understand volatility in an asset is to measure its largest uninterrupted rallies and largest uninterrupted declines over the past 52 weeks.
This simple exercise provides a very clear picture of what is possible from both a risk and reward standpoint. Rather than relying on forecasts or opinions, traders can study what the stock has already demonstrated it is capable of doing.
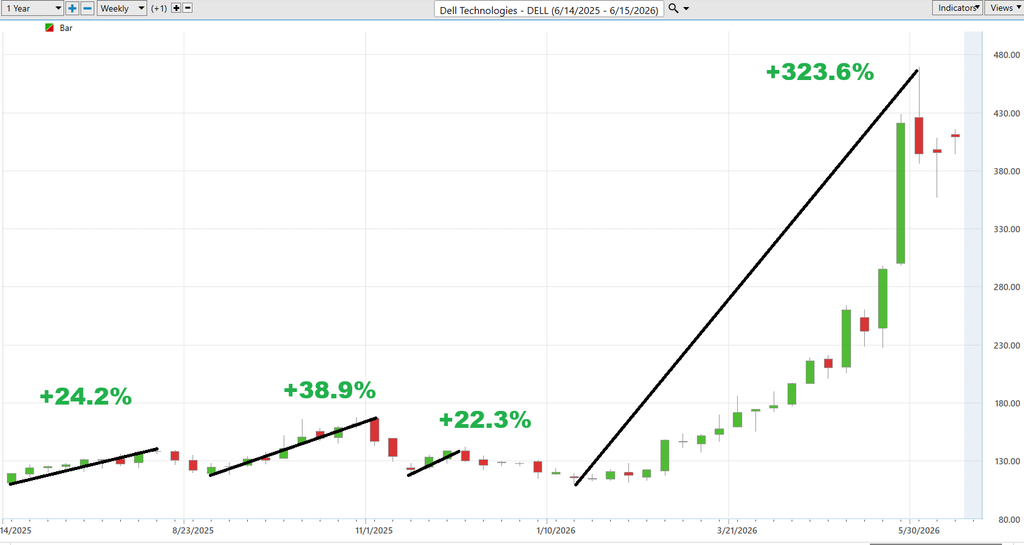
Looking first at the upside, Dell’s largest uninterrupted rally over the past 52 weeks was an astonishing 323.6%. If the stock were to repeat a move of that magnitude from its current price of roughly $404, Dell could theoretically advance toward $1,700 per share. Such a move would likely require AI infrastructure spending to remain red hot, enterprise technology budgets to continue expanding, and institutional investors to keep treating Dell as a primary beneficiary of the artificial intelligence buildout. The number sounds extraordinary, but the chart reminds us that Dell has already proven it is capable of producing that type of explosive upside.
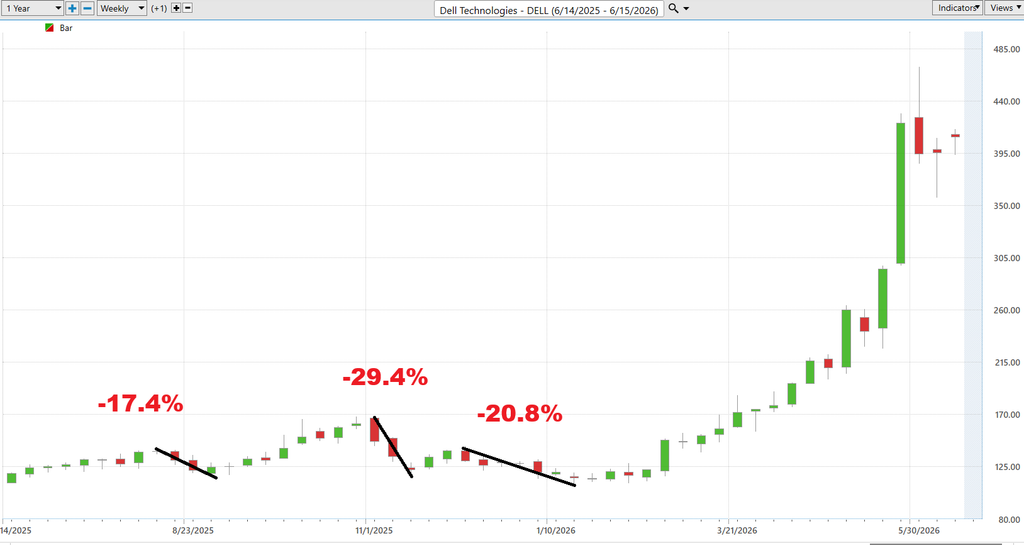
Now consider the other side of the equation. Over the past 52 weeks, Dell’s largest uninterrupted decline was 29.4%. A decline of similar magnitude from today’s price would place the stock near $285 per share. That type of move would erase a substantial amount of capital in a surprisingly short period of time and would feel far more painful than the percentage alone suggests. The important lesson is not whether such a decline is likely tomorrow, next month, or even this year. The lesson is that Dell has already demonstrated its ability to fall that far, which means traders should never assume that downside volatility disappears simply because the recent trend has been favorable.
This is where the trader’s reality begins. Most traders spend their time imagining the 323.6% rally while giving very little thought to the 29.4% decline. Professional traders understand that both outcomes deserve equal attention because successful trading is not simply about making money, it is about surviving long enough to make money repeatedly. Proper position sizing, realistic expectations, and respect for volatility help solve this problem. This exercise is not about prediction. It is about preparation. If you cannot handle the worst-case scenario, you have no business chasing the best-case outcome.
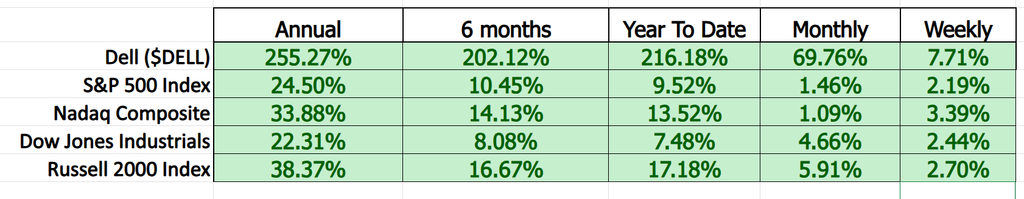
Dell is beating the major market indexes the way a Formula One car beats a riding lawn mower. Over the last twelve months, Dell has gained 255.3%, while the S&P 500 managed 24.5%, the Nasdaq advanced 33.9%, and the Russell 2000 climbed 38.4%. Year to date, Dell is up 216.2% versus just 9.5% for the S&P 500. Over the last six months, Dell has surged 202.1% while the S&P has gained 10.5%. When a stock outperforms the broader market by margins this large across virtually every meaningful timeframe, traders should stop debating the story and start paying attention to the scoreboard.
Relative strength like this rarely happens because investors suddenly become sentimental about computer hardware. Markets are voting machines before they become weighing machines, and right now institutional money is voting overwhelmingly in Dell’s favor. The performance numbers suggest that large investors view Dell as a major beneficiary of the artificial intelligence infrastructure buildout. While Wall Street headlines talk endlessly about AI chips, cloud computing, and data centers, the capital flows tell a simpler story. Institutions are not merely buying the AI story. They are buying Dell shares. The stock’s performance is the footprint that institutional money leaves behind when it moves in size.
For traders, the takeaway is straightforward. Dell is behaving like a market leader, not a market participant. Momentum traders, swing traders, and position traders are all attracted to the same thing: assets that consistently outperform their benchmarks. The risk is not that Dell lacks momentum. The risk is that expectations eventually become so high that the company struggles to exceed them. As long as Dell continues outperforming the S&P 500, the Nasdaq, and the Russell 2000 by wide margins, the trend deserves respect. After all, opinions are free, forecasts are plentiful, but performance is the only scoreboard Wall Street keeps.
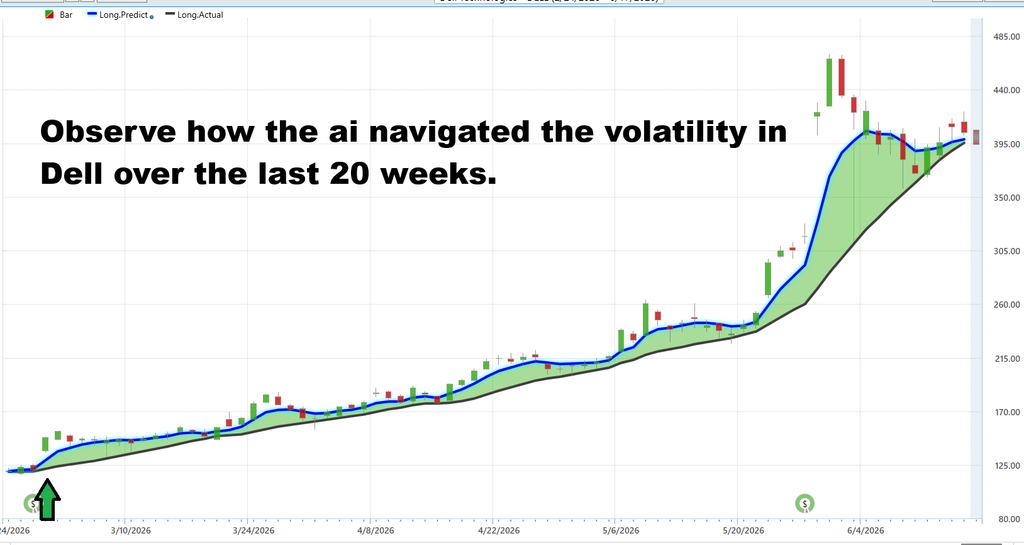
Vantagepoint AI Predictive Blue Line
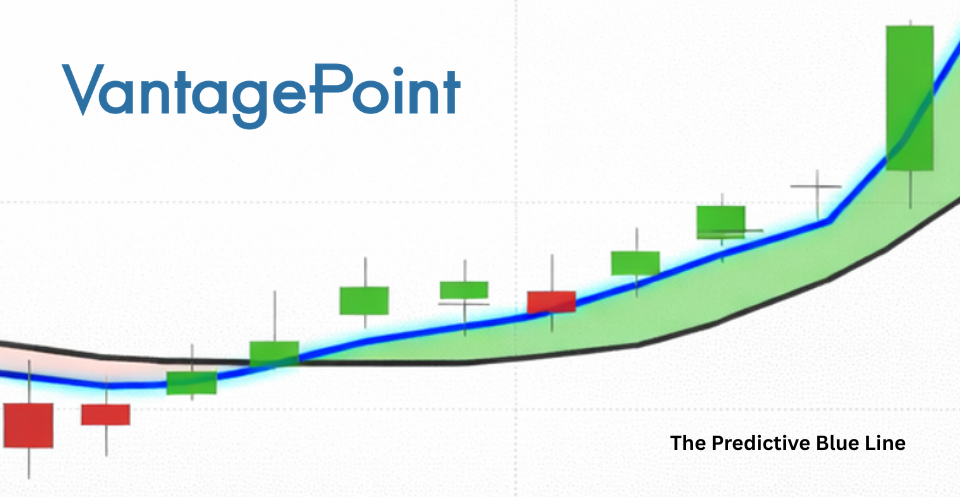
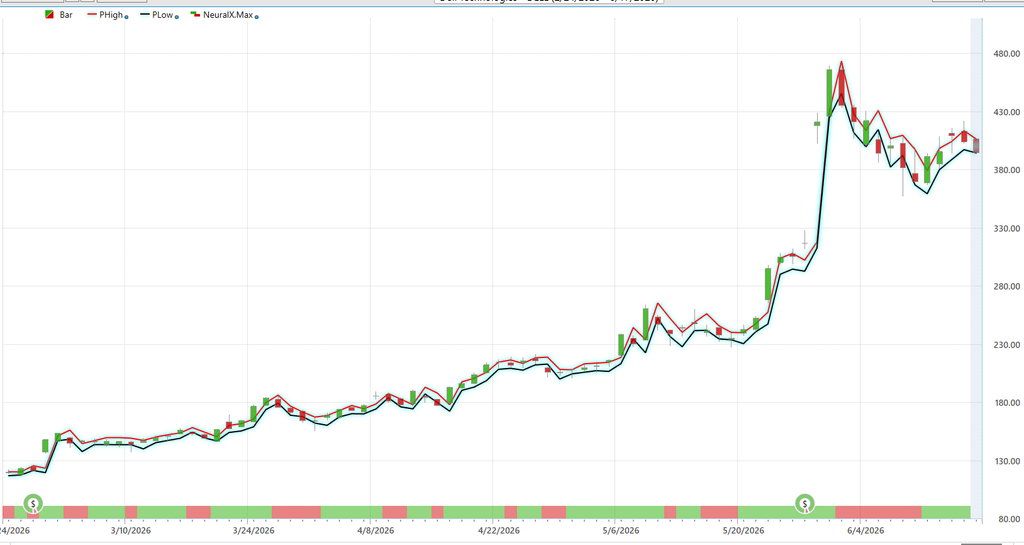
The Predictive Blue Line is designed to answer a deceptively simple question: is the future trend strengthening or weakening before it becomes obvious to everyone else? Looking at Dell’s chart, the answer has been remarkably clear. Over the last 20 weeks, the Predictive Blue Line remained consistently above the longer-term trend line, navigating a series of pullbacks, consolidations, and sharp advances while keeping traders focused on the primary direction of the trend. The most impressive feature is not that Dell rallied from roughly $120 to over $400. It is that the AI identified the underlying trend long before the explosive move became front-page news. Even after the recent surge and subsequent consolidation, the Predictive Blue Line remains above the longer-term trend line and has begun turning higher again, suggesting that momentum remains intact. For traders, the message is straightforward: as long as the Predictive Blue Line remains above the longer-term trend and continues sloping upward, the dominant trend remains bullish. The moment that relationship changes is when traders should begin asking tougher questions about whether Dell’s remarkable advance is merely pausing or finally running out of fuel.
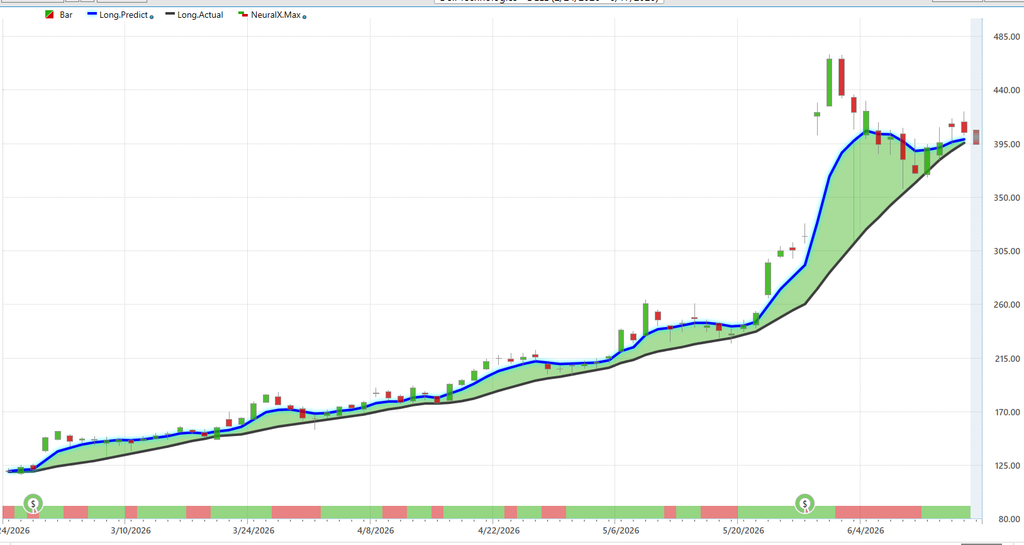
VantagePoint AI Neural Index (Machine Learning)
Think of the Neural Index as an artificial intelligence early-warning system. While most traders spend their time staring at price bars, the Neural Index is evaluating thousands of intermarket relationships, market influences, and statistical patterns to answer one simple question: what is the most likely direction of price movement over the next 48 to 72 hours? The output is intentionally simple. Green suggests strength is expected. Red suggests weakness is expected. Traders do not need to understand all the mathematics behind it any more than they need to understand how a jet engine works to appreciate that it gets them across the ocean.
What makes the Neural Index so useful is that it helps traders separate noise from information. Markets are full of distractions. News headlines, analyst upgrades, economic reports, and social media opinions all compete for your attention. The Neural Index cuts through that clutter and provides a short-term forecast of whether bullish or bearish forces are gaining control. It is not designed to predict every tick. It is designed to improve decision-making by helping traders identify periods when the probabilities are shifting in their favor.
Now look carefully at Dell’s chart. One of the most revealing patterns is what happens every time the Neural Index turns red. Notice that the stock rarely collapses. Instead, price has repeatedly shown a tendency to drift back toward the area of the Predictive Blue Line, and occasionally slightly below it, before buyers step back in. In other words, the red signals have often acted less like warnings of disaster and more like advance notice that the stock is entering a temporary cooling-off period within a much larger uptrend.
This distinction matters because many traders make the mistake of chasing strength after a large rally. Dell’s chart suggests a different approach. When the Neural Index turns red, the stock has frequently used that period to work off excess enthusiasm and return toward the Predictive Blue Line. Those pullbacks have repeatedly created opportunities for patient traders to participate in the primary trend at more favorable prices. Rather than fearing every red signal, traders should view it as a prompt to pay closer attention to where price is relative to the Predictive Blue Line.
The most powerful signals occur when the two indicators work together. The Predictive Blue Line helps identify the dominant trend. The Neural Index helps identify short-term shifts in momentum. When the Neural Index turns green while the Predictive Blue Line remains above the longer-term trend line, traders have what VantagePoint calls double confirmation. Looking at Dell’s chart, that combination has done an impressive job of keeping traders aligned with one of the strongest trends in the market while avoiding the temptation to buy every rally and panic during every pullback. As John Carlton might say, the goal is not to buy at the highest price possible. The goal is to let the market come to you, and Dell’s Neural Index has repeatedly helped traders do exactly that.
VantagePoint AI Daily Range Forecast
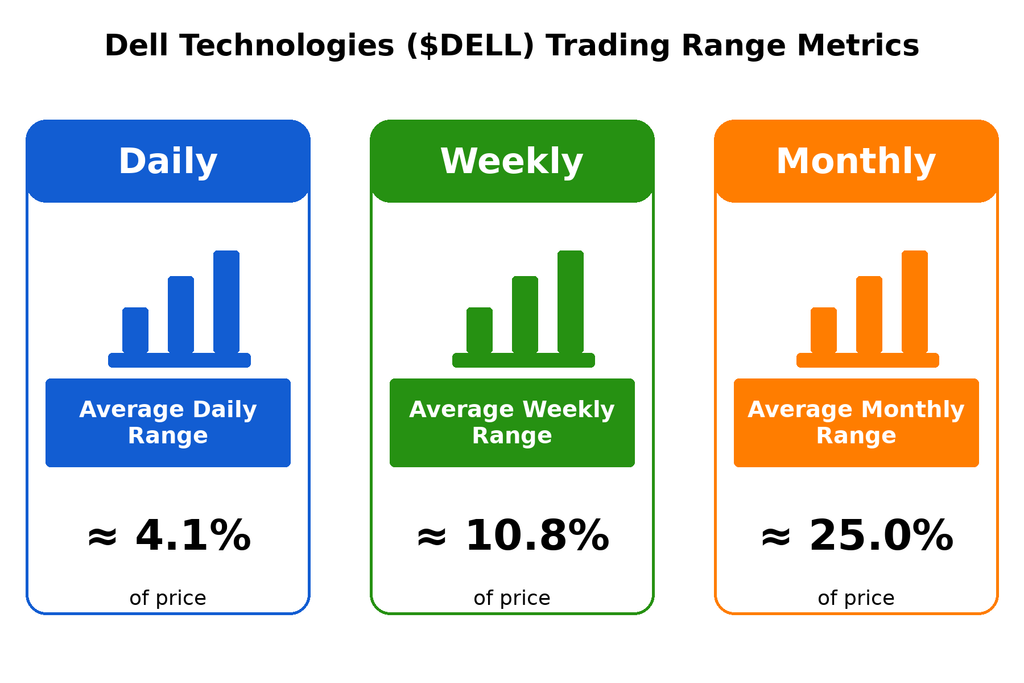
Dell is not a stock for people who get nervous when the elevator moves faster than expected. The Daily Range Forecast suggests Dell typically swings about 4.1% of its price in a normal trading day. For a stock trading near $404, that translates into roughly $16 to $17 of expected daily movement. In other words, if Dell moves $2 or $3 tomorrow, nobody should be impressed. This stock has demonstrated that it can easily cover much larger distances before lunch and still be behaving perfectly normally.
The Weekly Range Forecast expands the picture considerably. At 10.8%, Dell has shown the ability to move roughly $44 in a typical week. The Monthly Range Forecast is where things get truly interesting. At 25%, Dell has historically demonstrated the ability to move approximately $100 over the course of a month. That’s the difference between a stock that drifts and a stock that demands your attention. Traders who expect Dell to move like a utility stock are bringing a butter knife to a chainsaw fight.
The Daily Range Forecast chart offers another valuable lesson. Notice how the forecast high and forecast low bands expanded dramatically during Dell’s explosive AI-driven advance and then began contracting as the stock entered a consolidation phase. Markets breathe. They expand and contract just like an accordion. When volatility expands, opportunity expands. When volatility contracts, the market is often preparing for its next significant move. The key is recognizing which phase you’re in before everyone else does.
For traders, this information is less about prediction and more about expectation management. If you know Dell normally moves 4.1% per day and 25% per month, you’re less likely to panic during ordinary volatility and less likely to chase every green candle like it’s the last helicopter leaving Saigon. The trend remains constructive, but Dell is also reminding traders that strong trends rarely travel in straight lines. The smartest traders use the Daily Range Forecast to distinguish between normal movement and abnormal movement. That’s how you avoid getting shaken out of a good trade simply because the stock decided to act like itself.
VantagePoint AI Intermarket Analysis
Most traders look at a stock chart and assume the stock moves because of something happening inside the company. In reality, stocks do not move in a vacuum. Every stock is connected to dozens of other markets, industries, currencies, commodities, ETFs, and economic forces. Intermarket analysis is the study of those connections. It helps traders understand not just what a stock is doing, but why it is doing it.
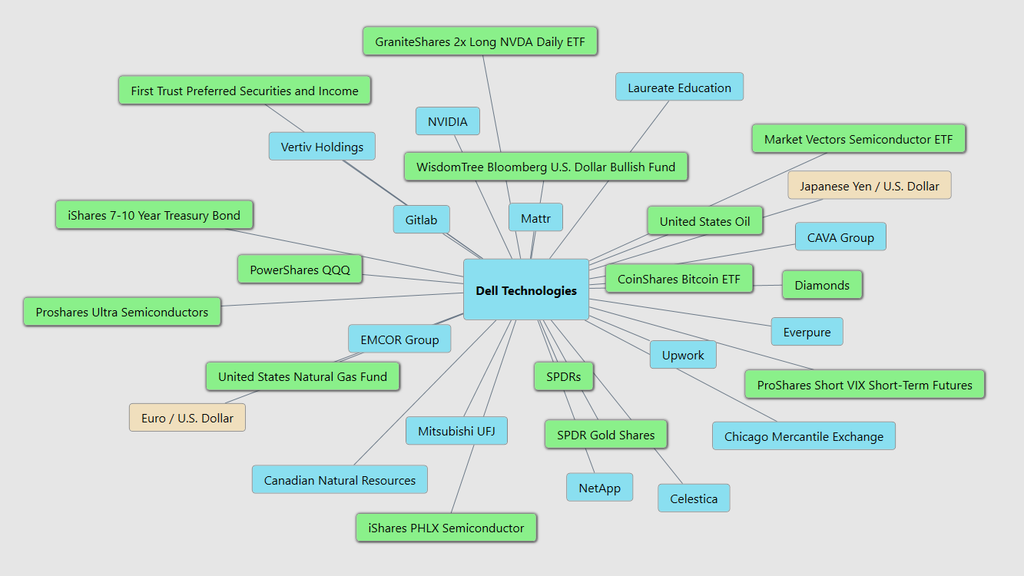
Think of Dell like the center of a giant spider web. Every line connected to Dell in the graphic represents a market, asset, or company that has historically influenced Dell’s price movement. The graphic identifies the 31 strongest drivers of Dell’s price action. Some of these relationships are obvious. Others are surprising. But together they help explain where money is flowing and what forces are pushing Dell higher or lower.
Look at the chart and notice that Dell is connected to companies like NVIDIA, Vertiv, GitLab, NetApp, and Celestica. It is also connected to semiconductor ETFs, Bitcoin ETFs, oil prices, natural gas, bonds, currencies, and even gold. That may seem strange at first. But it makes sense when you realize that Dell sells computers, servers, storage systems, and AI infrastructure to businesses all over the world. If these related markets are changing, Dell often feels the effects.
One of the biggest drivers today is the AI and data center boom. Companies are spending billions of dollars building artificial intelligence infrastructure. Dell supplies many of the servers and storage systems that make those AI projects possible. That is why assets tied to semiconductors, data centers, and AI technology show up prominently in the graphic. When money pours into AI, Dell often benefits.
Interest rates also matter. When borrowing money becomes cheaper, companies are more willing to invest in new technology, upgrade equipment, and build data centers. When rates rise, many of those projects slow down. This is why Treasury bonds and other interest-rate-sensitive assets appear in Dell’s intermarket network. They help reveal whether businesses are likely to spend more or spend less.
Currencies matter too. Dell sells products around the globe. If the U.S. dollar becomes very strong, Dell’s products can become more expensive for overseas customers. If the dollar weakens, Dell may become more competitive internationally. That’s why currency markets such as the Euro and Japanese Yen appear among Dell’s strongest intermarket relationships.
Energy prices also play a role. AI data centers consume enormous amounts of electricity. As demand for computing power grows, demand for energy often grows alongside it. Oil, natural gas, and power-related assets can indirectly influence the pace of AI infrastructure spending, which ultimately affects Dell.
The big takeaway is simple. Most traders spend all their time studying Dell. Professional traders study what is influencing Dell. The graphic gives you a roadmap of the 31 most important markets, sectors, ETFs, currencies, commodities, and companies affecting Dell’s stock price. Understanding these relationships can help traders anticipate changes before they appear on Dell’s chart. Because in the financial markets, nothing moves alone, and the trader who understands the connections often sees opportunities before everyone else does.
Our Suggestion
Dell is one of those companies that investors think they understand until they actually look under the hood. Most people still picture laptops, desktop computers, and the guy in the old commercials telling us to buy direct. Meanwhile, management has quietly repositioned the company into one of the most important suppliers of servers, storage systems, and AI infrastructure on the planet. It is a little like discovering that the neighborhood hardware store has somehow become a major supplier to NASA.
The good news is that management appears to be hitting its objectives. Revenue surged to a record $113.5 billion in fiscal 2026, earnings continued to climb, and AI server demand has become the growth engine driving the entire enterprise. More importantly, management has not merely talked about the AI opportunity. They have converted that opportunity into orders, backlog, and cash flow. On Wall Street, there is a vast difference between discussing the future and billing for it. Dell is doing the latter.
The primary risk is that investors have begun treating AI spending as though it were a law of nature, like gravity or taxes. History suggests technology spending tends to arrive in waves. Companies build capacity, overspend, panic, cut budgets, and then repeat the process with remarkable consistency. If AI infrastructure spending slows, Dell could find itself facing the uncomfortable reality that expectations have grown faster than the business itself. Traders should remember that even great companies can suffer when investors become too enthusiastic about tomorrow.
The opportunity is straightforward. Dell sits in the middle of one of the largest technology spending cycles in decades. Every corporation trying to build AI capabilities needs computing power, storage, networking equipment, and integrated infrastructure. Dell sells all of those things. If management continues executing at its current pace and enterprise AI adoption expands beyond today’s early adopters, analysts may still be underestimating the company’s long-term earnings power.
Dell remains a compelling momentum and institutional accumulation story. The company is benefiting from powerful secular trends, management is executing effectively, and the financial results continue to support the bullish narrative. For the trend to continue, traders need to see sustained growth in AI server orders, expanding backlog, and continued earnings acceleration. The warning sign would be any indication that demand is slowing or that customers are delaying infrastructure purchases. Until that occurs, Dell appears to be doing exactly what investors hope every company will do: find where the money is flowing and stand directly in front of it with a cash register.
Practice great money management on all of your trades. Position sizing is critical here.
Use the VantagePoint AI Daily Range Forecast to isolate short term trading opportunities.
It’s not magic.
It’s machine learning.
Disclaimer: THERE IS A HIGH DEGREE OF RISK INVOLVED IN TRADING. IT IS NOT PRUDENT OR ADVISABLE TO MAKE TRADING DECISIONS THAT ARE BEYOND YOUR FINANCIAL MEANS OR INVOLVE TRADING CAPITAL THAT YOU ARE NOT WILLING AND CAPABLE OF LOSING.
VANTAGEPOINT’S MARKETING CAMPAIGNS, OF ANY KIND, DO NOT CONSTITUTE TRADING ADVICE OR AN ENDORSEMENT OR RECOMMENDATION BY VANTAGEPOINT AI OR ANY ASSOCIATED AFFILIATES OF ANY TRADING METHODS, PROGRAMS, SYSTEMS OR ROUTINES. VANTAGEPOINT’S PERSONNEL ARE NOT LICENSED BROKERS OR ADVISORS AND DO NOT OFFER TRADING ADVICE.