


| This week’s a.i. Stock Spotlight is Century Aluminum ($CENX) |
Century Aluminum Company, publicly traded under the ticker symbol CENX, is a prominent player in the aluminum industry. Established in 1995, Century Aluminum primarily engages in the production of primary aluminum, which is essential for various industrial applications including automotive, aerospace, and construction. Notably headquartered in Chicago, Illinois, the company strategically operates major production facilities not only in the United States but also in Iceland, leveraging geographical diversities to optimize their production capacities.
Century Aluminum generates its revenue through the processing and sale of primary aluminum, produced at its key facilities located in the United States (Hawesville and Sebree, Kentucky) and Grundartangi in Iceland. These facilities are integral to the company’s operations, forming the backbone of its production capabilities. The company’s revenue streams are largely dependent on the fluctuating prices of aluminum on the global market, which in turn are influenced by factors such as global supply and demand dynamics, economic policies, and trade regulations.
Century Aluminum employs approximately 2,000 people, reflecting its scale and the extensive operational needs of an industrial manufacturing entity. The company was founded by Craig Davis and others who saw an opportunity in the restructuring of the aluminum industry in the mid-1990s. Since its inception, Century Aluminum has expanded through strategic acquisitions, including the purchase of the Sebree smelter in 2013, which significantly enhanced its production capabilities and market reach.
In what can only be described as a monumental development for American industry, $CENX has been earmarked by the U.S. Department of Energy’s Office of Clean Energy Demonstrations for negotiations on a substantial $500 million in funding. This funding stems from both the Bipartisan Infrastructure Law and the Inflation Reduction Act, earmarked to support the construction of a new aluminum smelter. This initiative marks the first new primary aluminum smelter to be built in the U.S. in 45 years, signaling a doubling of the country’s capacity in this critical industry. This project is not just about scaling up an industry—it’s a cornerstone in a broader national strategy aimed at accelerating the transition of energy-intensive sectors towards net-zero emissions. This initiative is crucial for bolstering local economies, preserving quality jobs, and reducing greenhouse gas emissions across more than 20 states.
But the story gets even richer. Amidst this promising industrial expansion, geopolitical tensions are shaping market dynamics in significant ways. The U.S. and U.K. have recently imposed new sanctions on Russian metals, including aluminum, nickel, and copper. This strategic move not only limits Russia’s access to the London Metals Exchange but is also likely to temporarily boost global metal prices due to restricted supply channels.
Shares of Century Aluminum, which trades under $CENX and is the largest U.S. supplier of primary aluminum, have surged following the sanctions announcement. Investors are keenly watching as $CENX stands to gain from these geopolitical shifts. The company is well positioned to capitalize on any supply gaps in the market. With the sanctions squeezing Russian metal exports and Century’s expansion plans, there’s a clear opportunity for the company to capture a significant share of the growing demand for lightweight metals. However, despite the stock’s impressive 46.8% gain this year, investors should be cautious. The cyclical nature of aluminum prices and recent market reactions might mean the stock’s potential gains are already reflected in its current price. Investors might want to hold off for potential dips in the stock price before buying in.
This strategic development not only marks a significant leap for Century but also positions it at the forefront of an evolving global metals market, making it a pivotal player in the U.S. industrial renaissance and the green energy transition.
The journey towards profitability for Century Aluminum has been marked by volatility, typical of the metals sector, influenced heavily by global economic conditions and commodity prices. The company has not been profitable in 7 of the last 8 years. They have managed to grow revenue but have not been profitable.
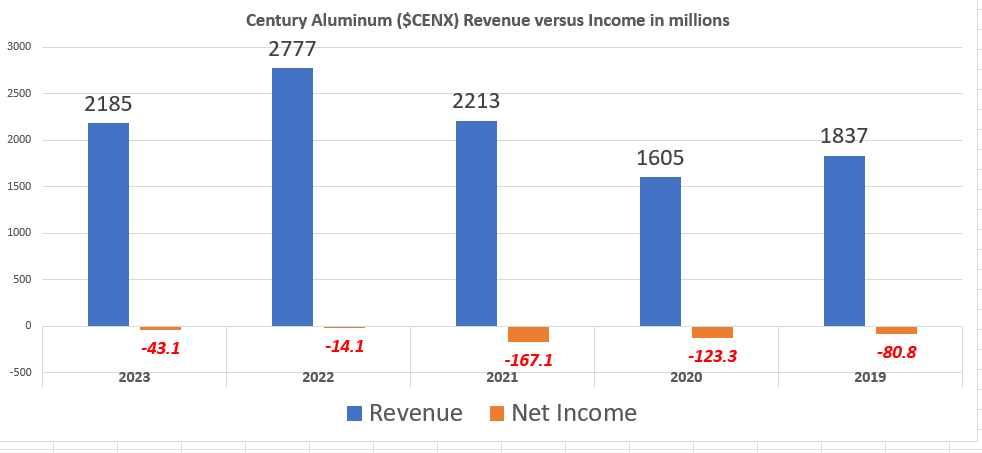
The company’s profitability is tightly correlated with aluminum prices and production efficiencies. Regarding financial health, like many in the industry, Century Aluminum manages a considerable amount of debt, a common strategy to fund expansive operations and capital investments necessary in high-capital industries like aluminum production.
The spotlight is on northeastern Kentucky, with Century zeroing in on this region as the prime site for its ambitious endeavor. Kentucky Governor Andy Beshear has hailed the project as potentially the largest investment eastern Kentucky has ever seen, calling the $500 million DOE credit “the first important step.”
The project promises substantial economic benefits, poised to create over 1,000 full-time jobs and bolster domestic supply chains critical to several major industries, including electric vehicles, renewable energy, construction, and packaging.
Wall Street analysts have had mixed views on Century Aluminum over the years, influenced by the company’s performance, global aluminum prices, and economic conditions. The company’s stock has experienced significant fluctuations, reflecting the cyclical nature of the industry it operates in. Analysts typically monitor the company’s ability to manage costs, navigate trade policies, and capitalize on market upturns.
In the competitive landscape, Century Aluminum faces stiff competition from other major aluminum producers like Alcoa Corporation and Rusal. Each competitor aims to leverage technology, efficiency, and strategic market positioning to gain an advantage. Century Aluminum’s main competitive challenge is to maintain cost-efficiency and innovation in production processes to stay ahead.
The biggest opportunities for Century Aluminum lie in the increasing demand for lightweight, durable aluminum in sectors such as transportation and technology. Conversely, the risks include fluctuating raw material costs, particularly for alumina, regulatory changes, and the potential for economic downturns, which can drastically affect commodity prices and profitability.
Over the past decade, the focus on expanding through acquisitions and scaling production capabilities has marked Century Aluminum’s strategic moves. Looking at the company’s revenue and earnings over the last five years would reveal trends of growth interspersed with periods of challenges, primarily driven by external market conditions.
In this stock study we will look at the following metrics and indicators.
1) Wall Street Analysts’ Estimates
2) 52-week High and Low boundaries
3) Vantagepoint A.I. Predictive Blue Line Analysis
4) The Best Case – Worst Case Scenarios
5) Neural Network Forecast
6) VantagePoint A.I. Daily Trading Range Forecast
7) Seasonal Analysis
8) Intermarket Analysis
9) Our trading suggestion
We don’t base decisions on things like earnings or fundamental cash flow valuations. However, we do look at them to better understand the financial landscape that a company is operating under.
Wall Street Analysts Forecasts and Estimates
The 3 analysts with 12-month price forecasts for CENX stock have an average target of 10.67, with a low estimate of 6.00 and a high estimate of 14. The average target predicts a decrease of -39.03% from the current stock price of 17.50.
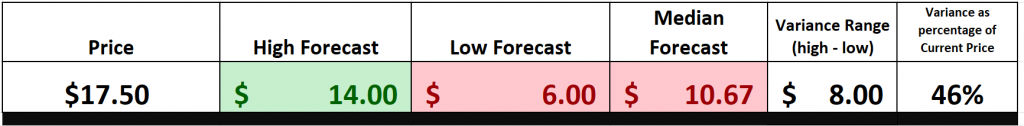
We typically like to focus on the variance between the most bullish and most bearish forecast as this is often a good indicator of expected future volatility. The current variance in this regard is $8 which represents 46% of the current price.
More importantly you can also see that $CENX is substantially above even the most bullish forecast which shows how the stock has benefited from the recent sanctions against Russia and China.
52 Week High and Low Boundaries
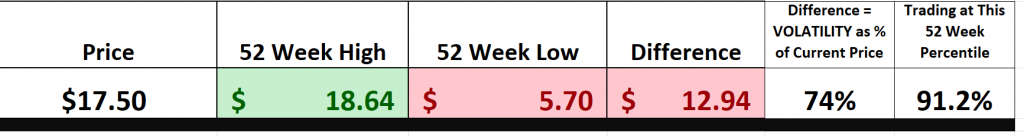
Over the last 52 weeks $CENX has traded as high as $18.64 and as low as $5.70. It is currently trading at its 91st percentile of the last 52 weeks. What we always advise traders to do is to look at the trading range of the past year and compare that difference to the current price. This value is the expected volatility for the following year. It tells us that if the next 52 weeks are like the last 52 weeks it would be perfectly normal to see $CENX trade 74% higher and or lower from the current price level. This is an exceptionally high level of volatility.
The 52-week high and low boundaries are pivotal psychological benchmarks in financial markets, indicating the maximum and minimum prices an asset has reached over the past year and serving as key indicators of momentum and market sentiment. When a stock exceeds its 52-week high, it typically reflects strength and positive momentum, suggesting further potential upside as the asset appears to be in demand. In contrast, a drop to a new 52-week low often signals weakness, potentially leading to selloffs as the market will reassess the asset’s value. Both individual and institutional investors heavily utilize these benchmarks to shape their trading strategies, identifying potential entry and exit points based on these levels. This practice, rooted in the principles of technical analysis and trading psychology, reflects a long-standing human tendency to base decisions on historical price levels, showcasing how deeply embedded these practices are in market behavior.
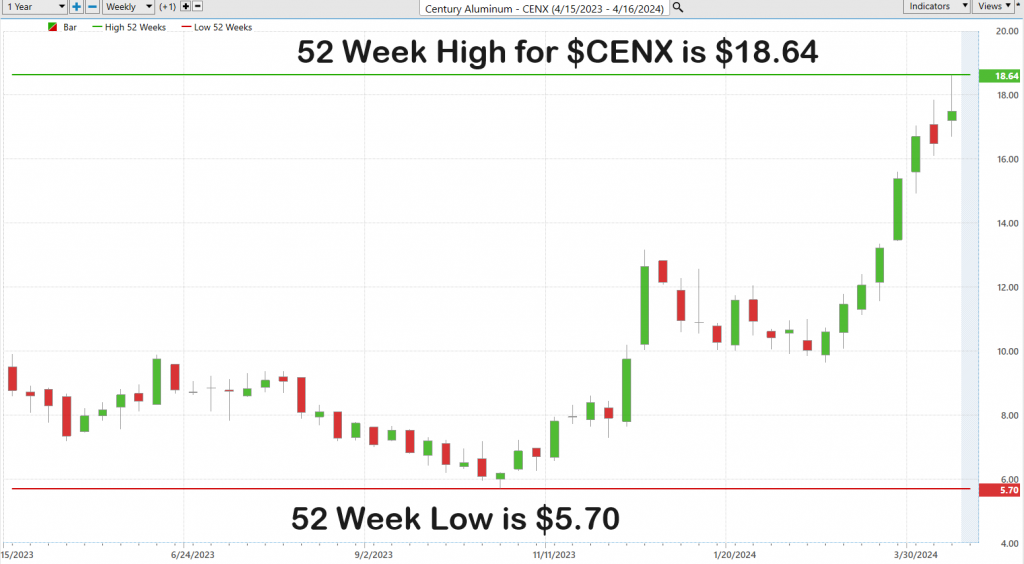
Here is what the price journey for $CENX has looked like over the last 52 weeks:
What is also very helpful when analyzing a trade is to compare the 52-week chart to the 10-year monthly chart to gain a longer term perspective.
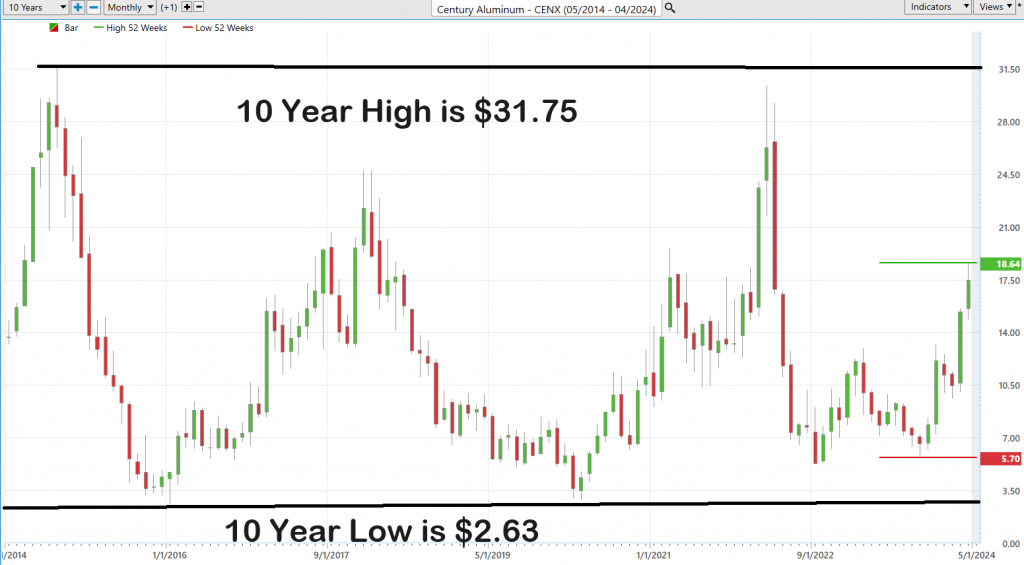
Comparing a 10-year monthly chart with a 52-week chart allows traders to strategically align long-term trends with short-term movements, enhancing the effectiveness of their trading decisions. The decade-long view reveals the stock’s overall performance, long-term trends, major cyclical patterns, and historical volatility, while the 52-week snapshot provides insights into recent market behavior, immediate volatility, and current momentum. This dual analysis helps traders identify durable trends, assess risk more accurately, and react appropriately to recent market dynamics and external events, ensuring that short-term actions are informed by long-term perspectives. Thus, by integrating these two perspectives, traders can develop robust strategies that capitalize on both immediate opportunities and sustained movements, leading to a better understanding of volatile and risk.
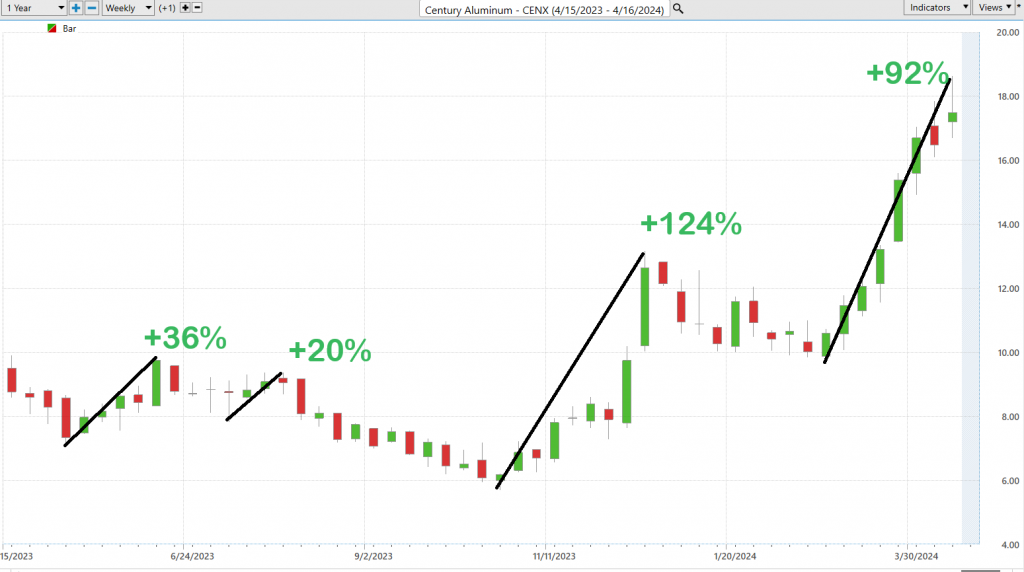
Best-Case/Worst Case Analysis
Creating a best-case and worst-case analysis of risk and reward for Century Aluminum ($CENX) over the past year involves a thorough review of its price movements to develop a realistic perspective on potential outcomes. This analysis, termed “Sunshine and Storm,” is essential for any trader looking to gain a clear understanding of both the optimistic scenarios and possible pitfalls.
Best-Case Scenario: This involves identifying the strongest $CENX rallies reached in the past year.
Worst-Case Scenario: Conversely, this scenario focuses on the worst declines the stock reached during the last 52 weeks.
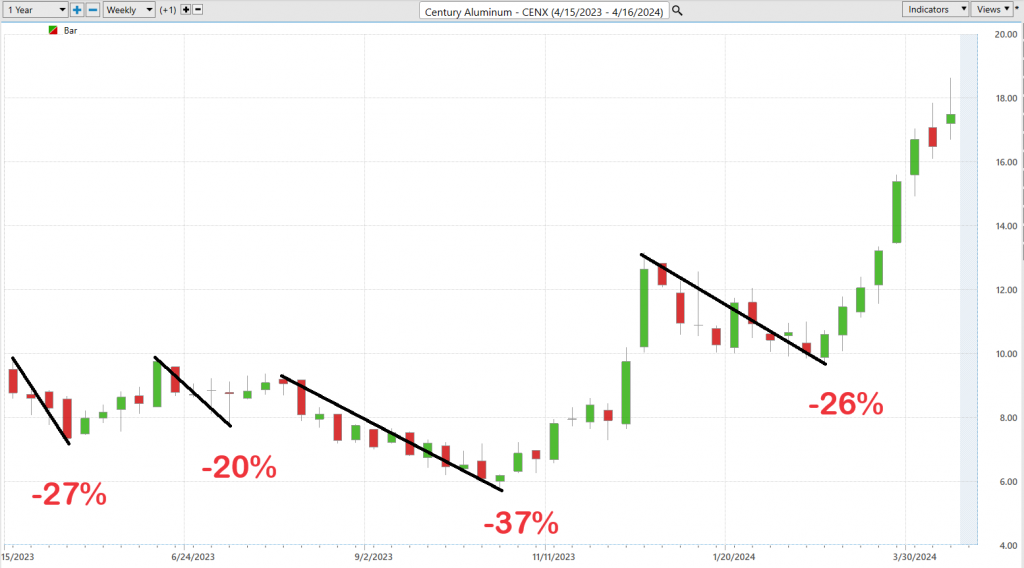
This simple approach allows a traders to quickly understand the potential risk and reward of trading $CENX moving forward.
Traders aiming for success in the markets must cultivate an objective understanding of risk and reward, a fundamental aspect of savvy investing. A practical approach to this is analyzing Century Aluminum’s ($CENX) past year’s performance, comparing the scale of its rallies to its declines. Such an exercise not only acquaints one with the typical price actions and volatility of $CENX but also is indispensable in forming a realistic view of potential risks.
By undertaking this dual-faceted analysis, traders not only prepare for the brightest days but also brace for potential storms. This clear-eyed assessment helps tailor investment strategies that align with one’s financial thresholds and risk appetite, thereby ensuring that decisions are both informed and personalized.
Moving forward, a comparative analysis of $CENX against broader market indices is crucial. This comparison not only highlights where $CENX has outperformed or underperformed in relation to the broader market.
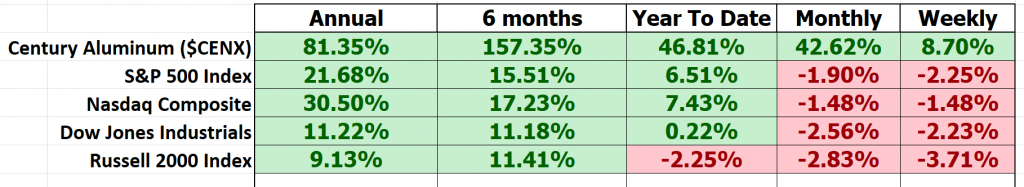
What is compelling about this analysis is that $CENX has moved up while the broader market has moved down. The sanctions against Russia and China, to a very large degree are responsible for this massive rally.
Let’s zero in on something that doesn’t get nearly enough airtime when we talk about stocks like Century Aluminum ($CENX). I am referring to beta. This is not your everyday stock metric; it’s a telling indicator of a stock’s dance steps alongside or against the market rhythm. Century Aluminum has had a beta of 2.74 over the past five years. What does that mean? It means this stock is swinging with a volatility 174% higher than the market average. That’s not just a hop and skip over the market line; that’s a leap!
And why is this important? It tells you everything about the kind of rollercoaster ride you’re signing up for with $CENX. It’s not just participating in the market’s ups and downs; it’s amplifying them. If you’re in the market for thrills and potentially higher rewards, $CENX might just be your ticket. This isn’t just dry numbers, folks; this is about understanding the bold character of Century Aluminum in the financial narrative. It communicates a much higher level of volatility than is customary and should also guide your position sizing.
This sort of analysis can be critical. It empowers you to navigate the investment landscape not just with data, but with insight, confidence, and the precision of a seasoned trader.
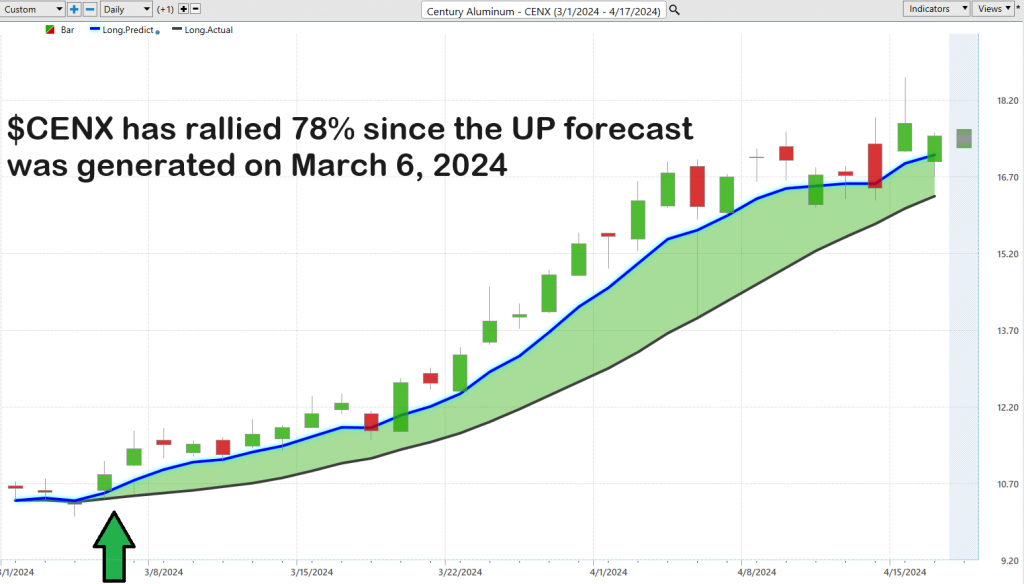
VantagePoint A.I. Predictive Blue Line Analysis
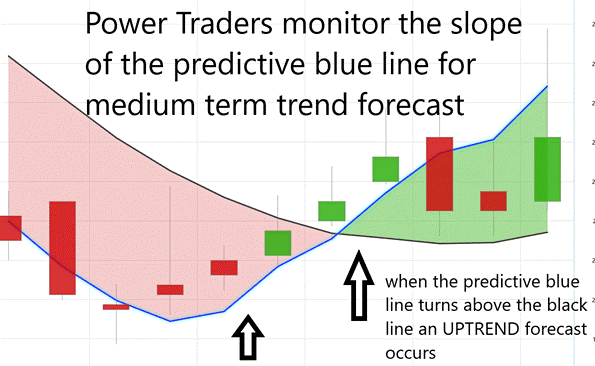
Our guiding principles are as follows:
– The trajectory of the predictive blue line dictates the trend forecast and overall trajectory of $CENX.
– Ideally, the VALUE ZONE is determined to seek buying opportunities at or below the predictive blue line or selling opportunities above it during a downtrend.
– Naturally, as the predictive blue line slopes downward, traders anticipate lower prices, either retreating to the sidelines or hedging their positions.
In trading, the quest for cutting-edge tools is relentless. VantagePoint Software emerges as a leader in the fintech space, utilizing artificial intelligence to predict market trends. It introduces the “A.I. predictive blue line,” serving as a financial guidepost, offering traders insights into market directions, and pinpointing the ‘value zone’ for prime trading decisions. This innovative tool, fueled by neural networks and intermarket analysis, digs deep into the factors that determine prices, revealing the true value of assets and informing strategic trading decisions.
The role of VantagePoint’s predictive blue line goes beyond just indicating market direction; it directs traders to the ‘value zone,’ an essential area in an uptrend that highlights a stock’s real value. This isn’t just speculation; it’s the result of advanced A.I. that combines neural networks with intermarket analysis to uncover underlying values.
Additionally, the black line, which reflects the 10-day simple moving average, provides a historical context of recent price actions, enhancing the predictive power of the blue line. The interplay between these lines, merging past and future data, crystallizes trading opportunities, showcasing VantagePoint’s groundbreaking integration of neural network technology and market analysis for those navigating the swift currents of the financial markets.
In summary, a quick look at the chart with VantagePoint’s AI at work offers a clear forecast, arming traders with essential insights into market trends.
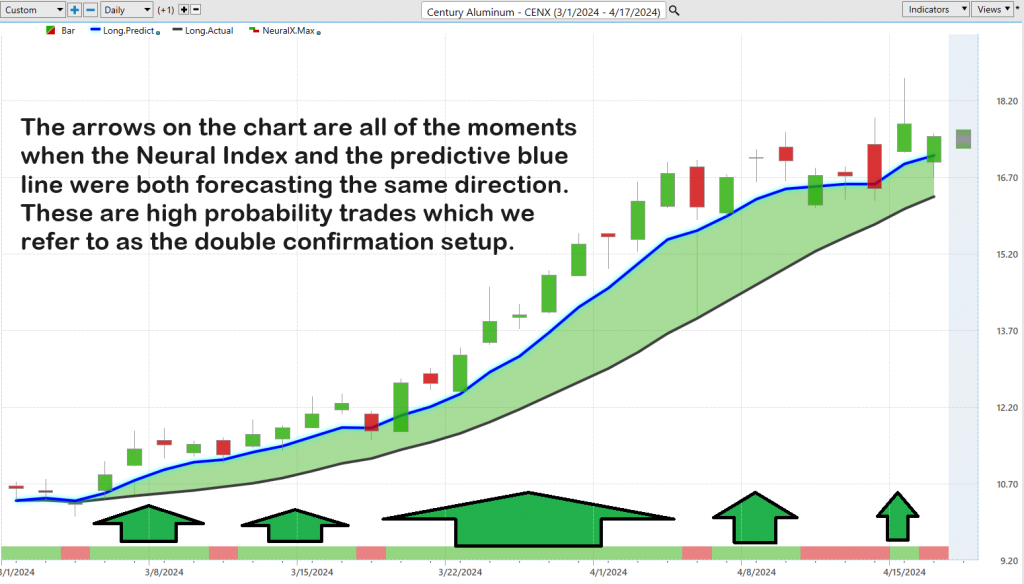
VantagePoint A.I. Neural Index
The neural index stands out as a revolutionary tool, fundamentally enhancing how traders make decisions. Constructed using advanced neural network technology, this index analyzes a vast array of market data to forecast short-term movements, typically over a 48–72-hour period. By effectively predicting whether the market will move up or down in the immediate future, the neural index allows traders to anticipate market trends rather than just react to them. Its integration into trading platforms can significantly sharpen a trader’s ability to time their trades more precisely, optimizing entry and exit points. This predictive power, when used alongside traditional market analysis tools, equips traders with a deeper understanding of market dynamics, improving their strategic decisions and potentially leading to higher profitability in an environment where every second counts.
The arrows on the chart are all of the moments when the Neural Index and the predictive blue line were both forecasting the same direction. These are high probability trades. We refer to this as the double confirmation setup.
VantagePoint A.I. Daily Trading Range Forecast
Every short-term trader knows the drill—it’s all about finding that perfect timing to jump in and out of the market. In this high-octane trading environment, being just a fraction of a second ahead can mean the difference between banking a profit or taking a hit. Now, imagine unleashing the power of AI, machine learning, and neural networks. These aren’t just fancy tech terms; they are game changers, slicing through historical data, spotting patterns, and predicting market moves with stunning precision. This is where trading transcends traditional analysis—it becomes a strategic edge, transforming unpredictable market waves into navigable waters and setting the stage for sharp, informed trading maneuvers. It’s about bringing the invisible to light, transforming raw risk into a finely-tuned strategy.
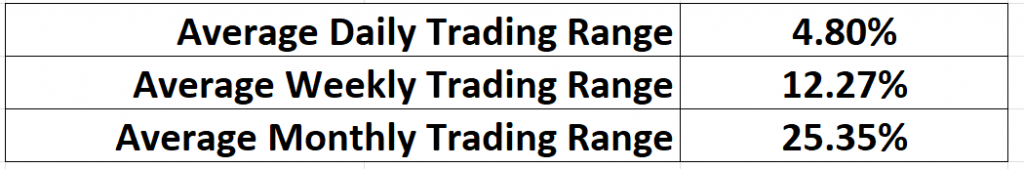
But let’s get real about the everyday grind—think about the average trading ranges—daily, weekly, monthly—over the last year.

Here’s the kicker: knowing these ranges isn’t the end game. The real deal is pinpointing those critical price levels for buying and selling. Enter the Daily Range Forecast chart, a modern-day tool for the agile short-term swing trader. This chart isn’t just another piece of the puzzle; it’s the map that reveals the probable path for each trading day. Armed with Vantagepoint A.I., this tool goes beyond the old-school methods, tapping into the market’s very beat. It’s a lifeline for Power Traders, allowing them to cut through market noise with extraordinary precision, spotting the best spots to enter and exit with crystal clear clarity.
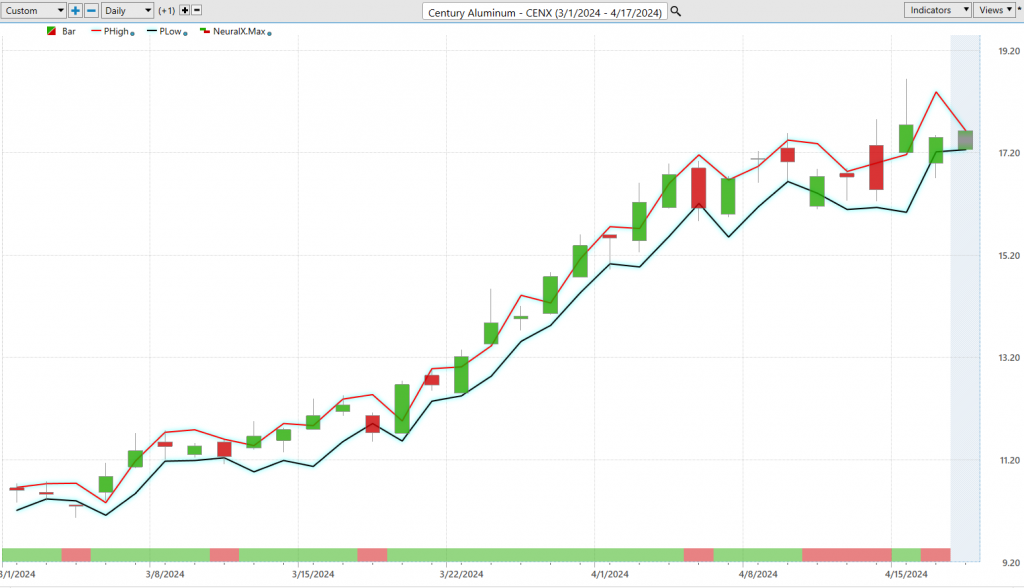
Observe how clearly the trend is delineated!
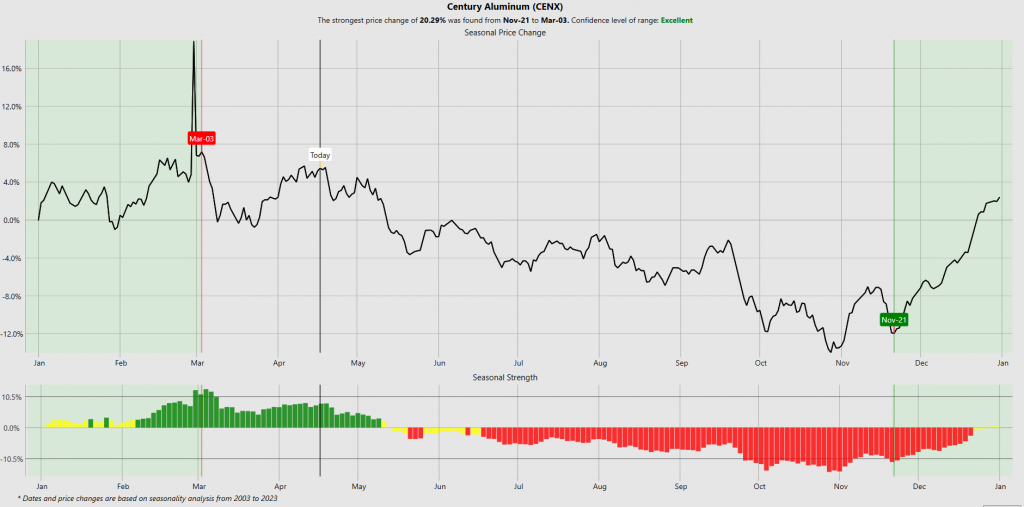
VantagePoint A.I. Seasonal Trend Analysis
Seasonal analysis in trading is a method used to identify and capitalize on patterns that occur at specific times of the year. This approach is based on the premise that certain financial markets, stocks, or commodities exhibit predictable behaviors during particular seasons or months. These patterns can result from various factors such as changes in consumer behavior, agricultural cycles, fiscal policy changes, and holiday effects among others.
The first step involves gathering historical price data for the asset in question over several years. Analysts look for recurring patterns in the data that correlate with specific times of the year. This might involve statistical methods to ensure that observed patterns are significant and not due to random fluctuations. Tools like charts and graphs are often used to visualize these seasonal trends, making it easier to identify periods of strength or weakness.
To verify the reliability of these patterns, statistical tests can be applied to determine if the seasonal trends are statistically significant and not just coincidental.
By understanding the seasonal fluctuations in market prices, traders can better manage risk, adjusting their portfolio exposure according to expected seasonal volatility.
Seasonal trends can help in structuring a portfolio to take advantage of different assets’ peak performance times throughout the year, thereby smoothing out returns and reducing volatility.
It is often used in conjunction with technical and fundamental analysis to validate trading decisions, providing a more holistic view of the market.
In summary, seasonal analysis can provide valuable insights into historical patterns that repeat during specific times of the year, but it should not be used in isolation. Integrating it with other trading tools and methods helps create a more robust trading strategy that accounts for multiple factors influencing market dynamics.
Here is the seasonal chart for $CENX. You can see how effectively it has worked for $CENX. More importantly, observe how the seasonal tendency for $CENX is for lower prices moving forward. It will be interesting to watch and see if the sanctions will disprove this very strong seasonal tendency.
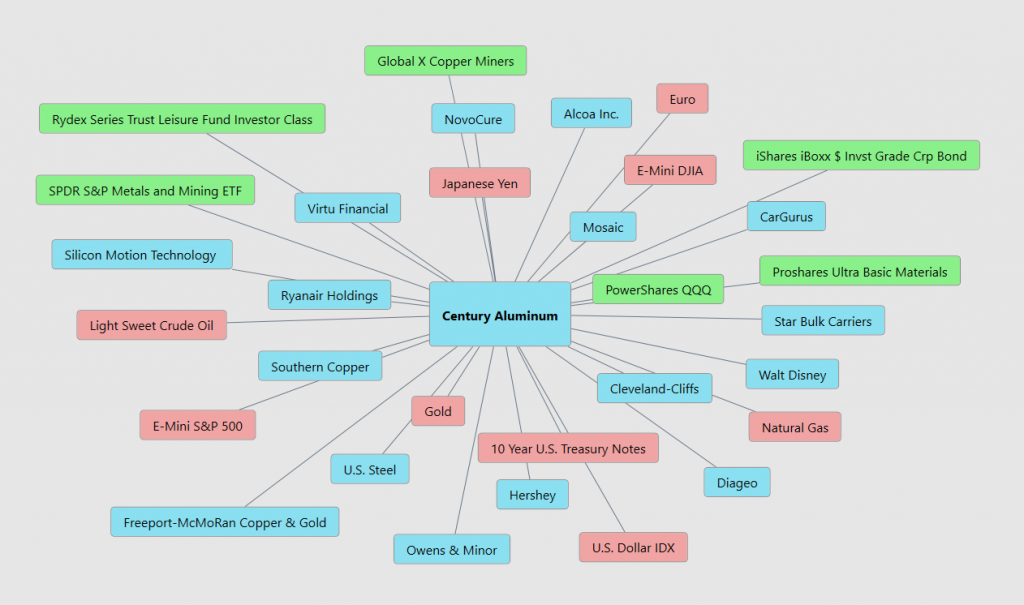
Intermarket Analysis
Intermarket analysis is a method used in trading and investing to evaluate potential market movements by analyzing relationships between different asset classes. These asset classes typically include stocks, bonds, commodities, and currencies. The core premise behind intermarket analysis is that these markets do not operate in isolation; rather, they are interconnected in ways that can significantly impact each other. For instance, a change in the interest rates set by a central bank can affect currency values, which in turn can impact commodity prices and stock market indices.
Intermarket analysis can also help in understanding how movements in key markets like oil or gold can affect specific industry sectors, which can be critical for stock traders. By understanding the interdependencies between different markets, traders can better manage risks and diversify their investment portfolios to hedge against potential losses.
Knowledge of intermarket dynamics enables traders to plan their trades based on predictive analysis of how one market’s movement could affect another, optimizing entry and exit points for trades.
Both John J. Murphy and Lou Mendelsohn have been pioneers in developing intermarket analysis for traders. Murphy has been a pivotal figure in popularizing the concept of intermarket analysis with his seminal book, “Intermarket Analysis: Profiting from Global Market Relationships,” published in 1991. In this book, Murphy discusses how traders can use the relationships between markets to forecast the direction of stocks, bonds, and commodities to improve their trading strategies. His work is widely regarded as foundational in the field of technical analysis and is utilized by financial analysts and traders around the world.
Lou Mendelsohn is also a significant figure in the development of intermarket analysis, particularly known for his contributions to the field of trading software. He is the founder of VantagePoint Software. He was one of the pioneers in creating software that allows for the analysis of multiple markets simultaneously by using computer models to predict market trends based on the interrelationships among global markets. Mendelsohn’s work brought a more systematic and software-driven approach to intermarket and trend analysis, helping to advance the use of technology in trading strategies.
Both John Murphy and Lou Mendelsohn have greatly contributed to the understanding and application of intermarket analysis, each bringing unique perspectives and methodologies that have helped shape modern trading practices. Their contributions have facilitated a more integrated and holistic approach to analyzing financial markets.
Our Suggestion
Century Aluminum has benefited from the anticipation and the reality that sanctions on Steel and Aluminum were placed on China and Russia. The duration of tariffs imposed by one government on another can vary widely depending on the underlying reasons for their imposition, the effectiveness of the tariffs in achieving their intended goals, and the diplomatic negotiations between the involved parties. There is no standard duration for tariffs, and they can last from a few months to several years.
Tariffs are often used as tools to protect domestic industries from foreign competition, correct trade imbalances, or respond to unfair trade practices. If the government believes the tariffs are effective in meeting these goals, they may be kept in place longer. The economic impact of tariffs on domestic businesses and consumers can lead to adjustments in the duration. If tariffs lead to higher prices and economic hardship domestically, there may be pressure to remove them sooner.
If the targeted country retaliates with its own tariffs, it could lead to a prolonged trade dispute where tariffs remain in place longer as part of a “trade war.”
Historically, tariffs can last from just a few months to more than a decade. For instance, some of the tariffs introduced during trade disputes between major economies in the late 2010s are still in effect, while others have been renegotiated or lifted within a few years. The duration is often contingent on ongoing political and economic evaluations.
On the balance sheet side of things $CENX carries a lot of debt. Currently they have $479.2 million in debt. Their debt to equity ratio stands at 1.35 indicating that they have $1.35 of debt for every dollar of equity.
The stock is overvalued. But in a trade war environment, stocks like $CENS can skyrocket as supplies become very limited. The next earnings call for $CENX is May 6, 2024. If they can show significant earnings they can extend the current rally. However, in the absence of earnings it is hard to get excited about a company that has lost money in 7 of the last 8 years.
We urge extreme caution in trading $CENX with very small position sizing. The seasonal tendency is for lower prices starting in the next month. Practice good money management on all of your trades and rely on the daily range forecast for future guidance.
The trend is up but volatility is expected to increase.
Let’s be careful out there!
It’s not magic. It’s machine learning
Disclaimer: THERE IS A HIGH DEGREE OF RISK INVOLVED IN TRADING. IT IS NOT PRUDENT OR ADVISABLE TO MAKE TRADING DECISIONS THAT ARE BEYOND YOUR FINANCIAL MEANS OR INVOLVE TRADING CAPITAL THAT YOU ARE NOT WILLING AND CAPABLE OF LOSING.
VANTAGEPOINT’S MARKETING CAMPAIGNS, OF ANY KIND, DO NOT CONSTITUTE TRADING ADVICE OR AN ENDORSEMENT OR RECOMMENDATION BY VANTAGEPOINT AI OR ANY ASSOCIATED AFFILIATES OF ANY TRADING METHODS, PROGRAMS, SYSTEMS OR ROUTINES. VANTAGEPOINT’S PERSONNEL ARE NOT LICENSED BROKERS OR ADVISORS AND DO NOT OFFER TRADING ADVICE.


