| This week’s stock analysis is CARVANA -$CVNA |
This week we decided to review a stock which we wrote about back on February 22, 2023, Carvana ($CVNA). At the time we pointed out how the stock had lost almost 98% from its all-time highs and looked like it was due for a rally in spite of its horrific financial condition. Here is what we wrote:
Carvana has never been profitable and is bleeding money hand over first. It is releasing its next earnings on February 23, 2023. They are expected to post losses of -$2.30 per share. If the number is smaller than that it will be considered an earnings surprise and the rally will continue. If not, expect the volatility that $CVNA has experienced over the past year to continue.
Keep in mind that $CVNA has $6 billion in debt on its balance sheet and only $318 million in cash. A few more bad quarters and it will run out of money and will either file for bankruptcy or will be purchased by one of its rivals.
This is why it deserves to be on your trading radar.
We have learned from years and years of observation that when a stock loses almost all its value in a 52-week time frame it is time to put on the discriminating trader hat. These types of meltdowns can and often reverse very quickly.
This type of speculation requires patience for the setup to develop and to be effective it should only be pursued in a very tiny segment of a portfolio. But when guided by the A.I. forecast the opportunity can be very lucrative.
Carvana, the online used-car marketplace, has been a hot topic of debate among investors in recent years. The bulls and bears have been locking horns, with the former lauding the company’s innovative business model and the latter pointing out its glaring financial shortcomings. The bulls seemed to have the upper hand in 2020 and early 2021 as Carvana’s shares skyrocketed over 1,000% in a few short years. However, the tables turned in late 2021 and 2022 when the bears had their day, and the stock plummeted more than 98% to under $5 by the end of 2022.
The first quarter of 2023 brought a mixed bag of results for Carvana. On the one hand, the company’s revenue took a 25% hit year over year, falling to $2.6 billion. On the other hand, the gross profit saw a 14% increase to $341 million, thanks to improved margins on each vehicle sold through its platform. This helped reduce the company’s quarterly operating loss from $506 million in 2022 to $288 million in the first three months of 2023. Despite still being in the red, the stock got a boost after these results were released in early May, suggesting that investors were bracing for a higher operating loss.
However, the elephant in the room for Carvana has always been its cash flow, or lack thereof. Since its public debut, the company has yet to generate positive free cash flow, burning through $1.12 billion over the last 12 months. While some may argue that the cash burn has been significantly reduced compared to previous years, the company still has a long way to go before it can claim a stable financial position.
If the declining revenue trend continues, it’s hard to see how Carvana can achieve financial stability, despite recent improvements in gross margins. Management is relying on improved margins in the second quarter due to expense reductions, but retail units sold are still expected to decline from 2022.
Adding to the company’s woes, Ally Financial, a leading automotive lender and major Carvana partner, projects that used car prices will fall by more than 15% by the end of 2023. This suggests that Carvana will face a macroeconomic headwind for the rest of the year as used car prices fall.
Carvana’s balance sheet and liquidity issues are another cause for concern. At the end of the first quarter, Carvana had $488 million in cash, $1.7 billion in short-term debt, and a staggering $6.55 billion in long-term debt. With a net interest expense of $160 million in the first quarter alone, it’s unlikely the company will be able to raise more debt given its already heavy debt load, stagnant revenue growth, and lack of profitability.
If the company continues to burn cash at its current rate, it could run out of money this year, potentially leading to bankruptcy or a stock offering, both of which spell bad news for shareholders. Or it will potentially be acquired by one its many online competitors.
Furthermore, it’s difficult to see how Carvana can return to growth given the projected decline in used car prices, it’s unlikely that the company will be able to turn its cash flow positive over a trailing 12-month period.
Unless Carvana can drastically change its unit economics in the next few quarters, it’s unlikely to ever have a profitable business model. The company is likely to run out of cash or heavily dilute existing shareholders within the next few quarters, making the stock a very risky bet for investors at this time.
Despite the company’s precarious financial situation, Carvana’s stock has been influenced by an upgraded credit rating, revised financial guidance, and a short squeeze. However, these factors do not change the fundamental challenges the company faces, including its massive debt and urgent need to generate consistent cash flows.
While the recent price surge may seem promising, a closer look under the hood reveals a company still struggling to navigate a rough road ahead. The novelty of its used-car vending machines is wearing off, and the company is operating on a shoestring budget. With $6.6 billion of long-term debt balanced against just $488 million in cash reserves and $1.5 billion in vehicle inventories, Carvana needs to start generating cash profits soon. Until it does, its unpredictable share price volatility will continue to be a fact of life.
What is incredible about the situation with Carvana at the present time is that its valuation stands at $6 billion, and it has never been profitable. If $CVNA does not find a solution to its business volume it will burn through its cash reserves in the coming year. Its competitors would be the most likely candidates to acquire the failing company and would most likely do so at significantly lower prices.
Here is the short list of online auto sellers:
Vroom (NASDAQ: VRM)
CarMax (NYSE: KMX)
eBay (NASDAQ: EBAY)
Cars.com (NYSE: CARS)
Cazoo (NYSE: CZOO)
Auto1 Group (XTRA: AG1)
In this weekly stock study, we will look at and analyze the following indicators and metrics as are our guidelines which dictate our behavior on a particular stock.
- Wall Street Analysts’ Estimates
- 52-week high and low boundaries
- Best Case – Worst Case Analysis
- Vantagepoint A.I. Triple Cross Forecast
- Neural Network Forecast
- Daily Range Forecast
- Intermarket Analysis
- Our trading suggestion
We don’t base our decisions on things like earnings or fundamental cash flow valuations. However, we do look at them to better understand the financial landscape that a company is operating under.
Analysts Ratings
The first set of boundaries which we explore in our stock study is what do the professionals think who monitor the stock for a living. We can acquire this information by simply looking at the boundaries that the top Wall Street Analysts set for $CVNA. This initial set of boundaries provides us with an idea of what is expensive, fairly valued, and cheap.
The 16 analysts offering 12-month price forecasts for Carvana Co have a median target of $11.50, with a high estimate of $29.00 and a low estimate of $1.00. The median estimate represents a -67.92% decrease from the last price of $35.85. From this simple analysis, we can see that expectations for the future vary greatly, which is the recipe for volatility that we are normally looking for.
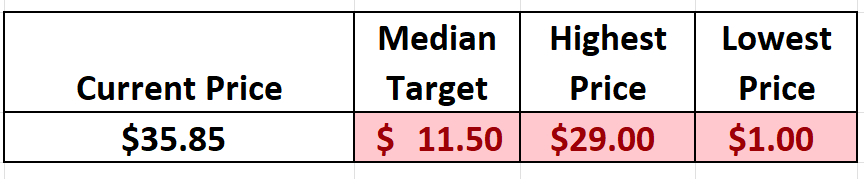
These giant variances in price estimates from Wall Street Analysts who watch the stock 24/7 show you how much volatility and uncertainty is baked into $CVNA at the present time.
52-week High-Low Chart
We always pay attention to where we are trading in relation to the 52-week range. Being aware of where the stock is trading allows us to understand how value has been defined over the last 52 weeks.
$CVNA is currently trading at its 59th percentile on the 52-week chart.
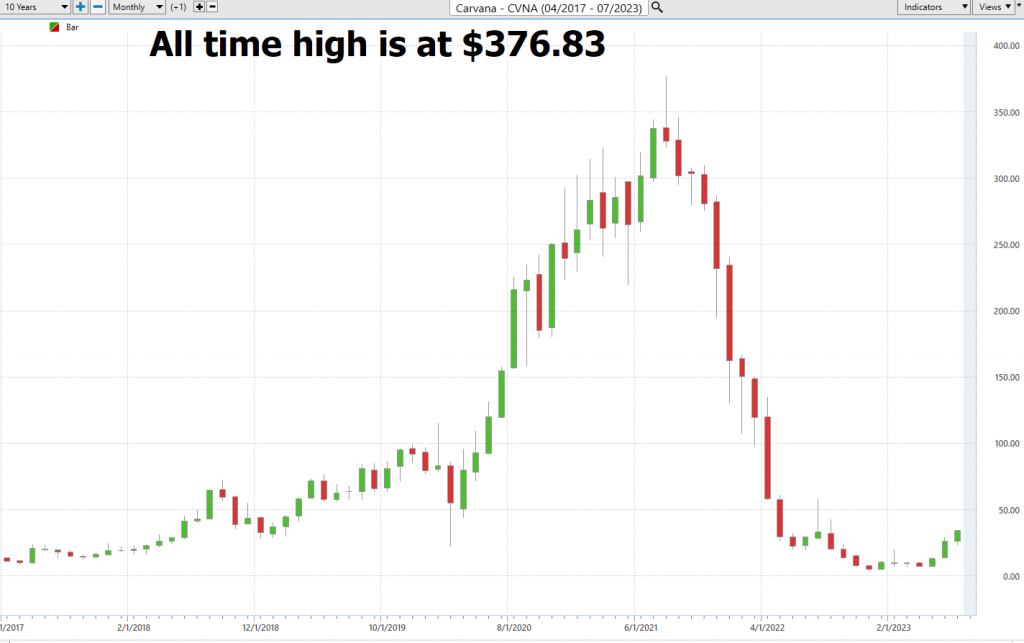
On the longer-term chart you can see a large part of the severe decline in price, followed by a consolidation after the price bottomed out during the week of 12/9/22 at $3.55. Since that low was established, prices have rallied $31.04 or 774%.
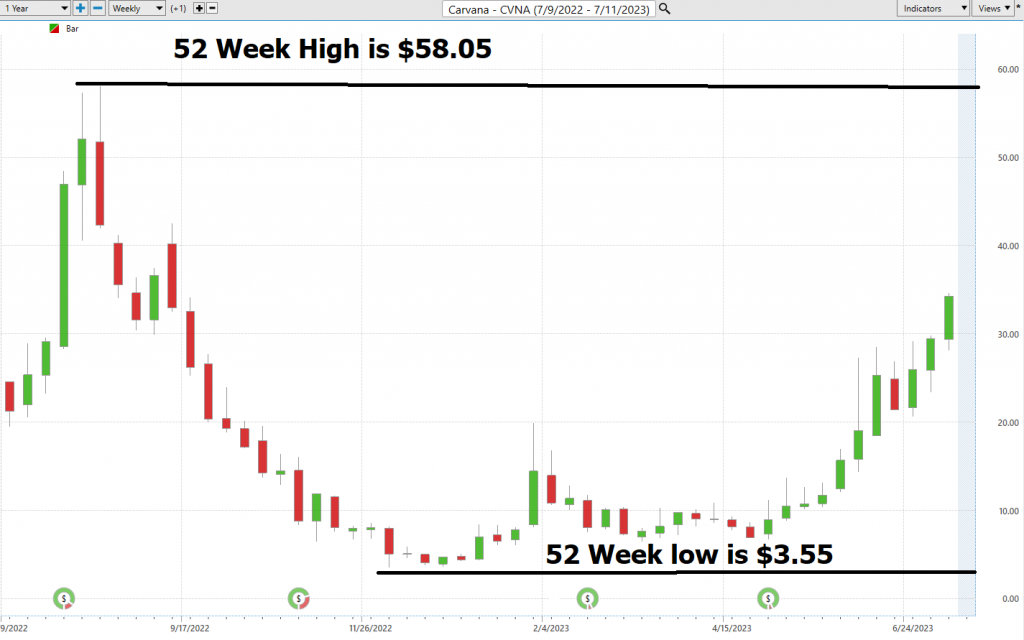
The midpoint price for the year is $27.25, this is the halfway point between the low and high prices for the year. The average price for the year is $16.65. We pay attention to these boundaries and view them as important benchmarks.
The 52-week high and low boundaries of a stock price serve as critical reference points for traders and value investors. They provide insights into the stock’s volatility and potential resistance or support levels, which can guide trading decisions. Furthermore, these boundaries can signal a stock’s momentum, with prices near the 52-week high often indicating bullish sentiment, and prices near the 52-week low suggesting bearish sentiment.
Looking at the longer-term chart allows us to see the very volatile journey that $CVNA has been on.
Best Case – Worst Case Analysis
Conducting a best-case and worst-case analysis of a stock is akin to viewing the same scenario through two distinct lenses, each offering a unique perspective. This approach equips investors with a comprehensive understanding of both the potential gains and risks tied to each perspective and more importantly highlights the volatility of the asset. It enables them to gauge their exposure to potential losses, adjust as needed, and evaluate the worthiness of a specific stock. In essence, it’s an indispensable method for balancing risk against reward and strategically aligning trading portfolios for financial prosperity. The objective of this process is to juxtapose the potential risks and rewards, thereby allowing us to evaluate how the stock’s rallies stack up against its declines.
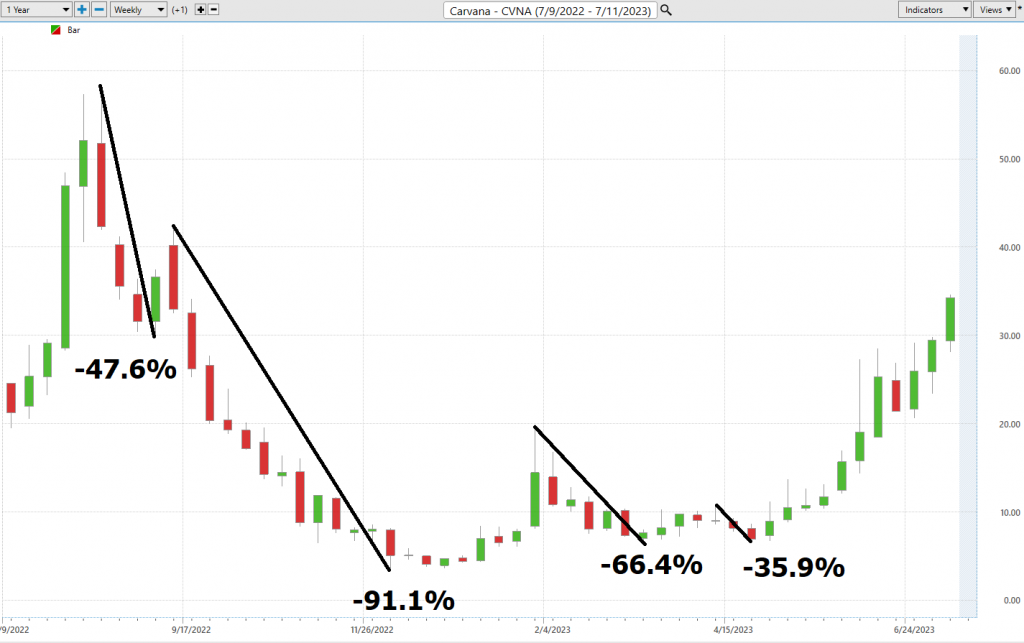
Here is the worst-case analysis:
Followed by the best-case analysis:
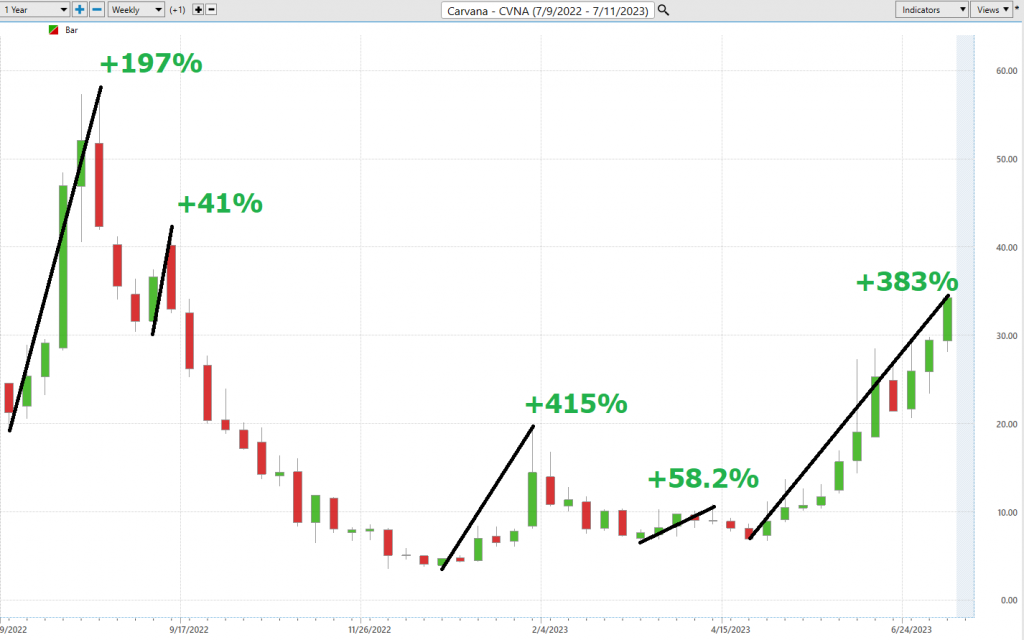
Clearly the volatility in $CVNA must be respected.
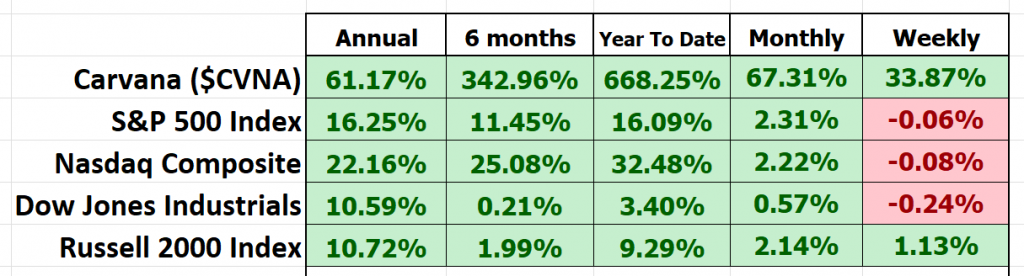
Next, we want to evaluate $CVNA is in comparison to the performance of the major stock market indexes which we have greater familiarity with.
This allows us to quickly see how much more volatile $CVNA has been than the broader stock market.
Lastly, we like to drill down to the main competitors in the sector to determine who are the leaders and losers and have an idea of relative performance within the sector.
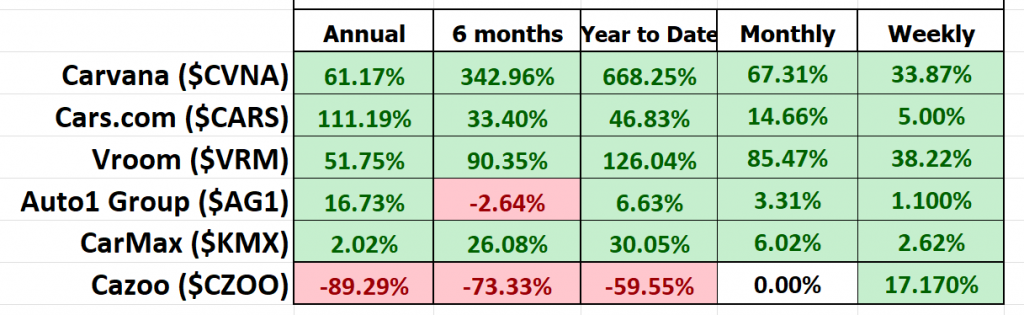
In this final analysis we can quickly see how $CVNA has fared in relation to its direct competitors. While it has outperformed, we must evaluate that conclusion against the reality that $CVNA has never had positive cash flow.
The VantagePoint Triple Cross Indicator
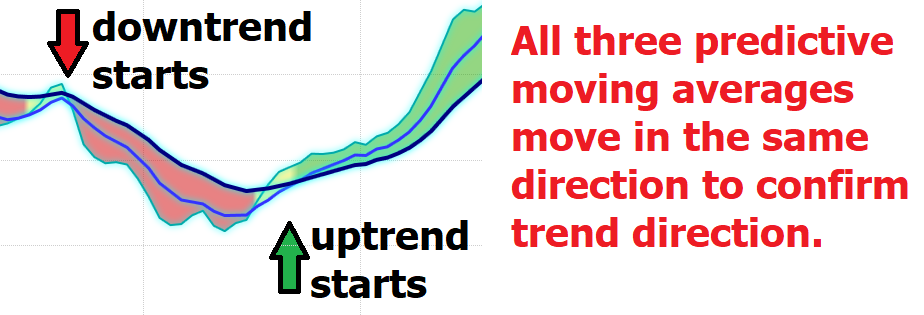
The Vantagepoint A.I. Triple Cross indicator, is a powerful tool that uses three predictive moving averages, as opposed to the typical two. This triple-threat consists of a 3-day, an 8-day, and an 18-day predictive moving average, each corresponding to short-term, medium-term, and long-term analysis. This trio provides early alerts and confirmation of valid trend signals.
The beauty of the Triple Crossover is that it reduces the number of trades by patiently waiting for crossover confirmation from all three predictive moving averages. When the short-term average crosses the medium-term, it’s like a flare in the sky, signaling a potential trend change. When the medium-term crosses the long-term, it’s the confirmation we’ve been waiting for. The alignment of all three averages is the green light for the start of a trend.
The use of predictive data is like having a crystal ball. It reduces time lag and shields against premature entries and false signals that can be caused by choppy or volatile markets.
To sum it up, the Triple Crossover is like your personal trading assistant, providing an early heads-up of a trend change, confirmed by a second and third predictive moving average crossover. It’s like having a filter that screens out premature signals, potentially offering fewer but higher quality trades.
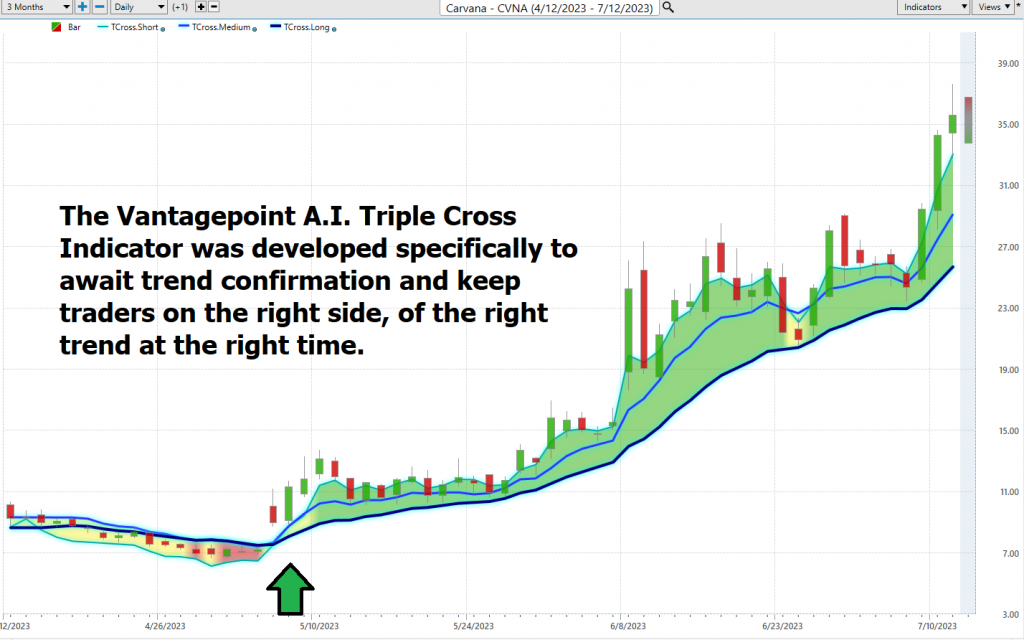
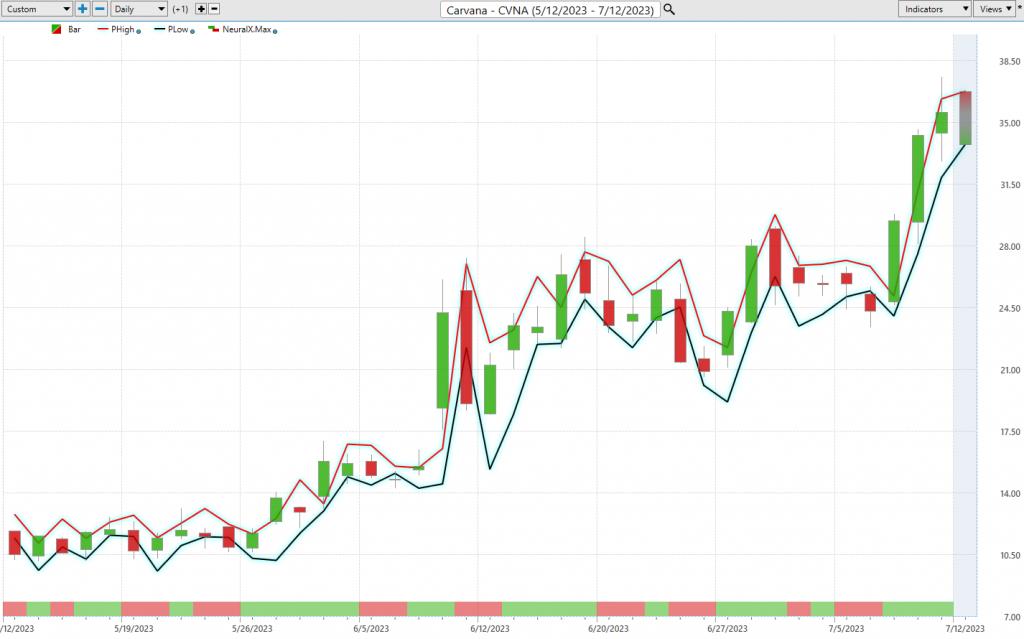
Now, let’s take a look at the chart of Carvana ($CVNA) over the last several months.
Fine Tuning Entries with The Neural Net Indicator
The Neural Network Indicator serves as a trend confirmation indicator. It resides at the bottom of the chart, predicting future market strength or weakness. When the Neural Net Indicator is green, it signals market strength. Conversely, a red Neural Net forecasts short-term market weakness.
We strongly recommend that our Power Traders cross-reference the chart with the Triple Cross indicator and the Neural Network Indicator. This practice can help pinpoint optimal entry and exit points, enhancing trading efficiency.
A Neural Network is a sophisticated learning system that processes vast amounts of data to produce a desired output. It continually self-monitors and enhances its performance, much like a human brain. This advanced form of artificial intelligence (A.I.) is a game-changer in financial trading, enabling the recognition of patterns and decision-making based on these patterns.
Neural networks are typically structured like a web, with each node representing an individual neuron. As data is fed into the system, it is continually scrutinized and processed through this network of neurons and inputs. The output can reveal crucial insights into market trends or optimal trading strategies.
By cross-referencing various financial and economic factors, such as stock prices or consumer sentiment, neural networks equip traders with rapid decision-making capabilities, crucial in fast-moving markets. This technology can minimize mistakes by eliminating human error and enhancing decision-making accuracy for traders.
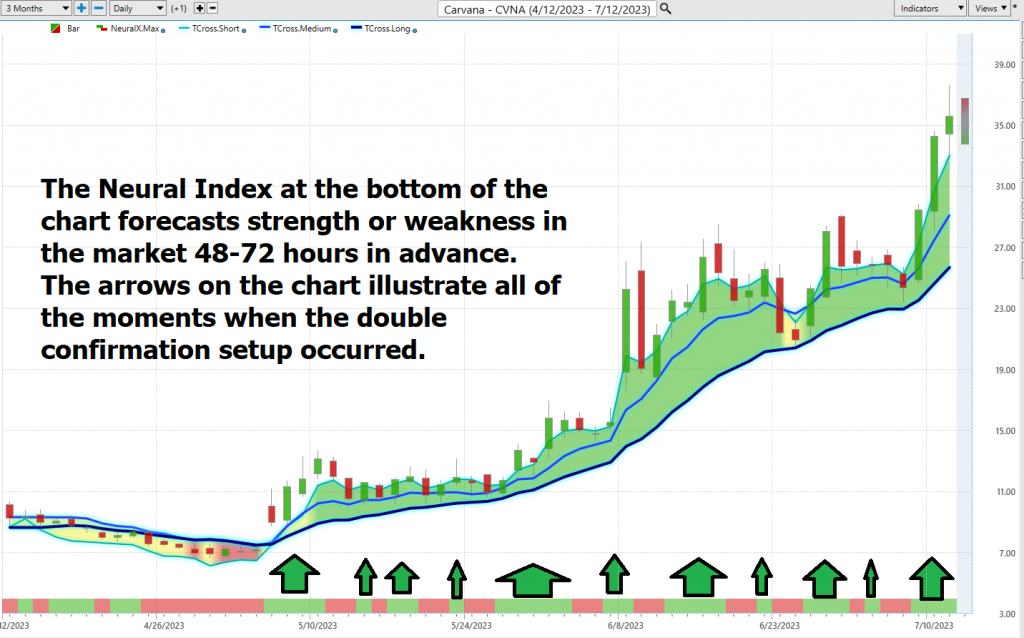
Power Traders are always seeking to leverage both the neural network and A.I. to unearth statistically sound trading opportunities. We refer to this as a “double confirmation” setup, where we look for the predictive blue line to slope higher and be confirmed by the Neural Net at the bottom of the chart.
We advise Power Traders to cross-reference the triple cross indicator with the Neural Net for the best entry opportunities.
The chart above illustrates how the Neural Net offered several opportunities of double confirmation to Power Traders, when the Triple Cross and the Neural Net aligned with the same forecast. These instances provide extremely high probability trading opportunities to exploit the trend.
VantagePoint Software Daily Price Range Prediction
In our VantagePoint A.I. Software, Power Traders have a powerful tool at their disposal – the Daily Price Range prediction forecast. This feature is a game-changer, allowing Power Traders to fine-tune their market entries and exits with precision.
What’s the key concern for traders? It’s knowing where to enter and exit a market. VantagePoint delivers this information with pinpoint accuracy. The Daily Range forecast is updated daily, providing insights into anticipated price action.
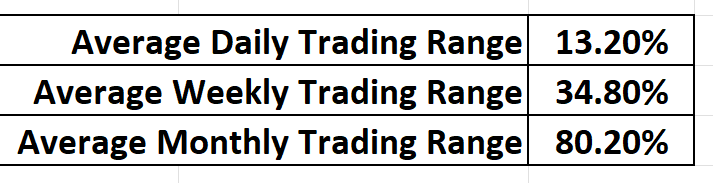
Over the past year, Carvana ($CVNA) has demonstrated the following percentages in daily, weekly, and monthly time frames. These figures underscore the volatility of $CVNA, a double-edged sword as evidenced by our shared charts and studies.
Here is what the daily, weekly, and monthly trading range stats looked like over the past year.
By cross-referencing the double confirmation setup with the daily range forecast, Power Traders are alerted to swing trading opportunities with exacting precision. The efficacy of the daily range forecast is evident when studying the following chart. Assuming you placed your protective stop slightly below the dark line, you would have captured almost the entirety of the entire upward movement.
Intermarket Analysis
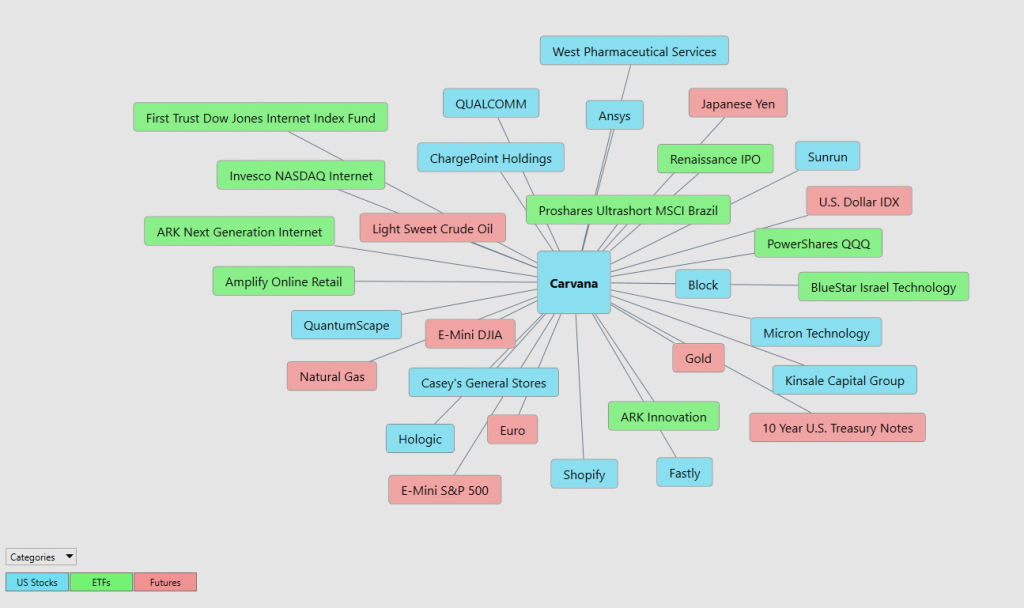
One of the standout features of the Vantagepoint Software is its ability to perform Intermarket analysis. It excels at identifying assets that are statistically interconnected and play a pivotal role in driving price.
While chart analysis can provide objective insights into support and resistance levels, it’s crucial to remember that we operate in a global marketplace where everything is interconnected. The billion-dollar question for traders is always: what are the key drivers of price for the asset I’m trading?
These influential factors, though invisible to the naked eye, often show high statistical correlations. Minor shifts in interest rates, crude oil prices, and dollar volatility, among thousands of other variables, can significantly impact the decisions companies make to navigate these challenging times. Identifying these factors is one of the major challenges facing investors and traders.
There’s immense value in studying and understanding the key drivers of Carvana’s ($CVNA) price action. By doing so, you can often predict which ETFs are most likely to acquire $CVNA and identify other industries that influence $CVNA’s price movement.
This information is invaluable as it allows a trader to spot other opportunities and see a list of the ETFs that are also buyers of $CVNA. This knowledge often leads to the discovery of other trading opportunities in their nascent stages.
Suggestion
Carvana is yet to turn a profit and is hemorrhaging cash at an alarming rate. The company is set to release its next earnings report on August 3, 2023. Expectations are that they will lose $1.22 per share. Last year during this same time frame they lost $2.35 per share. While this is a marked improvement, they are still losing money quarter after quarter and have yet to turn a profit.
The performance of the stock in no way reflects the soundness of the business. Trading opportunities exist because of the tremendous volatility. However, we advise new traders to stand aside. Experienced traders should consider trading with less than 1% of your portfolio and simply look for short-term swing trading opportunities. The volatility of $CVNA fits perfectly with the ai forecasts. But engaging with $CVNA must be perceived and understood to be highly speculative.
With $6.6 billion of long-term debt balanced against just $488 million in cash reserves and $1.5 billion in vehicle inventories, Carvana needs to start generating cash profits soon. Until it does, its unpredictable share price volatility will continue to be a fact of life. A few more disappointing quarters could see the company running out of funds, potentially leading to bankruptcy or acquisition by a competitor.
The stock’s volatility is off the charts, making it one of the most tumultuous assets we’ve ever analyzed. We chose to scrutinize it primarily because it’s an asset that has shed 98% of its value in less than two years and we correctly anticipated a healthy bounce with the assistance of the ai.i forecasts in the Vantagepoint Software.
We’ll be closely following the Triple Cross for guidance. Brace for significant volatility post-earnings. For seasoned traders, this could be an excellent opportunity. However, newcomers should proceed with caution.
Our advice: Follow the A.I. trend analysis and practice good money management on all your trades.
$CNVA deserves to be on your radar. It might take several months to unfold but if it makes a new closing high, we think it will run substantially higher very quickly. Since we are trading 15% under the highest monthly close, we suggest you watch that level on this stock very closely.
We will re-evaluate this analysis based upon:
- Wall Street Analysts’ Estimates
- 52-week high and low boundaries
- Vantagepoint A.I. Triple Cross Indicator
- Neural Network Forecast
- Daily Range Forecast
- Intermarket Analysis
Let’s Be Careful Out There!
Remember, It’s Not Magic.
It’s Machine Learning.
Disclaimer: THERE IS A HIGH DEGREE OF RISK INVOLVED IN TRADING. IT IS NOT PRUDENT OR ADVISABLE TO MAKE TRADING DECISIONS THAT ARE BEYOND YOUR FINANCIAL MEANS OR INVOLVE TRADING CAPITAL THAT YOU ARE NOT WILLING AND CAPABLE OF LOSING.
VANTAGEPOINT’S MARKETING CAMPAIGNS, OF ANY KIND, DO NOT CONSTITUTE TRADING ADVICE OR AN ENDORSEMENT OR RECOMMENDATION BY VANTAGEPOINT AI OR ANY ASSOCIATED AFFILIATES OF ANY TRADING METHODS, PROGRAMS, SYSTEMS OR ROUTINES. VANTAGEPOINT’S PERSONNEL ARE NOT LICENSED BROKERS OR ADVISORS AND DO NOT OFFER TRADING ADVICE.