




This week’s AI stock spotlight is Brinker International ($EAT)
Brinker International has a wonderfully American corporate history. Founded in 1975: the first Chili’s opened in Dallas with burgers, beer, and the radical proposition that people enjoy eating things they recognize. Chili’s eventually became part of the restaurant empire assembled by Norman Brinker, and the company evolved into Brinker International. Their mission was to: give ordinary people an affordable, enjoyable restaurant experience without requiring them to pronounce anything in French. Brinker expanded, acquired brands, sold others, and ultimately concentrated its firepower around Chili’s and Maggiano’s Little Italy. Today, Brinker owns, operates, or franchises more than 1,600 restaurants across 29 countries and two U.S. territories, making it large enough that when Americans suddenly decide mozzarella sticks are a financial priority, Wall Street notices.
Brinker matters because Chili’s has become one of the more remarkable turnaround stories in casual dining. This is an industry where success traditionally requires convincing consumers to leave a perfectly functional refrigerator, drive somewhere, wait for a table, tip 20%, and pay $14 for something they could theoretically make at home. Brinker has been succeeding because Chili’s figured out that consumers want value, familiarity, decent food, and a little fun. Apparently, civilization survives.
Brinker makes most of its money from Chili’s, its flagship casual-dining chain, with Maggiano’s Little Italy providing the smaller upscale Italian contribution. Revenue comes primarily from company-owned restaurant sales, supplemented by franchise-related revenue. The basic economic machinery is simple: put people in seats, sell them burgers, fajitas, chicken, pasta and margaritas, then make sure the cost of food, labor and rent does not consume the entire check.
The customer is the ordinary consumer, which means Brinker is ultimately in the disposable-income business. Its real competitors include restaurant operators such as Darden, Texas Roadhouse, Dine Brands, Bloomin’ Brands and practically every fast-food or fast-casual company offering consumers an alternative answer to the question, “What are we eating tonight?” Chili’s competitive weapon has increasingly been value. When a sit-down meal begins competing on price with a trip through the drive-through, McDonald’s starts looking less like a different industry and more like the fellow across the street.
Brinker is headquartered in Dallas and is led by President and CEO Kevin Hochman. The company reported approximately 83,840 team members as of June 25, 2025. Hochman deserves considerable credit for the Chili’s revival, which has emphasized better operations, sharper marketing, menu improvements and a value proposition consumers can understand without consulting an economist.
Now we arrive at the numbers, where restaurant stories either become businesses or expensive hobbies.
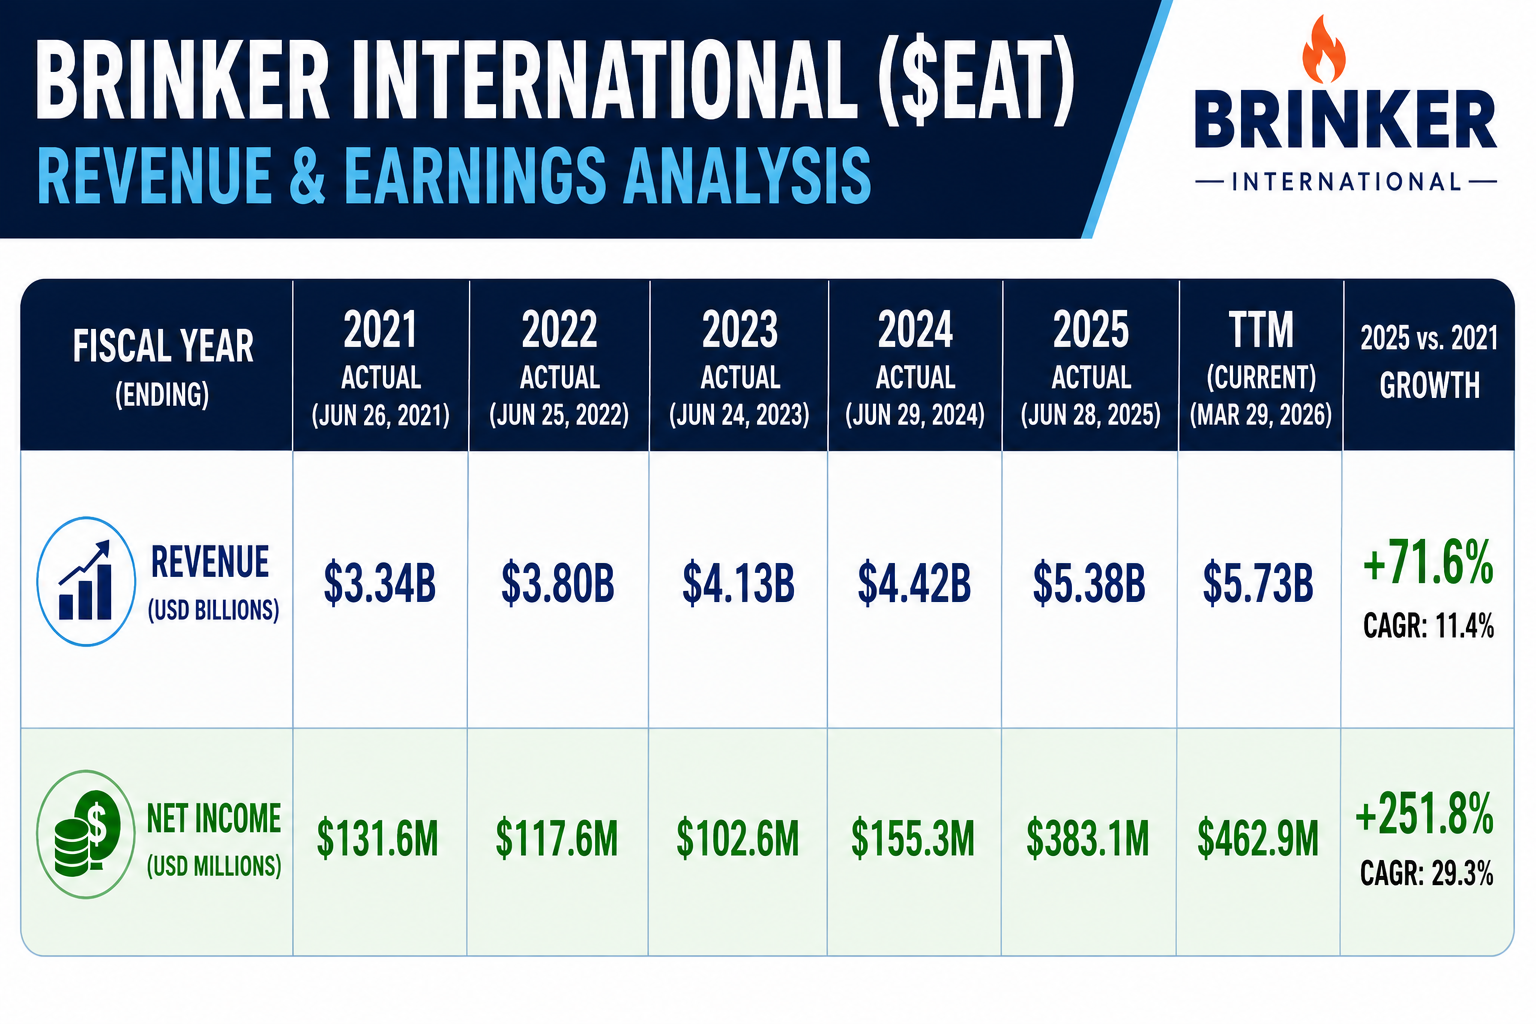
That table explains much of the stock story. Revenue climbed from roughly $3.34 billion in fiscal 2021 to $5.38 billion in fiscal 2025, while net income exploded from $155.3 million in 2024 to $383.1 million in 2025. The trailing twelve-month figures show $5.73 billion of revenue and $462.9 million of net income. More importantly, operating margin expanded from 3.49% in fiscal 2023 to 9.51% in 2025 and 10.39% on a trailing basis. That is not merely selling more hamburgers. That is getting dramatically better at making money from them.
Cash generation has improved along with profitability. Trailing free cash flow was about $504 million, versus $414 million in fiscal 2025 and only $71 million in fiscal 2023. Capital expenditures remain meaningful because restaurants have the irritating habit of requiring buildings, kitchens, equipment and remodeling rather than existing entirely in the cloud. Still, stronger operating cash generation gives Brinker considerably more financial flexibility than it had several years ago.
Debt remains something traders should watch. The balance sheet is not the sort you frame and hang over the fireplace, but improving cash flow makes the leverage more manageable. The trailing net-debt-to-EBITDA ratio was recently around 2.0, down sharply from levels above 6 several years earlier. The common mistake is looking at Brinker as though it were merely a revenue-growth story. It is increasingly a margin and cash-flow story. That distinction matters because Wall Street will pay considerably more for a company that turns an additional dollar of sales into actual profit rather than another management presentation.
The first big question traders are asking now is whether Chili’s growth is durable or whether the company has simply enjoyed the restaurant equivalent of a hit single. Comparable restaurant sales growth slowed to 3.3% companywide in fiscal Q3, with Chili’s at 4.0%, although February and March Chili’s comparable sales each grew 5.9% with positive traffic. That is respectable. It is also well below the extraordinary 21.4% Chili’s comparable-sales increase reported in fiscal Q1. The law of large numbers eventually arrives, usually without making a reservation.
The second question is whether margins can remain strong as growth normalizes. Investors already know Chili’s has staged a comeback. The stock is no longer being valued as a restaurant chain everyone forgot about. The debate now is whether management can convert higher traffic and sales into sustained earnings growth while dealing with wages, food inflation, restaurant investment and increasingly difficult year-over-year comparisons.
The news of the past 30 days has been lighter on hard financial developments and heavier on keeping the Chili’s brand culturally relevant. July promotions included a $6 Margarita of the Month and another publicity campaign tied to a special restaurant location. These stories matter at the margin because marketing has been part of the turnaround, but traders should not confuse publicity with a new earnings thesis. The real event is August 12, when Brinker is scheduled to report fiscal fourth-quarter results. That is where investors discover whether the enthusiasm has been producing enough cash to justify the enthusiasm.
And enthusiasm there has certainly been.
As of July 20, Yahoo Finance showed $EAT with a year-to-date return of roughly 35.9%, compared with only about 3.6% for the Consumer Discretionary Select Sector SPDR Fund, XLY. That is substantial outperformance. The market has not been buying Brinker because America suddenly discovered restaurants. It has been buying accelerating profitability, strong comparable sales, positive traffic, improving margins and the belief that Chili’s has cracked the value equation at precisely the moment consumers became increasingly sensitive to restaurant prices.
The 90-day rally is essentially an expectations story layered on top of improving fundamentals. Fiscal Q3 showed company sales of $1.456 billion versus $1.413 billion a year earlier. Chili’s February and March comparable sales rose 5.9% with positive traffic. Investors saw evidence that the turnaround had not disappeared simply because comparisons became harder. The market likes growth. It particularly likes growth that survives after everyone knows about it.
The upside opportunity is that Chili’s may be undergoing something bigger than a temporary promotion-driven revival. If management has genuinely rebuilt the brand around value, better food, stronger operations and culturally effective marketing, then traffic gains could prove stickier than skeptics expect. Continued margin improvement on a revenue base approaching $6 billion could produce surprisingly powerful earnings leverage.
The biggest upside surprise would be another period of accelerating Chili’s traffic without sacrificing margins. That would tell Wall Street the company is still taking market share rather than merely benefiting from price increases.
The biggest blind spot is expectations. Great companies can become dangerous stocks when everyone expects greatness before breakfast. EAT’s enormous improvement means future results are being compared not with disaster but with success. A 5% comparable-sales gain can look disappointing after investors have grown accustomed to double-digit miracles.
The catalyst calendar is straightforward. August 12, 2026: fiscal Q4 earnings, the most important near-term test of sales, traffic, margins and fiscal 2027 expectations. Late October 2026, expected: fiscal Q1 2027 earnings, when traders should get their first serious evidence of how the new fiscal year is developing. Throughout fiscal 2027: Chili’s remodeling and operational execution, particularly as the company invests in keeping the brand fresh while protecting restaurant-level economics. Earnings matter because expectations are high. Guidance matters because stocks trade on tomorrow. Remodeling matters because management now has to prove it can reinvest in the brand without turning all that beautiful free cash flow back into furniture.
The trader’s takeaway is that $EAT is best suited for momentum and growth traders who understand that the trend is being powered by improving fundamentals, not merely a fashionable ticker. The ideal setup is continued positive traffic, healthy comparable sales, disciplined pricing and margins that remain well above the levels of several years ago.
What must stay true is simple: customers must keep showing up, Chili’s must keep offering value without giving away the restaurant, and management must continue converting sales growth into earnings and cash.
The early warning sign is equally simple. Watch traffic and margins. If comparable sales remain positive only because prices are rising while customer traffic turns negative, pay attention. If margins begin retreating while sales growth slows, pay even more attention.
For now, Brinker has accomplished something Wall Street loves: it took a familiar old business and made the numbers unfamiliar in a very good way. The stock keeps rallying because revenue is growing, profits are growing much faster, margins have expanded and Chili’s is winning customers while much of the restaurant industry is still trying to figure out why people object to paying seventeen dollars for lunch.
The question facing traders is no longer whether Chili’s has turned around.
It has.
The question is how much of the next chapter is already sitting in the stock price, waiting for August 12 to pick up the check.
The following are the indicators and forecasts that we will use in this stock study to better comprehend the price action of $EAT.
Wall Street Analysts Ratings and Forecasts
52-Week High and Low Boundaries
Best-Case / Worst-Case Scenario Analysis
VantagePoint AI Predictive Blue Line
Neural Network Forecast (Machine Learning)
VantagePoint AI Daily Range Forecast
Intermarket Analysis
Our Suggestion
At VantagePoint, patented artificial intelligence informs every decision. We also examine the strength of the business just as carefully as we study the strength of the trend. When improving fundamentals and rising momentum begin telling the same story, disciplined traders should pay attention. Because the best opportunities often appear when a good business and a strong market trend are moving together.
Wall Street Analysts Price Forecasts
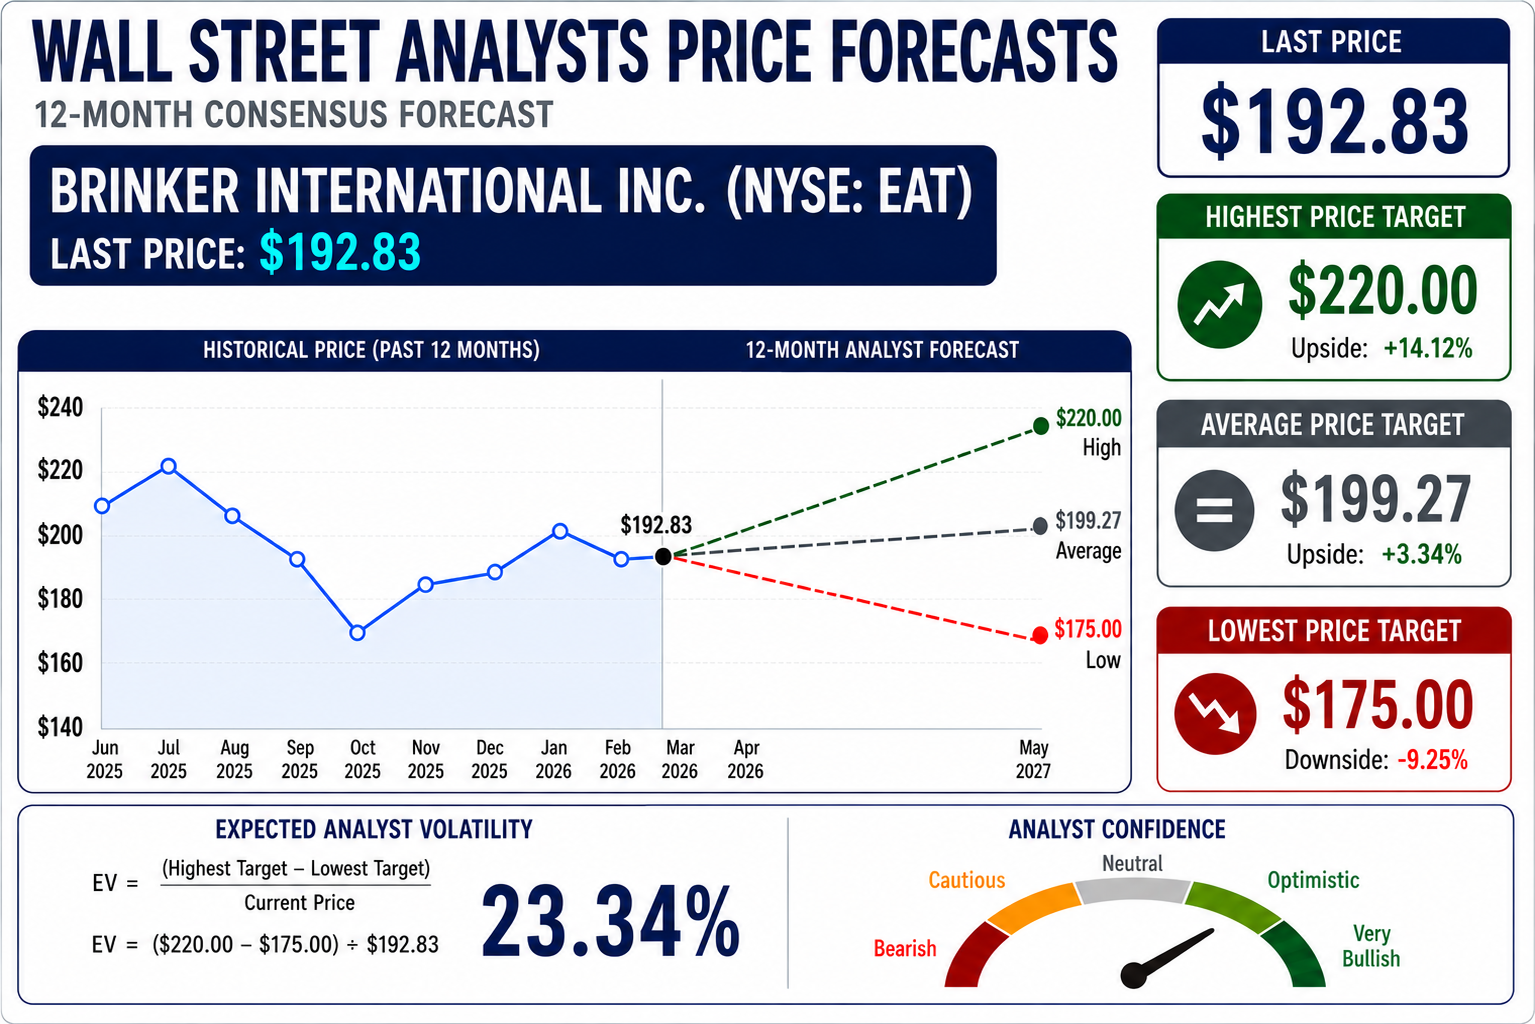
Wall Street’s opinion on Brinker International ($EAT) is unusually interesting because, for once, the analysts have managed to surround the current stock price from both directions without requiring binoculars. With $EAT trading at $192.83, the average Wall Street analyst price target sits at $199.27. That represents potential upside of just 3.34%. In other words, the consensus view is that the stock could go higher, but perhaps not high enough to justify ordering dessert.
The bullish case is considerably more interesting. The highest analyst target is $220, representing potential upside of 14.12% from the current price. If Brinker continues to deliver strong Chili’s traffic, healthy comparable-store sales, and expanding profitability, that target is certainly within striking distance. The market has already rewarded management handsomely for turning Chili’s into one of casual dining’s better comeback stories. The bulls are betting management hasn’t finished.
Then we have the bears.
The lowest analyst target is $175, which would represent a decline of approximately 9.25%. That downside scenario becomes more plausible if restaurant traffic weakens, consumer spending deteriorates, or margins begin surrendering some of their recent gains. Restaurant companies have an unfortunate habit of discovering that beef, chicken, labor, rent, and electricity all cost money at exactly the same time.
What I find most interesting is the relatively narrow disagreement among analysts. The spread between the highest and lowest targets produces an Expected Analyst Volatility reading of 23.34%. Compared with stocks where Wall Street analysts appear to be forecasting entirely different planets, this is relatively contained.
But here is where traders need to separate the stock from the spreadsheet.
The consensus target of $199.27 offers very little theoretical upside from $192.83. Yet stocks do not stop rising because analysts run out of imagination. If Brinker continues beating expectations, analysts will simply do what analysts have done since the invention of the spreadsheet: raise their price targets after the stock goes up.
That makes the $220 high target the number I would watch. A sustained move toward and ultimately through that level would suggest the market is pricing in another leg of earnings growth that today’s consensus estimates may not fully appreciate. Conversely, weakness toward $175 would suggest the market has begun questioning whether the Chili’s turnaround can continue producing the same spectacular results.
The bottom line is that Wall Street is mildly optimistic about $EAT, but not wildly enthusiastic. The average analyst sees only modest upside. The bulls see another 14%. The bears see roughly 9% downside.
For traders, that creates an interesting situation. The analysts aren’t forecasting a home run. They’re forecasting a single.
If Brinker keeps producing home-run numbers, the analysts may eventually have to start running after the stock.
52-Week High and Low Boundaries
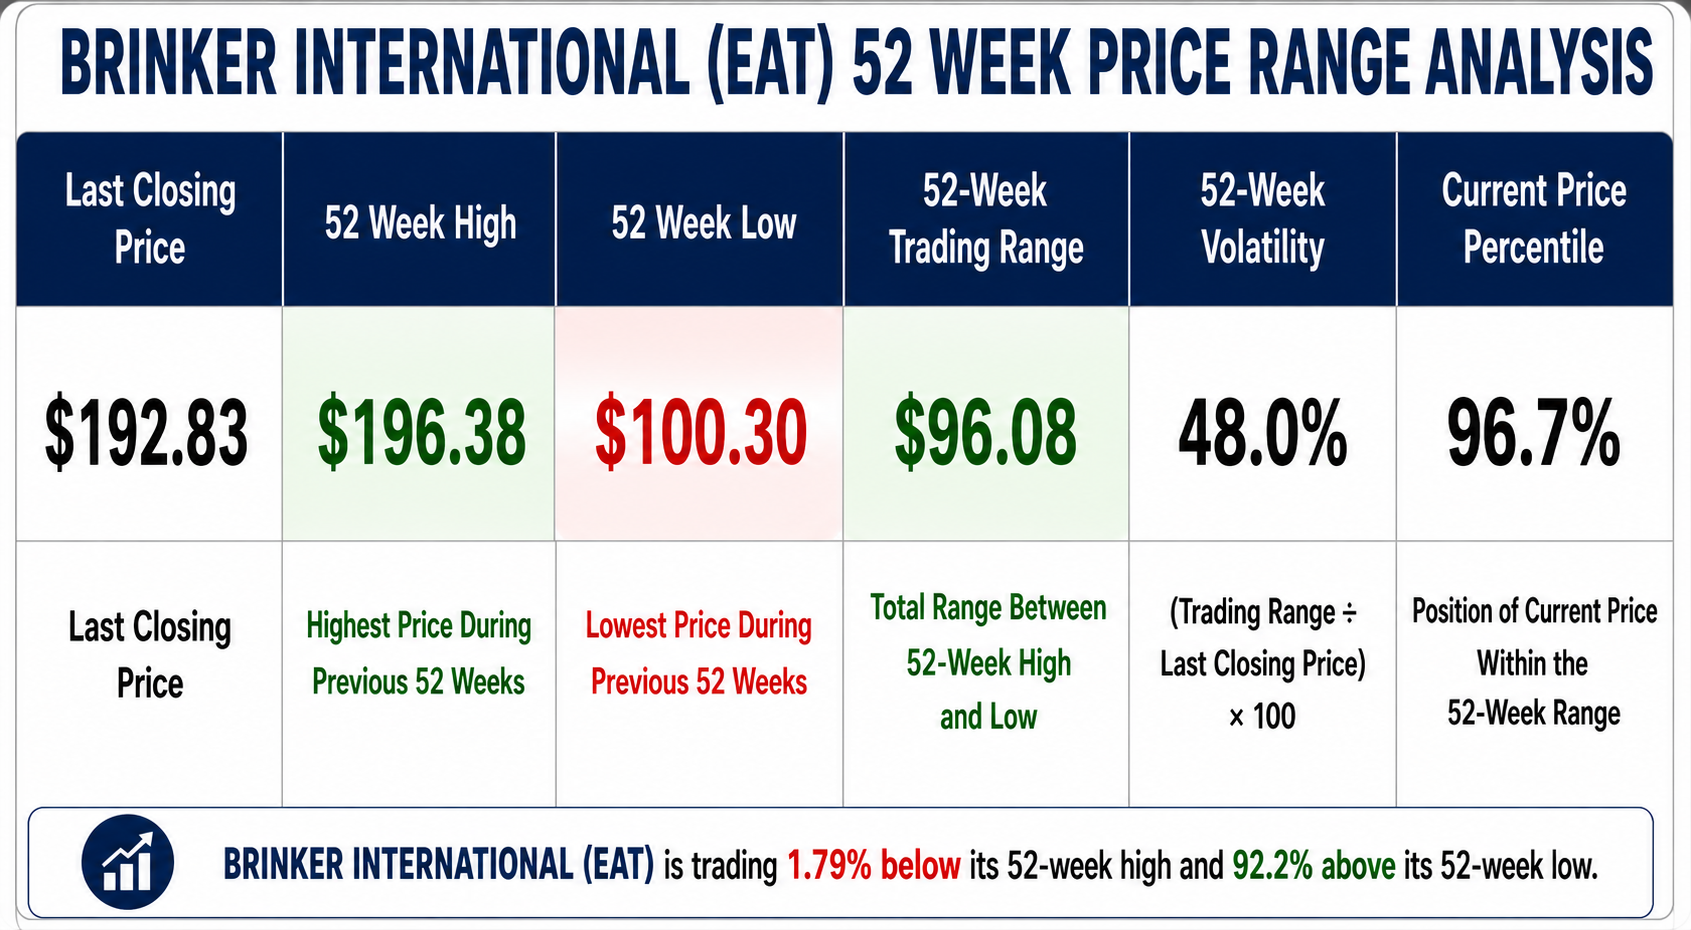
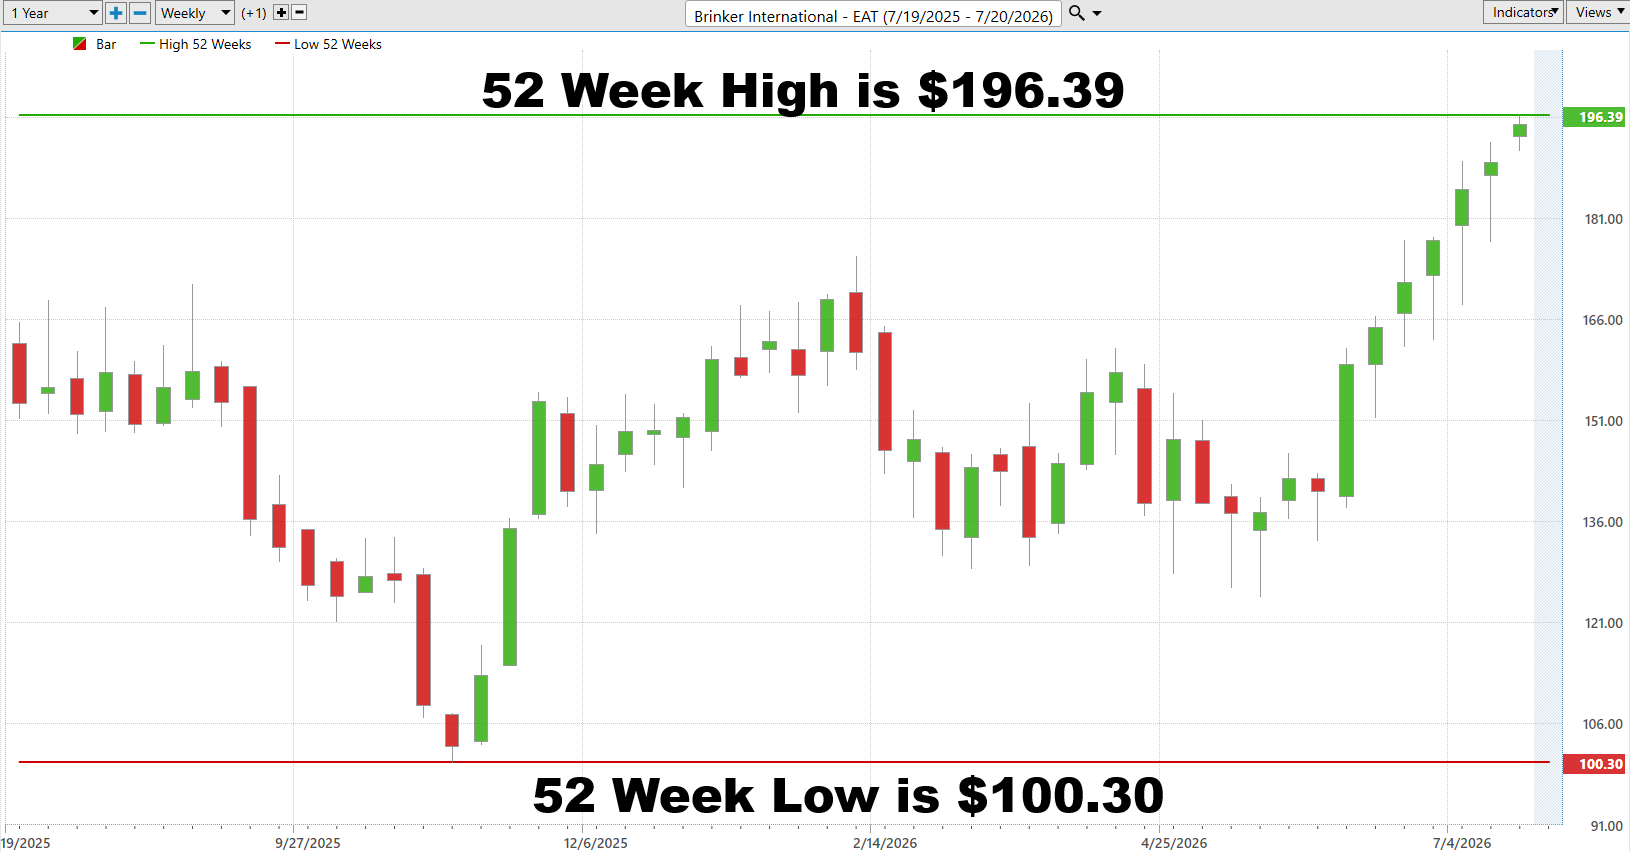
Brinker International ($EAT) has spent the past 52 weeks demonstrating one of the market’s oldest lessons: strong stocks have a peculiar habit of becoming stronger. Over the period, shares traveled from a 52-week low of $100.30 to a high of $196.38, a massive $96.08 trading range. With the stock now at $192.83, $EAT sits just 1.79% below its 52-week high and an extraordinary 92.2% above its 52-week low. This is not a stock quietly wandering around the middle of its range wondering what it wants to be when it grows up. The market has already voted.
The weekly chart tells the story even better. After falling toward $100, $EAT reversed course, recovered, stumbled again, and then began a powerful advance that has carried the stock almost straight back to the ceiling. It currently sits in the 96.7th percentile of its 52-week range. In plain English, almost the entire year’s trading range is now underneath the current price. Traders who spent the year waiting for the stock to become “cheap” have received an excellent education in the difference between cheap stocks and strong stocks.
What makes this particularly interesting is the size of the journey. The stock’s 48% 52-week volatility reading tells us that $EAT has offered plenty of movement along the way. This has not been a government bond wearing a Chili’s uniform. Yet despite that volatility, the dominant direction has ultimately been higher. The stock repeatedly absorbed corrections and emerged with buyers willing to pay higher prices.
Now comes the important part. The $196.38 high is the boundary to watch. A decisive breakout above that level would put $EAT into fresh 52-week-high territory, where something psychologically important happens: virtually everyone who bought during the previous year is sitting on a profitable position. There is less overhead supply from frustrated shareholders waiting desperately to “get back to even.” The market enters price discovery, and strong momentum stocks can sometimes move surprisingly quickly when there is no obvious historical ceiling immediately overhead.
But traders should resist the temptation to turn a strong trend into a religion. At $192.83, the stock is knocking on the door of its highs, which means expectations are high too. The closer $EAT gets to $196.38, the more important the market’s reaction becomes. A clean breakout accompanied by continued buying would confirm strength. Repeated failures at the boundary, particularly followed by lower highs and deteriorating momentum, would be an early warning that buyers may finally be getting tired.
The big picture is difficult to argue with: $EAT is trading like a leader. The stock has climbed more than 90% from its 52-week low and now stands within roughly 2% of its high. Traders don’t need to predict whether Brinker International deserves to be here. The market has already dragged the stock nearly the entire length of its annual range.
The job now is simpler. Watch $196.38. If the bulls take it out and hold it, the next chapter becomes price discovery. If they repeatedly fail, respect the message.
Because on Wall Street, a 52-week high isn’t expensive simply because it’s high. Sometimes it’s the market’s way of telling you where the money is going before the analysts finish explaining why.
Best-Case/ Worst-Case Scenario Analysis
Volatility is one of the most poorly understood concepts in trading. It is not theoretical. It is not some Greek letter buried in an options textbook. It is the very real distance between how much money you *think* you can make and how much pain the market can inflict while you’re trying to make it. And this exercise is one of the fastest ways I know to understand both risk and opportunity.
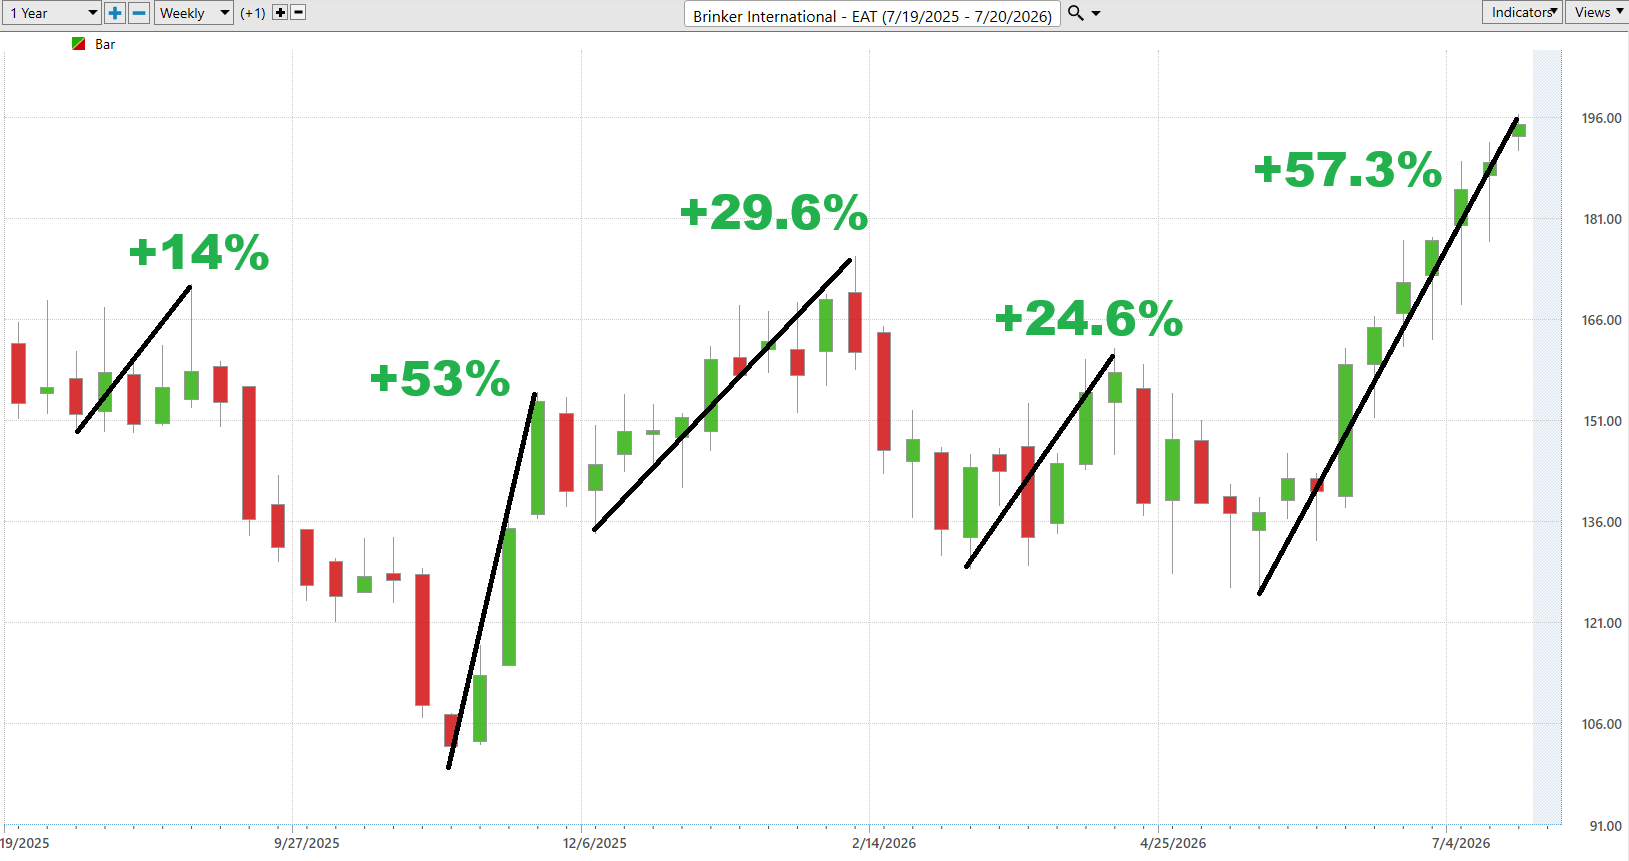
Look at Brinker International ($EAT). Over the past year, its significant rallies have ranged from roughly 14% to 57%. That’s serious upside firepower. The most recent advance has been particularly impressive, carrying the stock back toward its 52-week high. The message is clear: when momentum grabs hold of $EAT, this stock is capable of moving a long way. For a disciplined trader who catches the trend early and stays on the right side of it, those moves represent enormous opportunity.
Now look at the other side of the coin, because the market always sends you the bill eventually. $EAT’s significant declines have ranged from roughly 9% to 41%, with several drawdowns exceeding 20%. Think about what that means before you start dreaming about the next 50% rally. A trader who sizes a position as though a 5% decline is a catastrophe is trading the wrong stock. $EAT has demonstrated that double-digit corrections are part of its personality. The opportunity is substantial, but the price of admission is volatility.
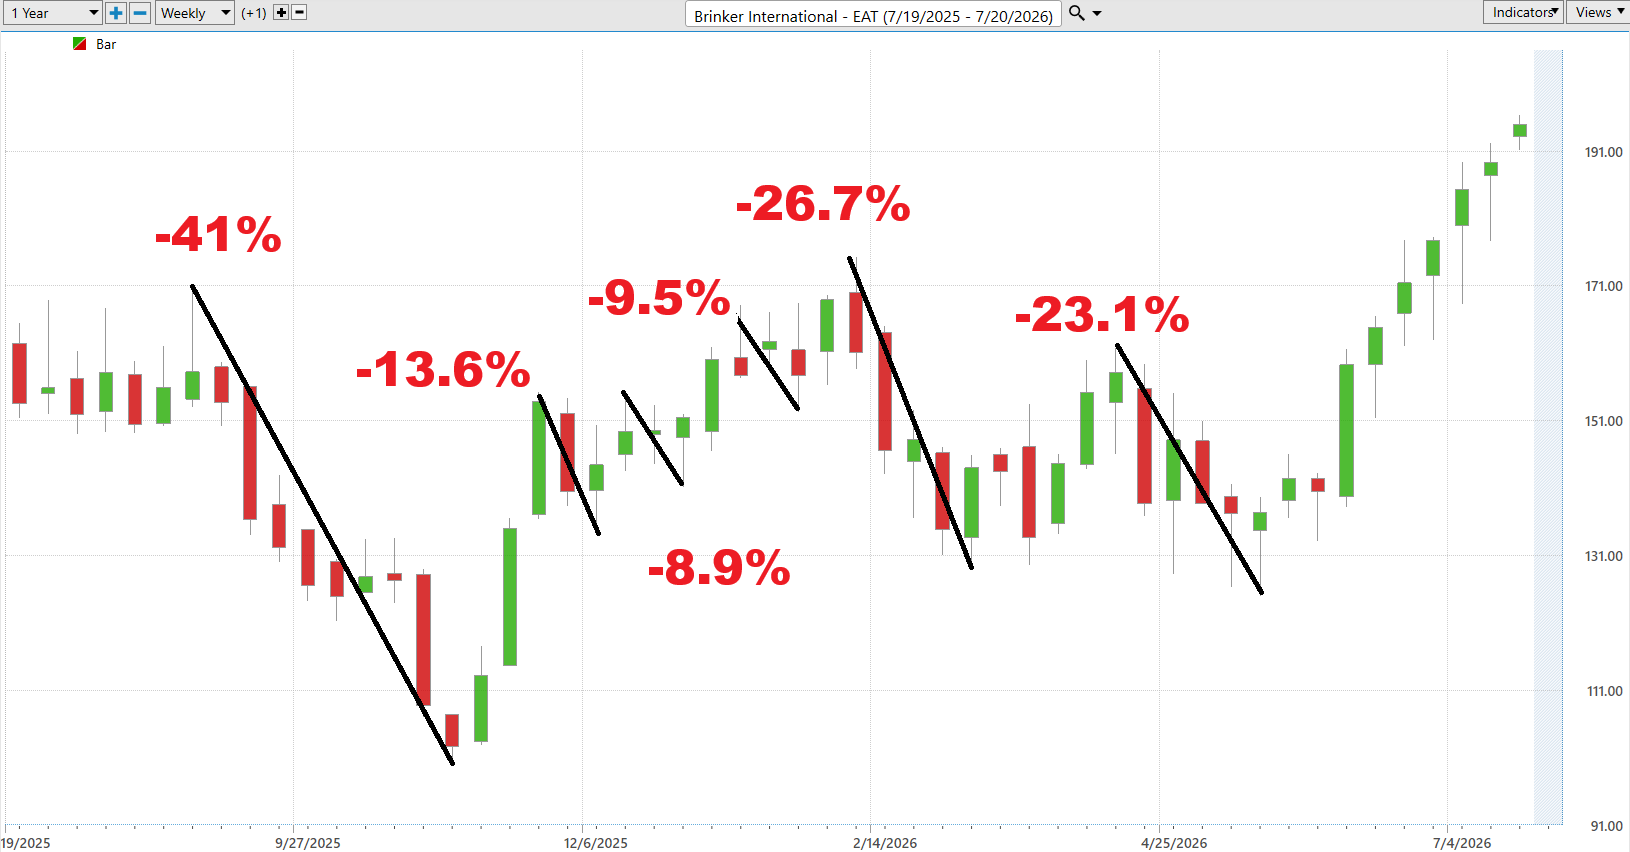
That’s the lesson hiding in these charts. $EAT can make big moves in both directions. The stock currently has powerful momentum and is pressing toward new highs, so the bulls have control. But your position size and risk management should be built around what the stock has actually demonstrated it can do, not what you hope it will do tomorrow.
The objective isn’t to predict whether the next move will be another 50%-plus rally or a 20%-plus correction. It’s to recognize that both outcomes are entirely consistent with $EAT’s historical behavior. Respect the volatility, follow the trend, size your position intelligently, and make the market prove you wrong before you abandon a winning trade.
Next we compare $EAT to the broader stock market averages.

Brinker International ($EAT) is sending a message that is difficult to ignore: the stock’s relative strength is accelerating where it matters most. Over the past year, $EAT has gained 18.53%, roughly matching the S&P 500’s 19.09% return. On that longer horizon, Brinker doesn’t immediately look exceptional. But the closer you get to the present, the more interesting the story becomes.
Over the past six months, $EAT has advanced 19.84%, more than doubling the S&P 500’s 9.21% gain and comfortably outperforming the Nasdaq, Dow, and Russell 2000. Year to date, that gap becomes even more pronounced. Brinker is up 27.26%, compared with 9.49% for the S&P 500. The stock isn’t simply participating in the market’s advance. It has increasingly separated itself from the major indexes.
The short-term numbers are perhaps the most revealing. Over the past month, $EAT has surged 17.25% while the S&P 500 gained just 0.49%. Over the latest week, Brinker added another 5.52% while the S&P 500, Nasdaq, and Dow all declined. That is precisely the kind of relative strength traders look for: a stock attracting capital even when the broader market is struggling to make progress.
The bigger picture, then, is not that Brinker has been the strongest investment across every time frame. It hasn’t. The Russell 2000 and Nasdaq have both outperformed it over the full year. What matters is the change in leadership. As the time frames become more recent, $EAT’s relative performance improves dramatically. That suggests investors are increasingly rewarding the company’s improving fundamentals, earnings power, and the continuing strength of the Chili’s turnaround.
For traders, this is where the comparison becomes valuable. Markets are enormous voting machines, and capital constantly migrates toward businesses producing better results and stronger expectations. Right now, the evidence suggests Brinker International is winning more of those votes.
VantagePoint AI Predictive Blue Line
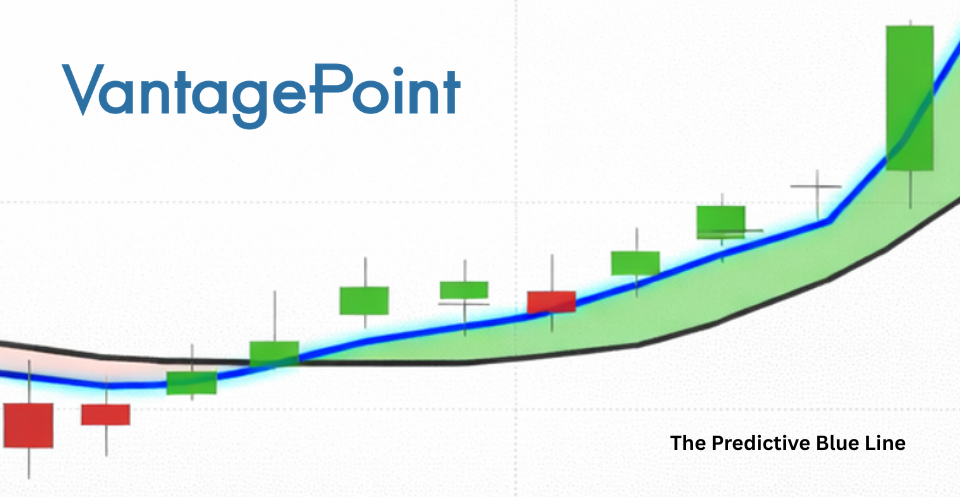
The Predictive Blue Line is one of the most important tools in the VantagePoint AI arsenal because it helps traders answer the question that matters most: What is the trend, and where is it expected to go next?
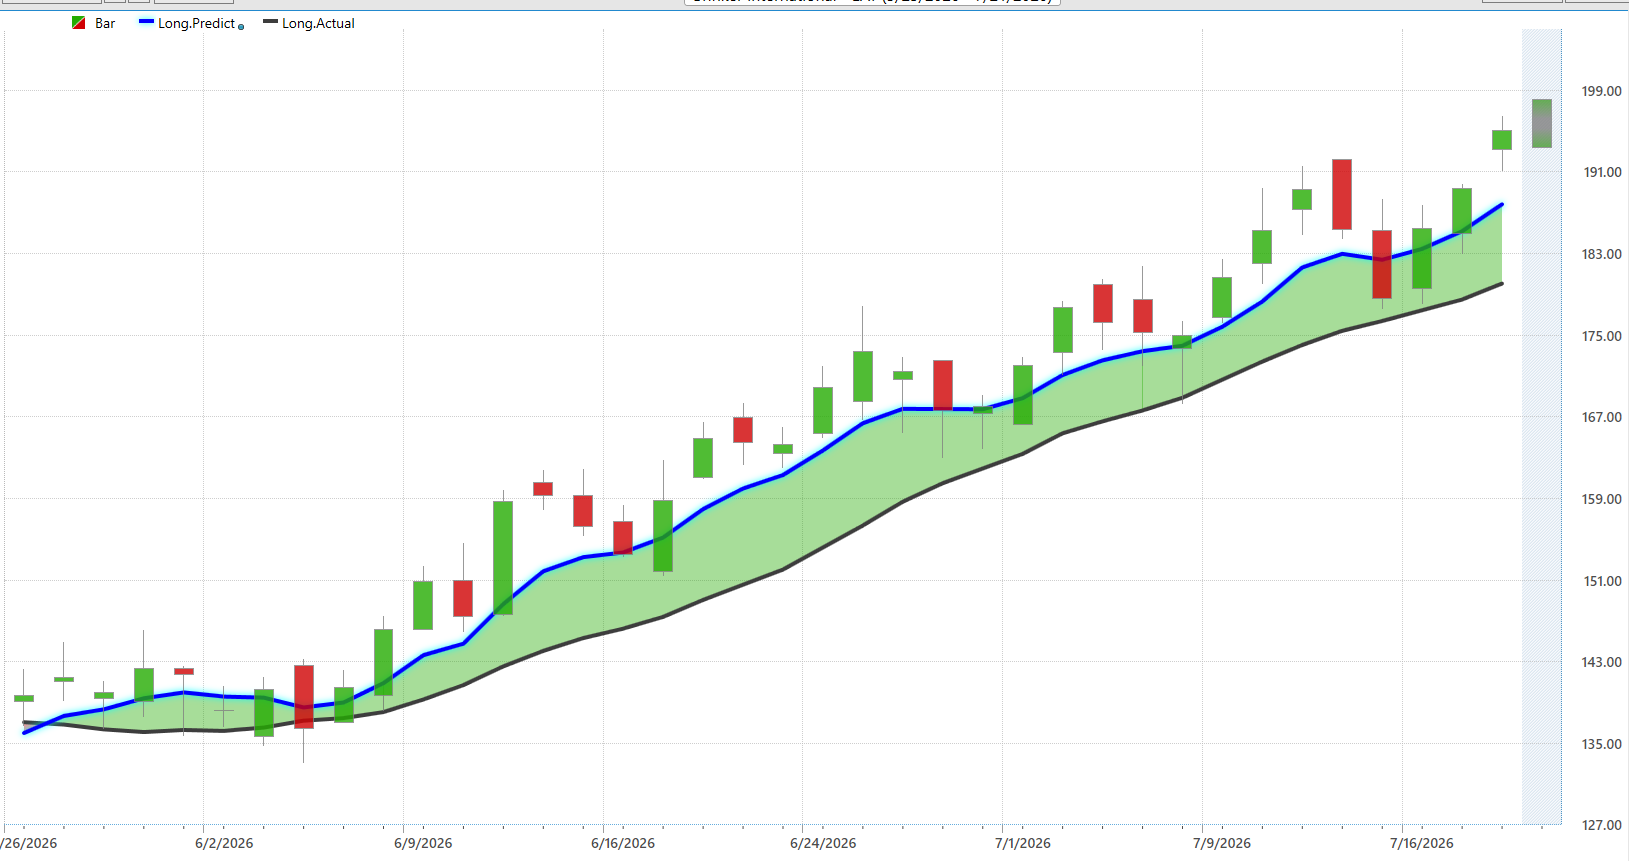
For Brinker International ($EAT), the message is decidedly bullish. The Predictive Blue Line has remained above the black actual moving average, while both lines have maintained a strong upward slope. The widening green zone between them reinforces the strength of the trend. In simple terms, VantagePoint’s predictive indicators have consistently anticipated higher prices, and the market has largely followed.
The chart also demonstrates why the slope of the Predictive Blue Line matters. During brief pullbacks, the line continued pointing higher rather than rolling over into a bearish configuration. Those corrections occurred within an established uptrend and were followed by renewed buying. This is exactly what traders want to see when looking for opportunities to buy weakness within a strong trend rather than chasing every new high.
Most recently, $EAT has accelerated toward the $190 to $200 area, while the Predictive Blue Line has turned higher again and remains comfortably above the black line. That tells us the underlying bullish trend remains intact. As long as the blue line stays above the black line and both continue advancing, the path of least resistance favors higher prices.
The key signal to watch is straightforward. If the Predictive Blue Line begins to flatten, rolls over, and crosses below the black line, the bullish thesis deserves immediate reconsideration. Until that happens, the chart says buyers remain in control.
For traders, the lesson is simple: don’t argue with a strong trend just because the stock has already gone up. Let the predictive indicators tell you when conditions are changing. Right now, for $EAT, they aren’t.
VantagePoint AI Neural Index
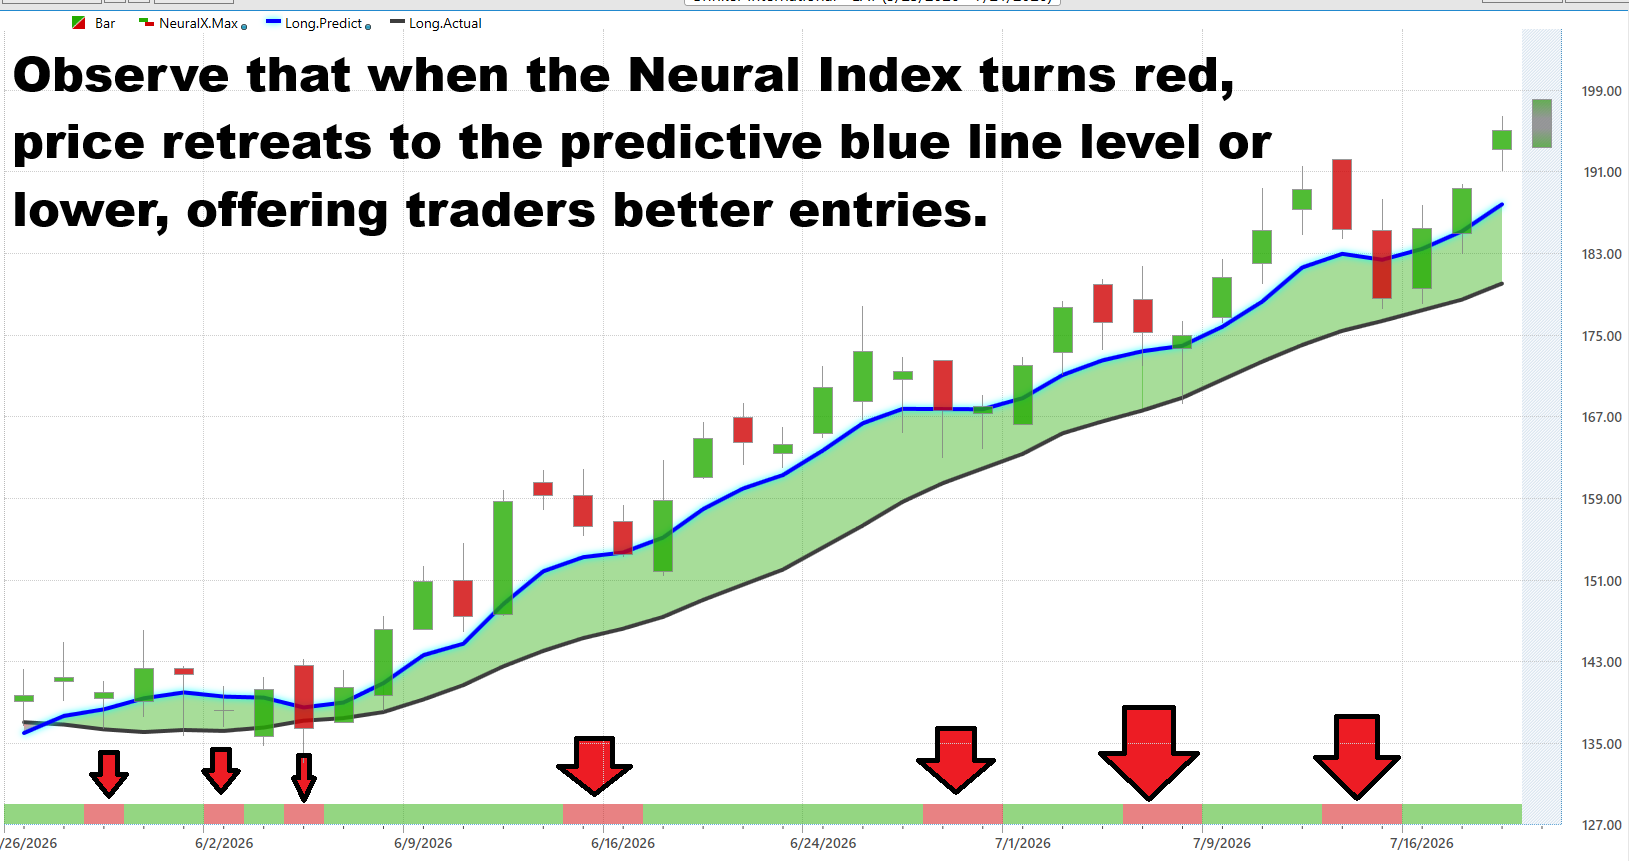
The Neural Index is designed to forecast short-term market strength or weakness over the next 48 to 72 hours. When it is green, it signals anticipated short-term strength. When it turns red, it warns traders that near-term weakness may be developing. The key is understanding that the Neural Index is a short-term timing tool, not a replacement for the primary trend.
That distinction is particularly important with Brinker International ($EAT). Throughout the chart, the Predictive Blue Line remains above the black actual moving average, confirming that the dominant trend is bullish. But within that uptrend, the Neural Index periodically turns red. Notice what happens next: price tends to retreat toward the Predictive Blue Line, and occasionally below it, before the larger uptrend resumes.
For traders, this creates a powerful combination. The Predictive Blue Line tells you the direction of the primary trend, while the Neural Index helps identify short-term changes in momentum. When the trend is bullish but the Neural Index turns red, traders should not automatically assume the entire trend has reversed. Instead, that temporary weakness can create an opportunity to watch for a better entry near the Predictive Blue Line.
The chart shows this pattern repeatedly. Short-term weakness develops, price pulls back toward the value zone, and then the Neural Index turns green again as buyers regain control. This is where patience becomes valuable. Rather than chasing $EAT after a sharp rally, traders can use these temporary Neural Index reversals to anticipate potential pullbacks and prepare for the next opportunity.
Right now, the larger message remains bullish. $EAT is in a strong uptrend, and the Predictive Blue Line continues to rise above the actual moving average. The Neural Index provides the tactical layer. Watch for red signals to warn of short-term weakness and potential retreats toward the Predictive Blue Line. Then watch for the Neural Index to turn green again while the larger trend remains intact.
That’s the advantage of combining the two indicators: the Predictive Blue Line helps answer which direction to trade, while the Neural Index helps answer when to pay attention.
VantagePoint AI Daily Range Forecast
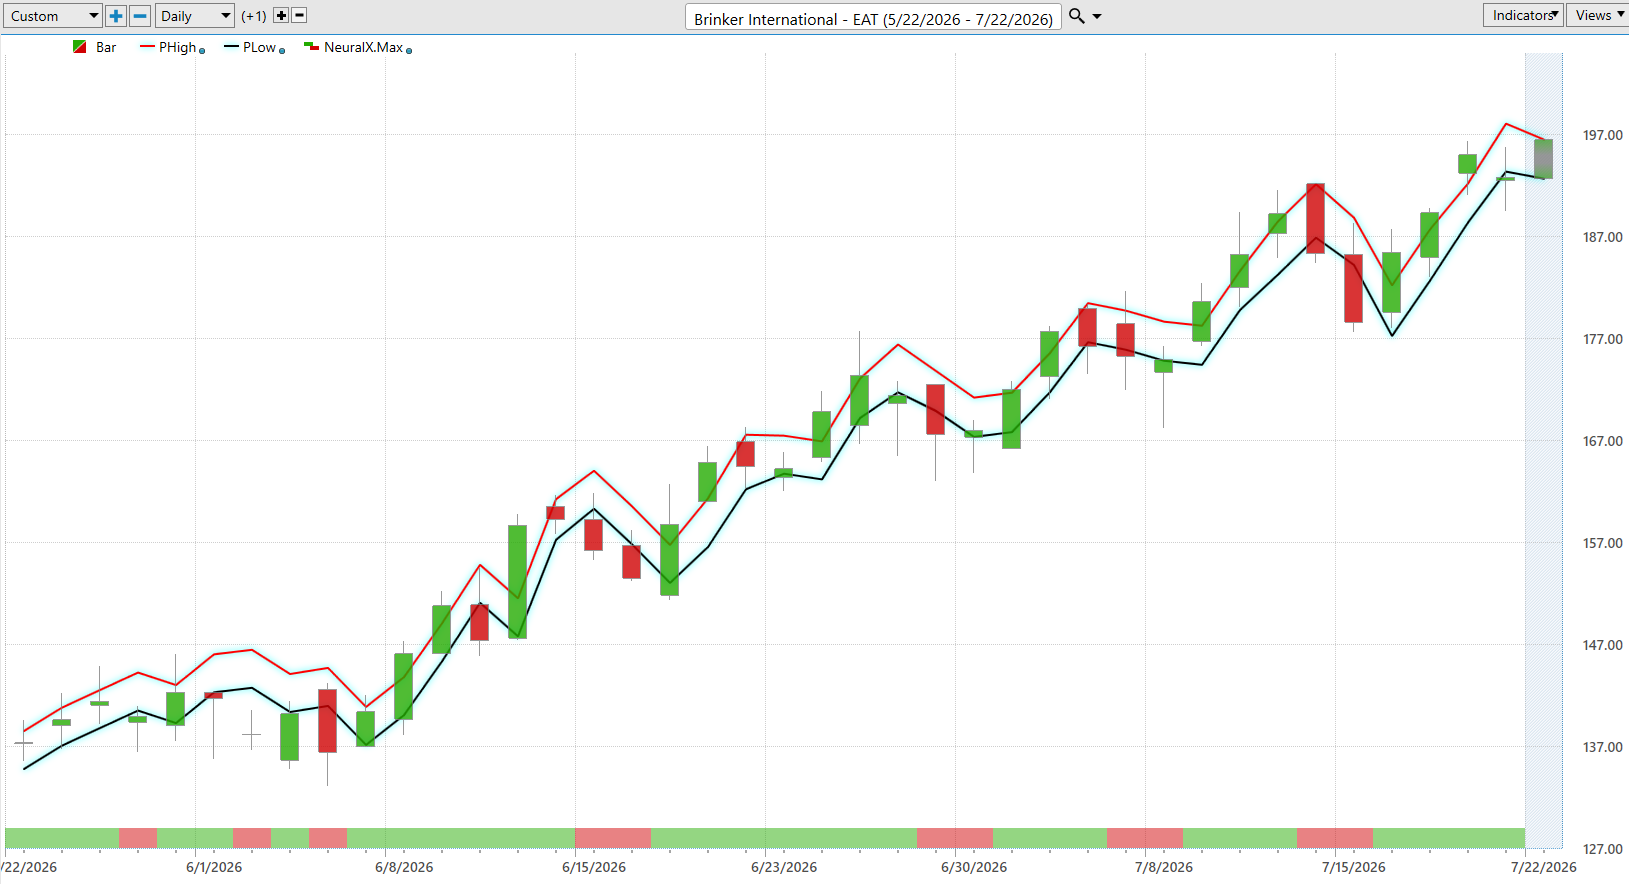
The Daily Range Forecast is where artificial intelligence moves from being an interesting idea to becoming a practical trading tool. For Brinker International ($EAT), the broader message is unmistakable: the stock has been in a powerful uptrend, climbing from roughly $137 in late May to the $190s today. But the more useful insight for a trader isn’t simply knowing that the trend is up. It’s understanding where price is likely to travel within that trend.
VantagePoint’s predicted high and predicted low create a forward-looking roadmap for each trading session. Look closely at the chart and you’ll see price repeatedly interacting with those forecast boundaries. The predicted low can help identify areas where traders should anticipate support and potentially look for better entries. The predicted high provides a reference point for where price may encounter resistance or where traders might consider taking profits. These aren’t guarantees. They are probability-based levels designed to help traders make better decisions before the market makes the decision for them.
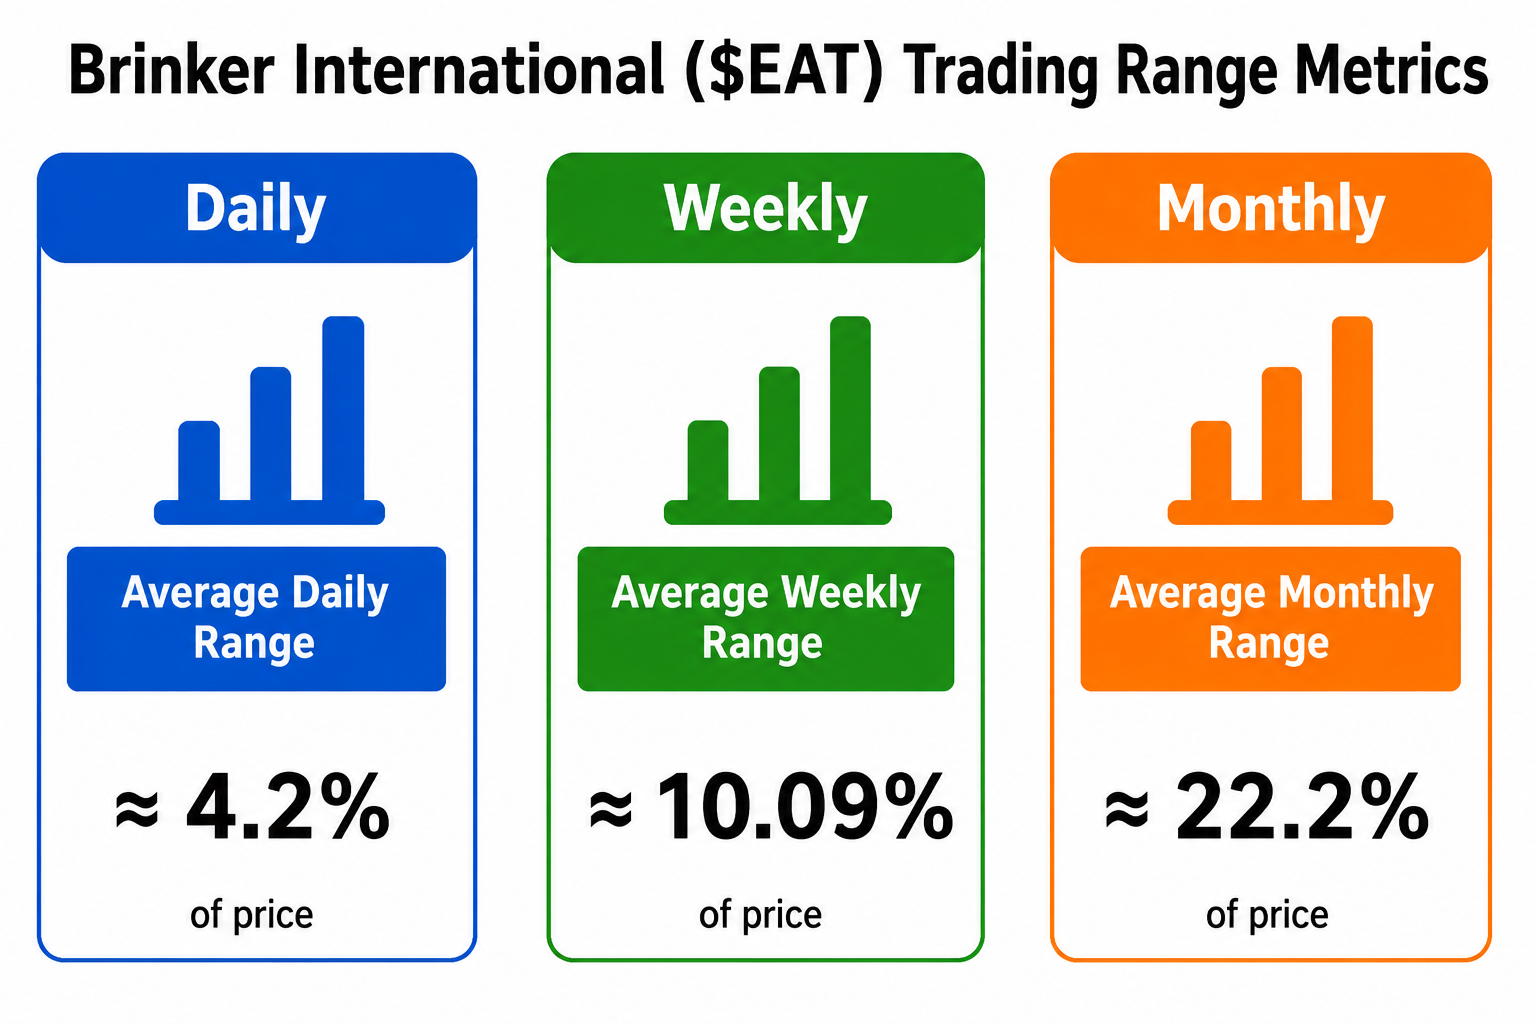
The historical volatility data puts those forecasts into perspective. $EAT’s average daily trading range is approximately 4.2% of price. Stretch the time horizon and the numbers become even more revealing: the average weekly range expands to roughly 10.09%, while the average monthly range reaches approximately 22.2%. This is not a sleepy stock. There is enough movement here to create substantial opportunity, but also enough volatility to punish traders who enter without understanding how far the stock routinely travels.
That’s why the Daily Range Forecast becomes particularly valuable. When a stock routinely moves more than 4% from high to low during an average session, chasing price near the predicted high can produce a very different risk-reward proposition than patiently looking for opportunities closer to the predicted low. In an established bullish trend like the one currently visible in $EAT, traders can use the forecast to think in terms of buying anticipated weakness rather than chasing strength.
The chart also highlights an important distinction between direction and timing. The larger trend has been decisively higher, but $EAT has not traveled upward in a straight line. There have been numerous pullbacks and short-term reversals along the way. The Daily Range Forecast helps traders navigate those fluctuations without losing sight of the dominant trend. When the broader trend remains bullish, the predicted low can become an important area to watch for opportunity, while the predicted high can help establish realistic short-term expectations.
The takeaway is straightforward. $EAT has momentum, but it also has meaningful volatility. A 4.2% average daily range, 10.09% weekly range, and 22.2% monthly range tell traders exactly what kind of animal they’re dealing with. VantagePoint’s Daily Range Forecast attempts to put boundaries around that movement before the trading session unfolds.
For active traders, that’s the real advantage. The objective isn’t merely to predict whether $EAT will go up or down. It’s to combine the prevailing trend with anticipated price levels and ask a much better question: Where does the risk-reward become most attractive? In a stock moving this quickly, knowing where to trade can be every bit as important as knowing which direction to trade.
VantagePoint AI Intermarket Analysis
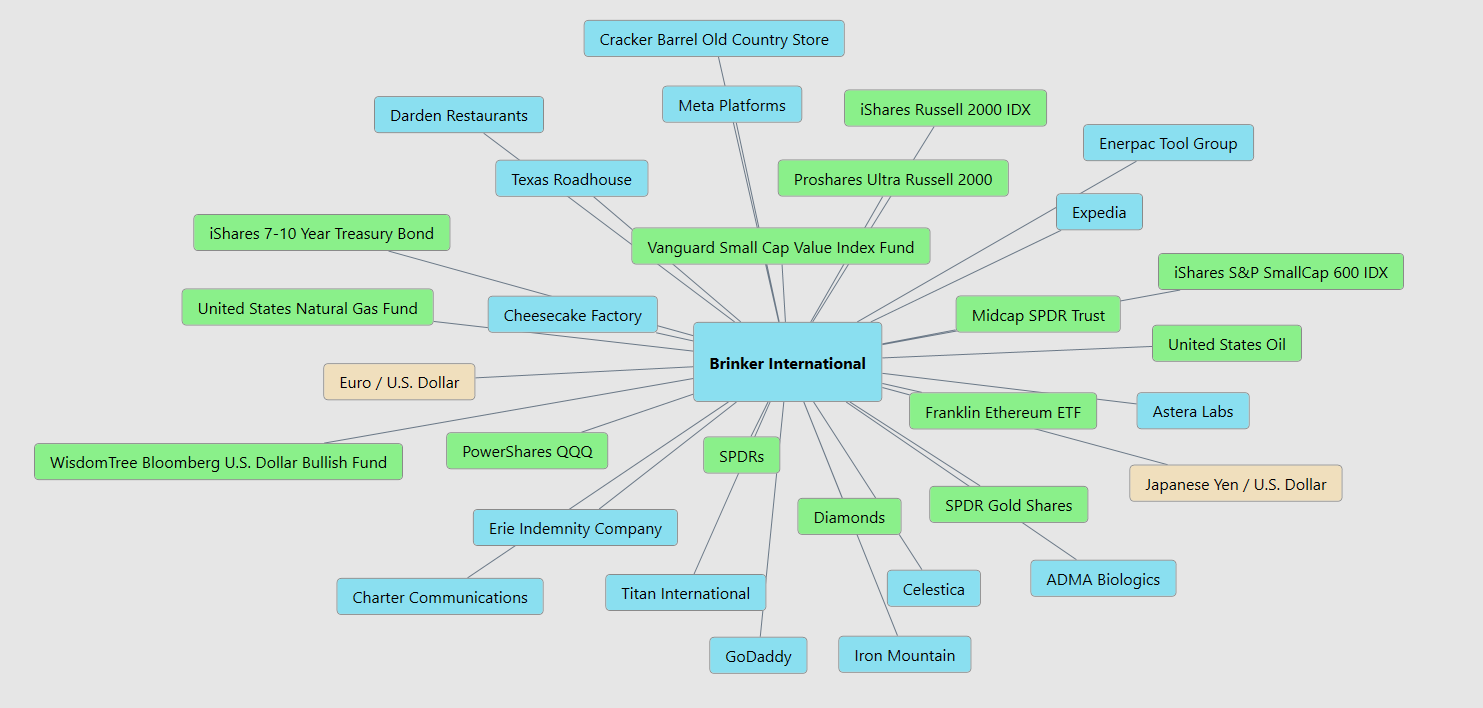
Intermarket analysis starts with a simple idea that Wall Street has a habit of making sound complicated: Brinker International ($EAT) does not trade in a vacuum. The network surrounding the stock connects it to restaurant competitors such as Darden Restaurants and Texas Roadhouse, but also to small-cap and mid-cap indexes, the broader equity market, Treasury bonds, oil, natural gas, gold, currencies, and technology stocks. Think of these markets as an economic conversation. When several begin saying the same thing at once, they can tell us whether the environment surrounding $EAT is becoming more favorable or more dangerous.
For Brinker, the most important conversation ultimately comes back to the American consumer. Chili’s needs people to walk through the door, order dinner, and preferably add another round of margaritas. Strong employment, rising disposable income, healthy consumer confidence, and a rising stock market can support restaurant traffic. Higher interest rates and persistent inflation can work in the opposite direction by squeezing household budgets. This is why the relationships with Treasury bonds, the Russell 2000, the S&P 500, the Dow, and other economically sensitive markets matter. They collectively provide clues about financial conditions and investors’ expectations for economic growth.
Energy and currencies add another layer. Higher oil and natural gas prices can increase transportation, distribution, utility, and other operating costs while simultaneously taking money out of consumers’ pockets at the gas pump. That creates the unpleasant possibility of Brinker paying more to operate its restaurants while its customers have less discretionary income to spend inside them. The U.S. dollar and Japanese yen relationships are less direct, given Brinker’s predominantly domestic business, but they can still reflect changing global liquidity and risk appetite. Gold and Treasury bonds can also become useful signals when investors suddenly become defensive. No single relationship determines $EAT’s direction. The value comes from watching whether these markets begin moving together and signaling a broader change in the economic environment.
The larger point is that $EAT’s powerful performance cannot be understood simply by staring harder at a Chili’s menu or even at Brinker’s earnings statement. Strong restaurant sales and improving execution may be the engine, but the intermarket environment can determine whether that engine is driving uphill or downhill. Right now, traders should watch the combination of consumer spending, interest rates, energy costs, and broader equity-market risk appetite. If consumers remain resilient, rates become less restrictive, energy costs stay manageable, and equities remain healthy, the backdrop can continue supporting $EAT. But if those relationships begin deteriorating together, that would be an early warning worth respecting. The advantage of intermarket analysis is precisely this: you are not waiting for Brinker to tell you something has changed. You are watching the markets around Brinker for clues that the change may already be underway.
Here are the 31 key driver of price for $EAT.
Our Suggestion
Brinker International ($EAT) has earned the right to be taken seriously. After reviewing management’s two most recent earnings calls, fiscal Q2 on January 28 and Q3 on April 29, the most important conclusion is that this does not look like management getting lucky for a quarter and immediately ordering commemorative plaques. The Chili’s turnaround continues to produce measurable results. In Q2, Chili’s comparable sales rose 8.6%, marking its 19th consecutive quarter of same-store sales growth. In Q3, Chili’s delivered its 20th consecutive quarter of growth, with comps up 4% despite lapping an extraordinary 31% increase from the prior year. February and March comps accelerated to 5.9% with positive traffic after January was disrupted by severe weather. That is important because it suggests the consumer hasn’t suddenly lost interest in Chili’s; January had a weather problem, not necessarily a customer problem.
Management, led by CEO Kevin Hochman, appears to be doing what good management teams are supposed to do: establish a strategy, execute it, measure the results, and resist the temptation to declare victory before dessert arrives. The formula remains remarkably straightforward: improve food, service and atmosphere, maintain a compelling value proposition, use advertising to attract new guests, and then operate the restaurants well enough that those guests return. Q2 revenue reached roughly $1.45 billion, up 7% year over year, while Q3 revenue increased another 3.2% to approximately $1.47 billion. Adjusted Q3 EPS reached $2.90, up from $2.66 a year earlier and slightly ahead of consensus. Management also updated fiscal 2026 guidance after Q3. In my view, the last two calls show a management team that understands precisely what is driving the business and, more importantly, continues to produce numbers that support its confidence.
The caution is that Wall Street has noticed. The turnaround is no longer a secret whispered between two guys at the end of the bar. At roughly $193, $EAT is trading near its 52-week high after an enormous advance, meaning expectations have risen almost as quickly as the stock. The next earnings report is currently expected on August 12, 2026, although Brinker has not yet confirmed that date on its investor-relations calendar. Current consensus estimates call for approximately $3.08 per share, representing roughly 24% year-over-year growth, with another source estimating quarterly revenue around $1.53 billion. The hurdle is therefore getting higher. Management doesn’t merely need to run a good restaurant company anymore. It needs to run one that continues exceeding increasingly optimistic expectations.
Our suggestion is to remain bullish but disciplined. The fundamentals, management execution, relative strength, Predictive Blue Line and broader price trend are currently telling a consistent story. For traders already long, we would continue giving the trend the benefit of the doubt while monitoring the Predictive Blue Line and Neural Index for deterioration. For traders looking to enter, we would avoid chasing strength near the highs and instead use VantagePoint’s Daily Range Forecast to identify opportunities created by normal volatility. With an average daily range of roughly 4.2%, weekly range of 10.09%, and monthly range of 22.2%, $EAT regularly provides second chances to traders patient enough to wait for them.
The biggest thing we’re watching now is traffic. Price increases can manufacture sales growth for a while; customers walking through the door are harder to manufacture. The positive traffic reported for February and March is therefore one of the most encouraging details from the latest call. If Chili’s can continue generating positive traffic while maintaining its value proposition and protecting margins, analysts may again find themselves raising expectations after the stock has already moved. If traffic weakens, margins contract, or management begins lowering expectations, that would change our assessment quickly.
Our conclusion: $EAT remains a compelling momentum stock backed by a management team that, based on the last two earnings calls, is delivering against its strategy. But at these prices, management is no longer being graded on improvement. It’s being graded on continued excellence. Study the trend while the evidence supports it, use AI-driven forecasts to improve entries and manage risk, and pay very close attention to the next earnings call. The stock has already told us what happens when management delivers. The next question is what happens when Wall Street starts demanding that it deliver every single time.
Position sizing is very important here. Practice great money management on all of your trades.
It’s not magic.
It’s machine learning.
Disclaimer: THERE IS A HIGH DEGREE OF RISK INVOLVED IN TRADING. IT IS NOT PRUDENT OR ADVISABLE TO MAKE TRADING DECISIONS THAT ARE BEYOND YOUR FINANCIAL MEANS OR INVOLVE TRADING CAPITAL THAT YOU ARE NOT WILLING AND CAPABLE OF LOSING.
VANTAGEPOINT’S MARKETING CAMPAIGNS, OF ANY KIND, DO NOT CONSTITUTE TRADING ADVICE OR AN ENDORSEMENT OR RECOMMENDATION BY VANTAGEPOINT AI OR ANY ASSOCIATED AFFILIATES OF ANY TRADING METHODS, PROGRAMS, SYSTEMS OR ROUTINES. VANTAGEPOINT’S PERSONNEL ARE NOT LICENSED BROKERS OR ADVISORS AND DO NOT OFFER TRADING ADVICE.