


This week’s ai stock spotlight is Microsoft ($MSFT)
Microsoft ($MSFT) was founded in 1975 by Bill Gates and Paul Allen, two childhood friends from Seattle with an ambitious vision: to place a computer on every desk and in every home. What began with a contract to provide a BASIC interpreter for the Altair 8800 evolved into a revolution in personal computing. Their operating system, MS-DOS, set the stage for what would become one of the most influential tech empires in history. Today, Microsoft is a global technology conglomerate headquartered in Redmond, Washington. It spans multiple industries including software, hardware, gaming, cloud computing, and artificial intelligence. With a market capitalization hovering around $3 trillion, it remains one of the most valuable companies in the world and a key member of the “Magnificent 7” stocks driving market indices.
Microsoft’s business model is defined by high-margin, recurring revenue streams across enterprise software and cloud services. The company divides operations into three core segments: Productivity and Business Processes (Office 365, LinkedIn, Dynamics), Intelligent Cloud (Azure, Windows Server, GitHub), and More Personal Computing (Windows, Surface, Xbox). Its strength lies in vertical integration and platform ubiquity. Revenue flows from subscription-based software (Office 365), cloud computing infrastructure (Azure), advertising (LinkedIn, Bing), and consumer hardware (Surface, Xbox). Azure, Microsoft’s cloud platform, has emerged as a primary growth driver, contributing an estimated 27-30% of total revenue, while Office 365 dominates the enterprise productivity market with millions of paying users globally.
As of 2024, Microsoft’s top revenue drivers are Azure, Office 365 Commercial, LinkedIn, and Windows Commercial products & cloud services. Azure alone has been growing at a 20%+ clip year-over-year, while Office 365 subscriptions continue to expand with upsell opportunities via A.I. integrations like Copilot. LinkedIn, often overlooked, surpassed $15 billion in annual revenue, driven by strong B2B advertising and talent solutions.
Microsoft’s latest quarterly earnings report was nothing short of a financial flex. Revenue climbed to $70 billion, up 13% year-over-year, while operating income surged 16% to $32 billion, delivering an enviable 46% operating margin — a figure that places Microsoft near the top tier of profitability among mega-cap companies. This wasn’t a fluke or a one-off windfall. It reflected a tech giant firing on all cylinders, backed by aggressive but disciplined investment in A.I. infrastructure and cloud capacity.
What’s drawing Wall Street’s attention, however, isn’t just the present, it’s the forward guidance embedded in the fine print. Microsoft reported $315 billion in commercial remaining performance obligations (RPO), a key figure that essentially represents booked business that hasn’t yet hit the income statement. That number is up a staggering $80 billion from last year and strongly rebuts concerns that last quarter’s 75% growth in commercial bookings was merely a pull-forward from future demand. The company also showed remarkable resilience in its cash flow. Despite ramping up capital expenditures — particularly in A.I.-optimized data centers — free cash flow still hit $20 billion, even as the company navigated higher tax payments. That slight year-over-year dip in free cash flow (down 3%) is being viewed less as a red flag and more as a sign of bold, forward-looking investment.
From a valuation perspective, the stock now trades around $431 per share, just above the analyst’s discounted cash flow estimate of $414, and at a forward PE of 28. The takeaway? This isn’t a bargain-bin price, but it’s also not an irrational exuberance. For a company with Microsoft’s track record, balance sheet, and strategic clarity, this is what “fair value” looks like when you’re looking for quality.
In short, Microsoft remains one of the rare stories in tech: a company that can scale, innovate, and generate monster margins — without breaking a sweat. And for long-term investors, it still looks like a solid stock.
Microsoft’s greatest risk isn’t competition — it’s regulation. The company’s aggressive expansion into A.I. through OpenAI, coupled with its dominance in cloud and enterprise software, has triggered scrutiny from U.S. and European regulators. If regulators decide Microsoft’s integrations limit competition or violate fair market principles, core revenue engines like Azure or Windows could be forced to decouple.
The greatest opportunity for Microsoft lies in A.I. monetization. Its strategic investment in OpenAI has given it a head start integrating generative A.I. into everyday workflows — from GitHub Copilot for developers to Copilot in Office for knowledge workers. This could become a multi-billion-dollar revenue stream over the next decade, especially as enterprise demand for AI productivity tools accelerates.
As of early 2025, Microsoft employs over 220,000 people globally, with a heavy concentration in engineering and cloud infrastructure roles. The company’s workforce reflects its broad ambitions — from quantum computing to sustainability initiatives — while maintaining a relatively lean operational model compared to peers like Amazon or Alphabet.
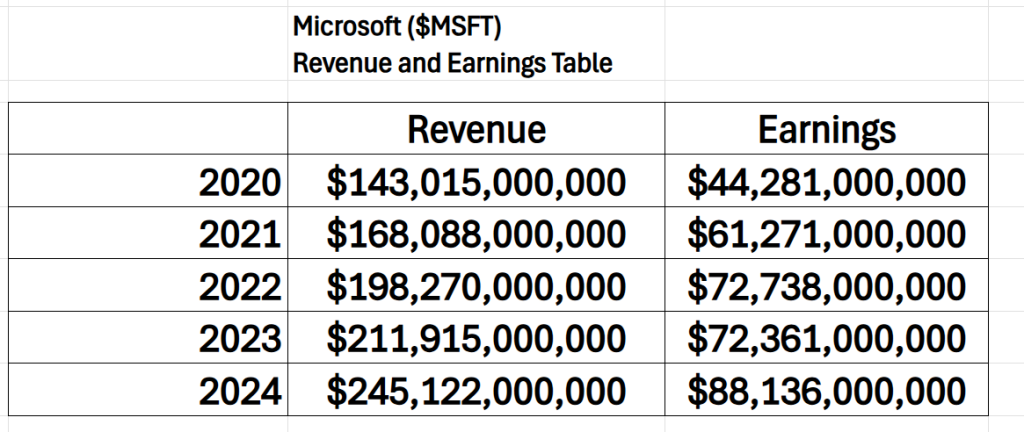
Over the past five years, Microsoft has delivered consistent double-digit revenue and earnings growth. Revenue climbed from $125.8 billion in 2019 to over $245 billion in 2024, while net income surged from $39 billion to more than $88 billion. EPS has compounded at a rate above 20% annually, and free cash flow has remained robust, funding share buybacks, dividends, and acquisitions.
Microsoft has evolved from a software monopoly into a diversified platform powerhouse — one that sits at the intersection of enterprise productivity, cloud computing, and artificial intelligence. It is both an incumbent and an innovator. But the next chapter, defined by A.I., will require threading a delicate needle: scaling responsibly, maintaining public trust, and staying ahead of a regulatory dragnet that is increasingly targeting Big Tech. Investors would be wise to keep one eye on the growth story — and the other on Capitol Hill.
In this stock study, we will look at an analysis of the following indicators and metrics which are our guidelines, and which dictate our behavior in deciding whether to buy, sell or stand aside on a particular stock.
- Wall Street Analysts Ratings and Forecasts
- 52 Week High and Low Boundaries
- Best-Case/Worst-Case Analysis
- Vantagepoint A.I. Triple Cross Indicator
- Neural Network Forecast (Machine Learning)
- VantagePoint A.I. Daily Range Forecast
- Intermarket Analysis
- Our Suggestion
While we make all our decisions based upon the artificial intelligence forecasts, we do look at the fundamentals briefly, just to understand the financial landscape that $MSFT is operating in.
Wall Street Analysts Forecasts
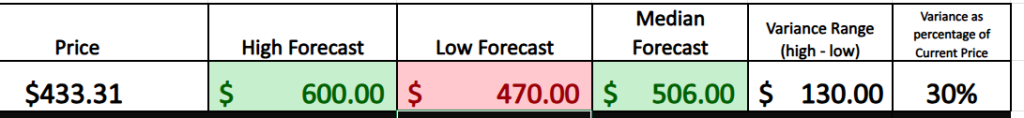
Wall Street’s quietly confident on Microsoft (MSFT) — and that confidence is starting to crystallize. The average analyst price target sits at $506, hovering just above the current level of $433.31. But that consensus masks a deeper conviction. A growing number of top-tier firms have already slapped a “Strong Buy” on the stock, with upside calls stretching as high as $600. On the downside? The floor’s at $470 — a price level which is still $37 above its current price.
Here’s what matters: this isn’t a speculative flyer. It’s a capital-efficient juggernaut with predictable earnings, dominant market share, and strategic exposure to A.I.. It prints cash. And while the Street isn’t screaming it from the rooftops just yet, the price targets are doing the talking.
For traders, the real insight lies in the spread between high and low targets — a variance of roughly $130, or about 30% of the current price. That’s relatively tame compared to the broader market, suggesting expectations are firm, conviction is high, and volatility is expected to stay controlled.
Bottom line: Microsoft is setting up. And smart money is paying attention.
52 Week High and Low Boundaries
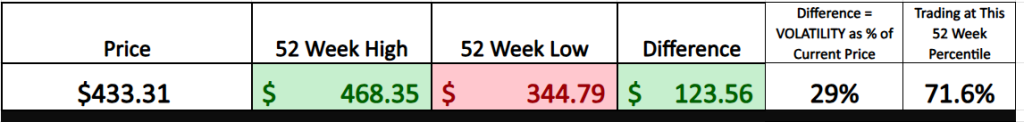
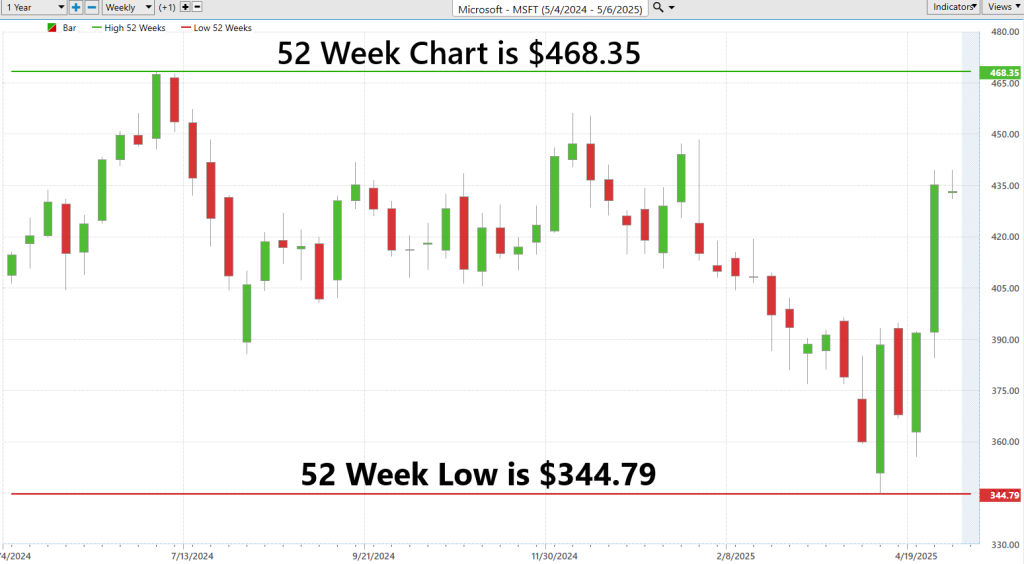
Smart traders follow the facts. And one of the most revealing indicators on the board? That 52-week high and low. This quiet titan of American innovation has moved from a low of $344.79 to a high of $468.35 over the past year. That’s a $123.56 spread — nearly 29% of its current value. That kind of movement doesn’t scream chaos. It signals opportunity — for the traders who understand what they’re looking at. And when a name like $MSFT punches through its 52-week high? That’s not a fluke — that’s ignition. That’s when the smart money starts leaning in, loading up, and pushing the trend to the next level.
Those lows? They’re not just where fear lived — they’re where some of the best buying happened. They’re not red flags. They’re clues. Clues for traders who don’t wait around for CNBC to tell them what just happened — they’re already positioned for what’s coming.
Make no mistake: $MSFT is breaking out, it’s drawing in the institutions, and it’s sending a message loud and clear: this isn’t just a tech stock — it’s a market leader hitting stride. You can watch from the sidelines — or you can ride the wave. But either way, this is where the action is.
Pull up the 10-year monthly chart on $MSFT, and the story becomes crystal clear — this is a generational trend. From a low of $39.72 to a high of $468.35, the range alone tells you everything you need to know. That’s over 1,000% in movement, and more importantly, a pattern of strength that’s been rewarded again and again.
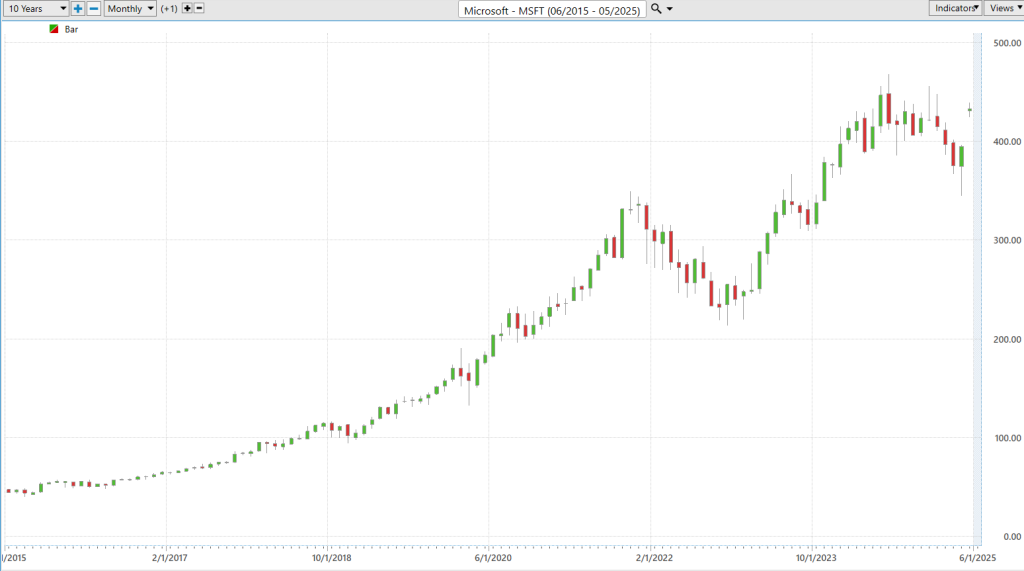
Now, $MSFT is inching back toward its all-time highs — and that kind of technical setup is where real traders start paying attention. We’re not talking about speculative breakouts or low-float moonshots. We’re talking about a proven winner coming back into focus.
When a name like this approaches its long-term ceiling, it doesn’t just test it — it often redefines it. For that reason alone, $MSFT deserves a front-row seat on your radar. The price action ahead will likely create a series of high-probability trading setups in the months to come.
Best-Case/Worst-Case Analysis
If you want to be a great trader, forget theory. Put the textbooks back on the shelf and start watching what’s happening in the market. The fastest, most brutally effective way to understand risk and volatility? Track the biggest uninterrupted rallies and bloodiest declines over the past year. Not because it’s cute data — but because it’s real. And real beats theoretical every time.
This simple exercise will slap the fog off your trading glasses. It shows you — with numbers, not feelings — what kind of upside is possible, and just how deep the trapdoor goes when things break bad. If the future echoes the recent past, you’ve got the map. So, treat your charts like treasure maps. Every vertical spike, every gut-punch crash — those aren’t accidents. They’re signals. Greasy fingerprints from the syndicates, the market movers, the institutional sharks nudging price while the retail crowd is still watching YouTube tutorials.
Because here’s the dirty secret: price history isn’t just boring old news. It’s a crime scene. It’s where you find the footprints of fear, greed, and manipulation. It’s where the market confesses what it wants to do next. You just have to listen. Because markets — for all their noise — are habitual beasts. They deceive, they fake-out, they play coy… and then they do the exact same thing they did several months ago.
So, forget the guesswork. Drown out the CNBC static. Start studying those pure, violent, magnificent price surges — the kind that slice through resistance like a hot knife through butter.
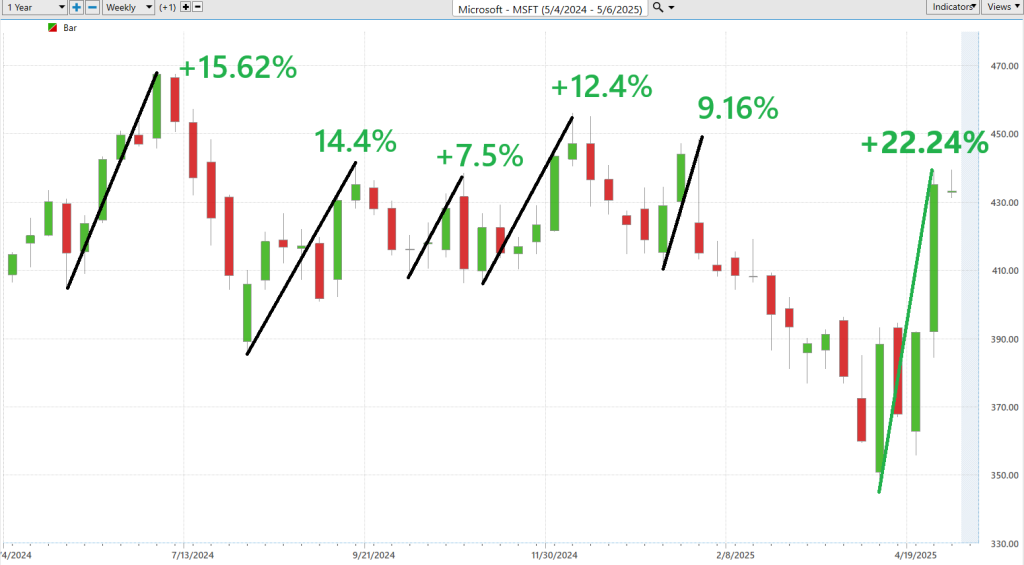
First, we look at the largest uninterrupted rallies over the past 52 weeks:
Next, we do the inverse and measure the largest uninterrupted declines over the past year.
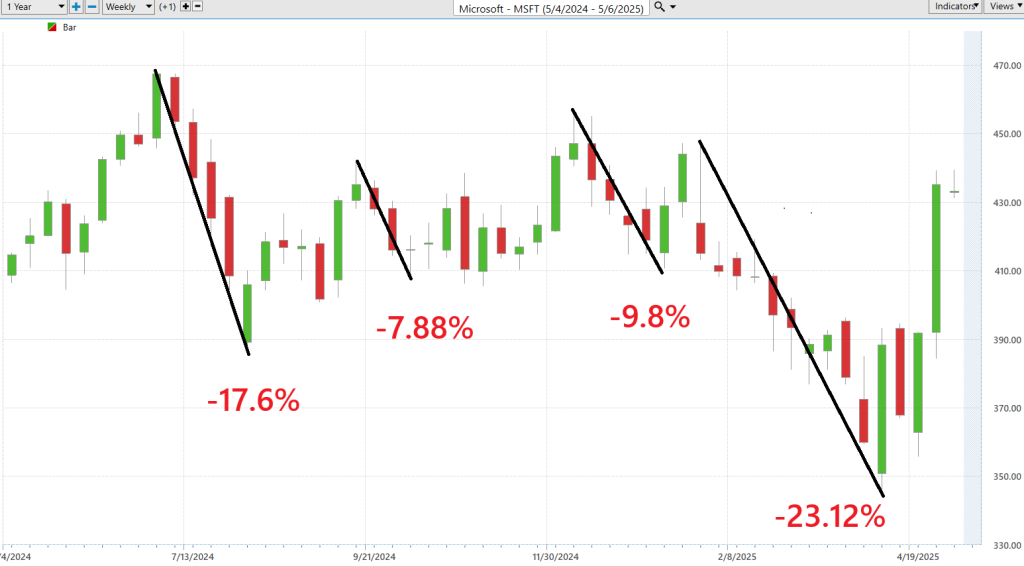
$MSFT is telling you loud and clear: the rallies are larger than the declines, while the pullbacks are persistent annoyances.
Next, let’s put $MSFT in context — not just as a standalone powerhouse, but as a core pillar of the broader market itself. Microsoft is embedded at the center of the financial ecosystem.
$MSFT is a heavyweight component of the S&P 500, the Dow Jones Industrial Average, and the Nasdaq 100 — three of the most widely tracked U.S. equity indexes. That means when you see the market move, chances are Microsoft is pulling a good chunk of that weight.
This matters for two reasons. First, Microsoft’s size and performance have a direct impact on passive portfolios, ETFs, and institutional benchmarks. Second, when $MSFT starts to diverge from the broader trend — either leading the charge or resisting the pullback — it’s a signal worth watching.
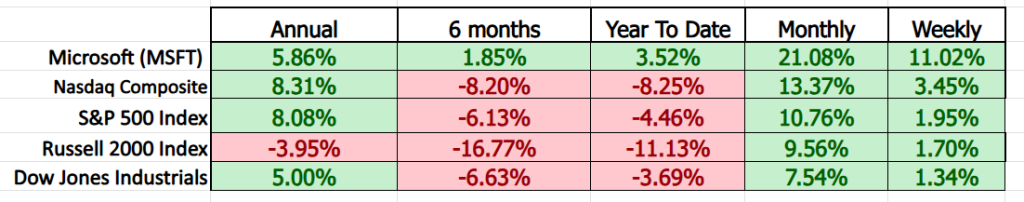
In short, comparing Microsoft to the broader market isn’t just academic. It’s essential. Because when a stock is the market, it tells you more than a chart ever could.
Let’s talk about beta — and no, it’s not some wonky academic term that belongs in a dusty finance textbook. Beta is how we measure a stock’s volatility relative to the broader market. A beta of 1 means a stock moves in line with the market. Higher than 1? That stock swings harder — it’s more volatile. Lower than 1? It’s steadier, more stable.
Now take a look at Microsoft ($MSFT). Its current beta? Around 0.89. That tells you something important — this tech titan moves with the market, but with a steadier hand. It’s not flying off the rails during panic selling, and it doesn’t need wild rallies to prove its worth. It just performs. Quarter after quarter. Year after year.
In a sea of noisy, momentum-chasing stocks, $MSFT is a fortress — less volatile than the market itself, but still delivering growth, innovation, and rock-solid earnings. That’s why institutions love it. That’s why it anchors index funds. And that’s why smart investors keep it front and center in their portfolios.
Bottom line: you don’t need high beta to build wealth. You need consistency, strength, and staying power. And Microsoft has all three.
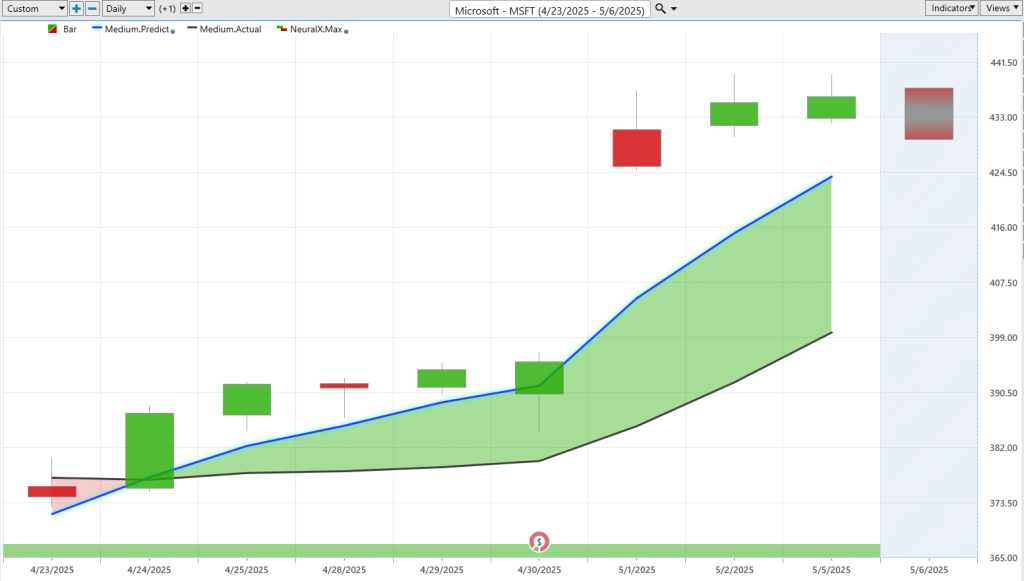
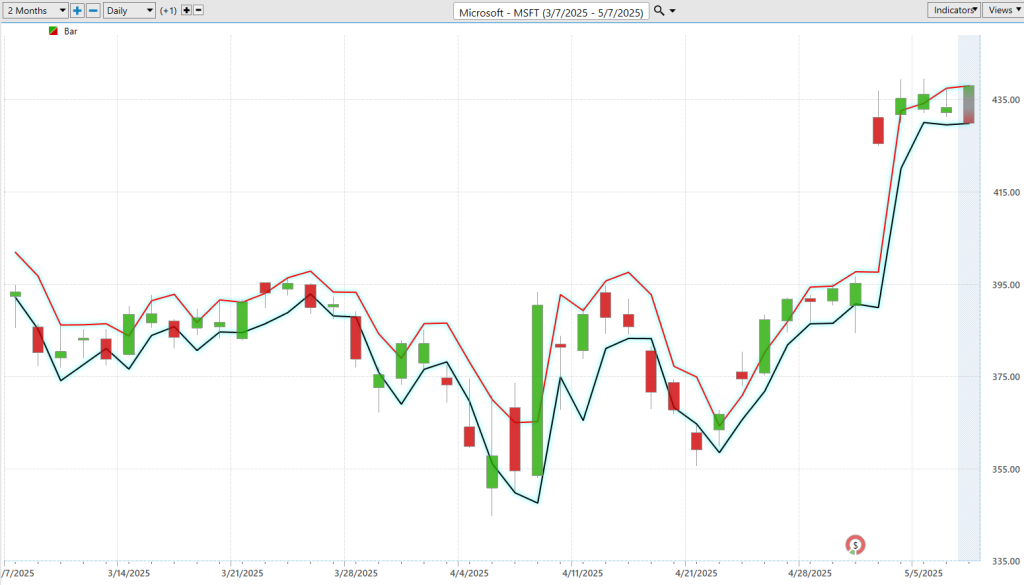
Vantagepoint A.I. Predictive Blue Line
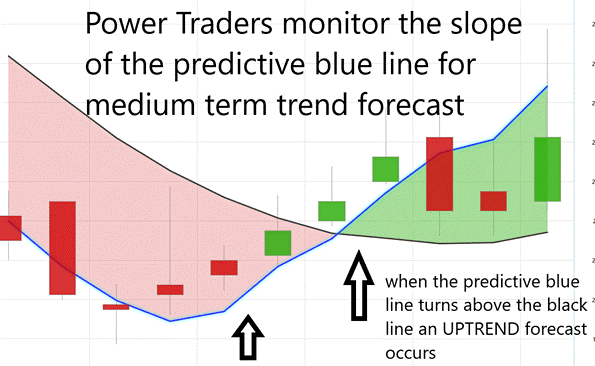
If you’re thinking about trading $MSFT, understand this: success doesn’t come from guesswork or gut instinct. That’s where VantagePoint’s Predictive Blue Line enters the picture. Don’t confuse this with a typical trendline or technical squiggle. This is artificial intelligence at its most elegant — a strategic, forward-looking signal designed to cut through the market’s noise and reveal when momentum is truly shifting. When that line trends upward, it’s your green light. And when it starts to curl downward? That’s your early warning system — a cue to tighten your stops or reevaluate your exposure.
Smart traders also focus on the Value Zone — that moment when $MSFT brushes against or dips just below the Predictive Blue Line while in an uptrend. Often, that’s not a cause for concern — it’s a chance to enter with confidence. But if the stock is trending lower and suddenly pierces above the line, that’s often a subtle but powerful exit cue — a sign the market may be stalling or shifting.
Should that Predictive Blue Line take a sharp downward turn, that’s not the time to hope or hang on. It’s the time to act like a professional: reassess, protect your capital, and apply proper risk management. Real market winners aren’t reckless — they’re prepared.
What makes this work? VantagePoint’s A.I. platform. It synthesizes hundreds of global indicators, patterns, and relationships to give you what every great trader needs — a faster, smarter way to spot opportunities and sidestep risk.
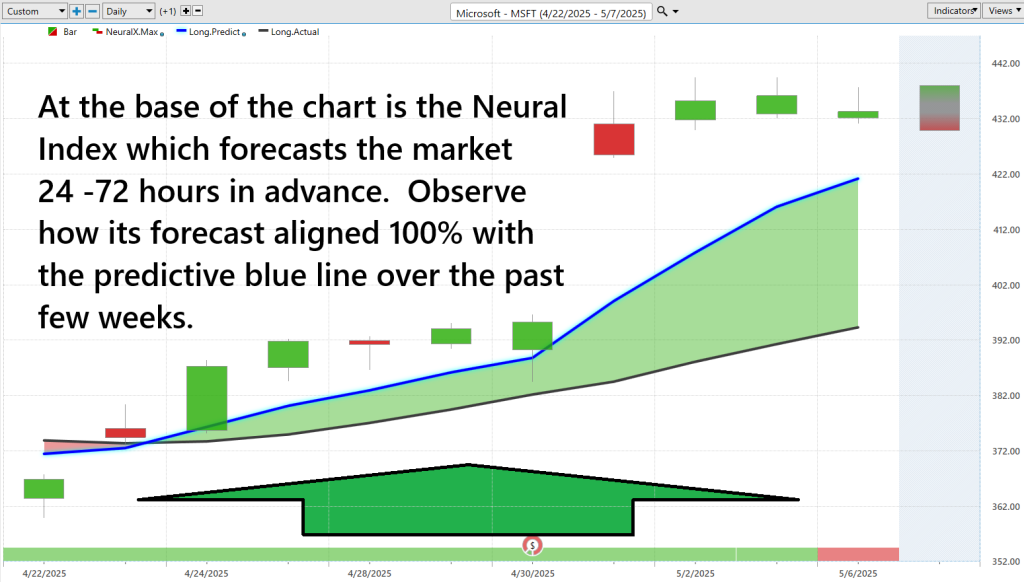
Neural Network Forecast (Machine Learning)
Look, most traders are flying blind and calling it strategy. They’re gut-checking every move, glued to CNBC, and praying their instincts are sharper than the next guy’s. But the truth? That’s a slow bleed. Because the markets don’t care about your hunches. They reward precision. And that’s where neural networks come in.
What’s a neural network? Think of it like a digital brain on steroids — trained to sniff out patterns in the market that no human could ever spot in time. It chews through mountains of historical data, current trends, and intermarket relationships faster than a caffeine-fueled floor trader on adrenaline. It’s not guessing. It’s calculating. Predicting. And it’s doing it without fear, greed, or second-guessing clouding its judgment.
One of the most brutal tools in its arsenal? The Neural Index. It sits quietly at the bottom of your VantagePoint chart, looking harmless. But it’s not. It’s your canary in the coal mine. Green means strength — it’s time to lean in. Red? That’s your cue to get defensive or tighten up. It forecasts short-term moves, usually one to three days out, and it’s freakishly accurate when you use it right.
This ain’t magic. It’s machine learning — the kind of A.I. the hedge funds don’t want you using because it levels the playing field. You’re not reacting to yesterday’s news. You’re trading today like you already know what tomorrow brings. That’s the edge. That’s the difference between the pros stacking wins and the amateurs eating losses.
So, here’s the truth bomb: you can keep trading on gut instinct, or you can plug into a system that reads the market like a crime scene and shows you where the fingerprints are. Neural networks turn your trading from guesswork into guided missiles.
Want to trade smarter? Drop the ego. Let machine learning do the heavy lifting. That’s how real traders win.
VantagePoint A.I. Daily Range Forecast
If you’re still trading on hunches and lagging indicators, you’re roadkill.
What used to be science fiction — reading market patterns like a book and predicting moves with scalpel-like precision — is now the baseline. This is the new standard. If you’re not ahead of the move, you’re already behind.
And the smart traders? They’re not sitting around waiting for volatility to slap them in the face. They’re locked, loaded, and in position before the storm hits. Why? Because they’ve ditched the guesswork and plugged into artificial intelligence — a ruthless machine built to strip away emotion and hand them clarity on a silver platter.
Take $MSFT. Pull back the curtain and look at its trading behavior over daily, weekly, and monthly time frames for the last year.
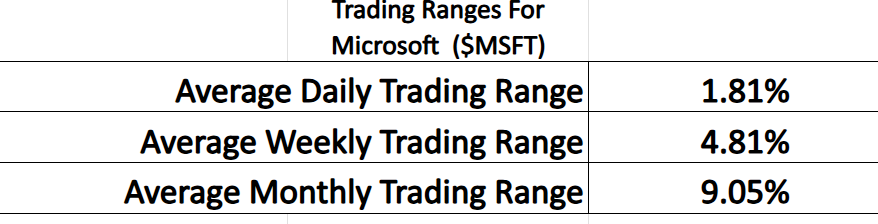
The challenge is how to apply your decision-making process to this level of volatility.
VantagePoint doesn’t just give you a “nice-to-have” advantage. It’s the unfair weapon your competition doesn’t want you touching. It turns wild price swings into sniper shots. It lets you strike with surgical timing while the rest of the herd is still scratching their heads.
Bottom line? If you want to stop getting slapped around by this market and start making real trades — calculated, precise, confident trades — then step into the future. VantagePoint’s A.I. isn’t for the timid. It’s for traders who are sick of being reactive and are ready to go on offense.
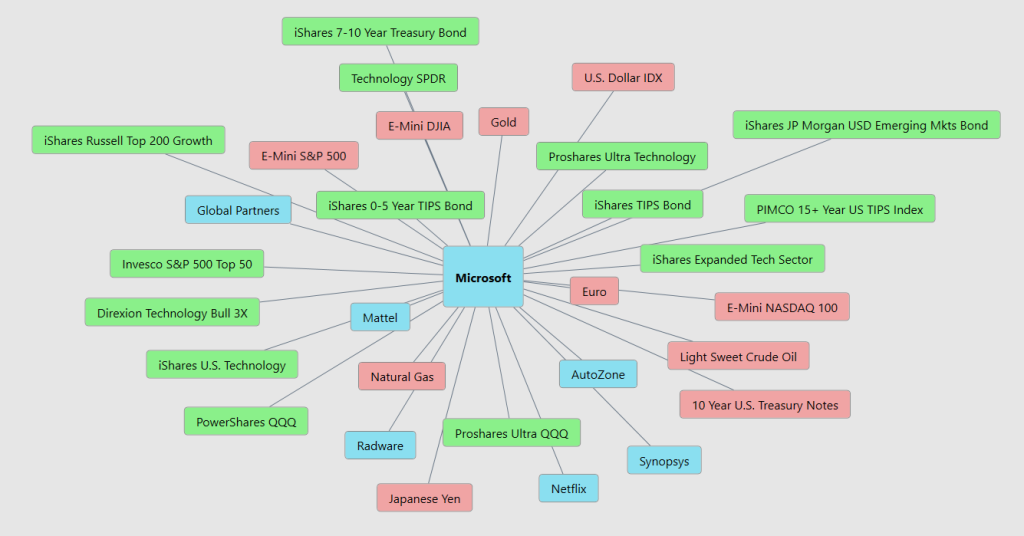
Intermarket Analysis
Smart investors know: no asset moves in isolation. Intermarket analysis reveals the invisible strings pulling stocks like Microsoft ($MSFT)—from interest rates to currency strength to tech sentiment. When the Nasdaq surges, $MSFT usually rides the wave. When Treasury yields climb, they can crush future cash flow assumptions and deflate tech valuations. And don’t ignore the U.S. dollar—a rising dollar can quietly shave billions off $MSFT’s overseas revenue when earnings come home.
The beauty of this approach is its elegance. You don’t need to guess where $MSFT is headed — you need to watch the forces shaping the battlefield. Fed policy. Global currency trends. Tech sector flows. Each one is a signal. Used properly, they give you the clarity to act with conviction, while others react in confusion. This is how master traders spot the big moves before the headlines catch up.
Here are the 31 top drivers of $MSFT price.
Our Suggestion
Microsoft’s not riding on Excel and Windows anymore — it’s Azure that’s driving the bus, and it’s flying. Azure is Microsoft’s cloud computing platform — a powerhouse of services that lets businesses run apps, store data, and scale operations through the internet instead of on their own servers.
In fiscal Q3, Azure revenue exploded 33% (35% in constant currency), beating even their own bullish forecast. That’s the seventh straight quarter of 30%+ growth — a streak most companies would kill for. Nearly half of that growth came from A.I., while the rest came from good old-fashioned cloud dominance. Intelligent Cloud overall raked in $26.8 billion, up 21%, with GitHub Copilot use quadrupling to $15 million. Bottom line? Azure’s not just growing — it’s crushing it.
Microsoft’s last two earnings calls were a masterclass in how to dominate a market while keeping your foot on the gas. In Q2 2025, they pulled in $69.6 billion in revenue — up 12% — and posted $3.23 EPS, beating expectations yet again. The real headline? Their A.I. business hit a $13 billion annual run rate, up 175% year-over-year. Azure grew 31%, and Microsoft Cloud revenue surged to $40.9 billion. Even with Xbox hardware sales dropping 29%, Game Pass and cloud gaming kept the gaming division afloat. Investors grumbled about cloud growth slowing slightly, but the fundamentals stayed rock solid.
Then came Q3 2025, and revenue hit $70.1 billion, up 13%, with $3.46 EPS. Cloud and A.I. revenue soared to $42.4 billion, and operating margins hit a jaw-dropping 46%. Azure’s growth continued to impress, and the AI business kept expanding. The market responded with a 7.9% after-hours surge. Bottom line: Microsoft is rewriting the rules of the A.I. game.
Place $MSFT on your trading radar. It could create numerous trading opportunities in the months ahead.
Practice solid money management on all your trades.
Use the VantagePoint’s A.I. Daily Range Forecast to locate short term trading opportunities.
It’s not magic.
It’s machine learning.
Disclaimer: THERE IS A HIGH DEGREE OF RISK INVOLVED IN TRADING. IT IS NOT PRUDENT OR ADVISABLE TO MAKE TRADING DECISIONS THAT ARE BEYOND YOUR FINANCIAL MEANS OR INVOLVE TRADING CAPITAL THAT YOU ARE NOT WILLING AND CAPABLE OF LOSING.
VANTAGEPOINT’S MARKETING CAMPAIGNS, OF ANY KIND, DO NOT CONSTITUTE TRADING ADVICE OR AN ENDORSEMENT OR RECOMMENDATION BY VANTAGEPOINT AI OR ANY ASSOCIATED AFFILIATES OF ANY TRADING METHODS, PROGRAMS, SYSTEMS OR ROUTINES. VANTAGEPOINT’S PERSONNEL ARE NOT LICENSED BROKERS OR ADVISORS AND DO NOT OFFER TRADING ADVICE.


