| This week’s a.i. Stock Spotlight is MicroStrategy ($MSTR) |
In the ever-evolving landscape of technology and finance, MicroStrategy Inc. ($MSTR) stands out as a company deserving of close scrutiny by traders and investors seeking opportunities at the intersection of data intelligence and cryptocurrency.
MicroStrategy, founded in 1989 by Michael Saylor, has established itself as a prominent player in the business intelligence and analytics industry. With a rich history of innovation and a diverse product portfolio, the company has consistently demonstrated its ability to adapt to changing market dynamics.
One of the key factors setting MicroStrategy apart is its visionary CEO, Michael Saylor, who is not only a tech luminary but also a charismatic Bitcoin evangelist. In 2020, Saylor made waves by allocating a substantial portion of the company’s treasury reserves to Bitcoin. This move, while initially seen as unconventional, has since garnered significant attention, and served as a catalyst for other corporations to consider similar strategies. At the time, Saylor referred to his treasury as an ice cube which was melting in the inflationary sun. That analogy has changed the thinking of traders and investors alike regarding monetary policy in the United States.
MicroStrategy holds a substantial Bitcoin position of 189,150 Bitcoins, acquired at an average price of $31,168.00 per Bitcoin. This positions the company as a major holder of the cryptocurrency, and Saylor’s commitment to this investment is indicative of a strong belief in Bitcoin’s potential as a store of value and a hedge against inflation.
MicroStrategy’s embrace of Bitcoin has had a ripple effect across the corporate landscape. The company’s success in integrating Bitcoin into its treasury management strategy has inspired other businesses to explore similar options. As a result, $MSTR has played a pivotal role in encouraging wider adoption of cryptocurrencies by corporations.
Since August 2020 when MicroStrategy committed these funds to Bitcoin its stock has skyrocketed 366% while over the same time frame the S&P 500 is up only 37.87%.
Over the past year $MSTR is up 372%. The S&P 500 is up 24%. Meanwhile Bitcoin is up 157%. These values and metrics pose a little bit of a puzzle in terms of trying to comprehend why $MSTR has so massively outperformed.
$MSTR to some extent has benefited as aggressive hedge funds which may not have had regulatory clarity and permission to invest in bitcoin used $MSTR as a cryptocurrency trading vehicle.
Beyond its Bitcoin holdings, MicroStrategy continues to offer a range of business intelligence and analytics solutions, including advanced analytics, mobility, and security services. This diversified product portfolio provides stability and opportunities for revenue growth.
MicroStrategy Inc. ($MSTR) is a company that has caught the attention of traders and investors alike, and there are compelling reasons to keep it on your radar. Founded 34 years ago as a data mining and analytics company, MicroStrategy has undergone a remarkable transformation. It experienced both soaring highs during the dot-com bubble and challenging lows, including an SEC probe due to financial restatements. However, the company’s ability to adapt and evolve has kept it in the spotlight.
One of the most intriguing aspects of MicroStrategy’s recent journey is its foray into the world of cryptocurrencies, particularly Bitcoin. In a bold move, the company invested heavily in Bitcoin, and this decision resulted in a significant surge in its stock price. The company’s commitment to digital assets and its substantial Bitcoin holdings have made it a unique player in the financial world. Furthermore, MicroStrategy’s diversified revenue streams, including software licenses, services, and subscription services, position it for growth in an ever-evolving tech landscape.
Despite its challenges, MicroStrategy’s resilience, adaptability, and strategic evolution make it a company to watch closely. Whether you’re a trader or an investor, the intersection of data intelligence, cryptocurrency, and innovative strategies makes MicroStrategy a captivating subject. As the company continues to navigate the dynamic market, keeping a close eye on $MSTR may offer valuable insights into the future of business intelligence, analytics, and cryptocurrency integration.
In an era where technology, finance, and digital assets are converging, MicroStrategy ($MSTR) emerges as a stock to watch for investors. Its established presence in the data intelligence sector, combined with its bold and successful foray into Bitcoin, sets it apart as a company with the potential for substantial growth and innovation. Whether you’re a tech enthusiast, a cryptocurrency advocate, or a traditional investor, MicroStrategy offers a compelling story worth following closely in the years to come.
In this Stock analysis we will focus on the following indicators:
- Wall Street Analysts’ Estimates
- 52-week high and low boundaries
- Vantagepoint A.I. Triple Cross Forecast
- The Best Case – Worst Case Scenarios
- Neural Network Forecast
- Daily Range Forecast
- Intermarket Analysis
- Our trading suggestion
We don’t base our trading decisions on things like earnings or fundamental cash flow valuations. However, we do look at them to better understand the financial landscape that a company is operating under.
Wall Street Analysts’ Estimates
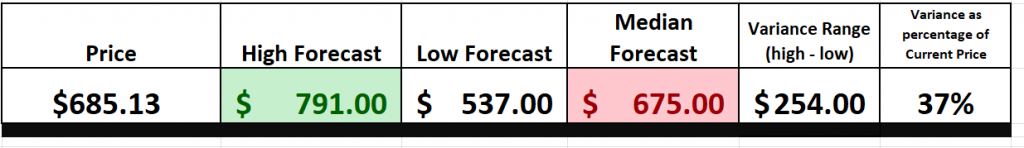
According to a consensus of four analysts specializing in MicroStrategy Inc., their 12-month price forecasts indicate a median target of $675.00. Among these predictions, the highest estimate stands at $791.00, while the lowest estimate is at $537.00. Notably, the median estimate implies a slight decrease of approximately -1.48% from the company’s recent trading price of $685.13. These forecasts provide valuable insights for investors considering positions in MicroStrategy Inc., suggesting a range of potential outcomes over the coming year.
We typically like to look at the variance between the most bullish and bearish forecasts and use that as a gauge for future expected volatility. Currently, this variance is 37% or $254.
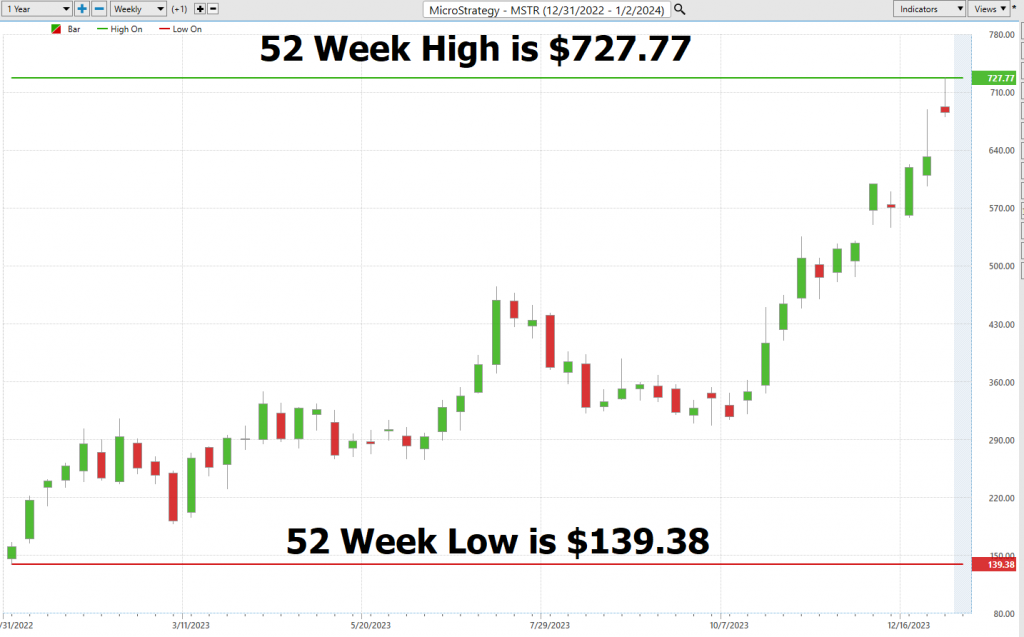
52-Week High and Low Boundaries
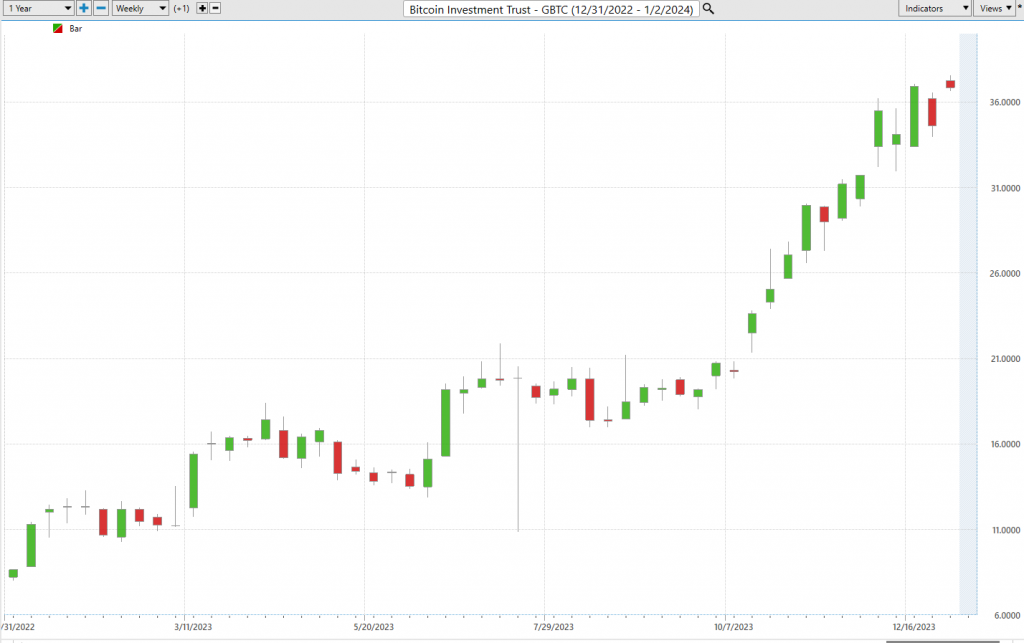
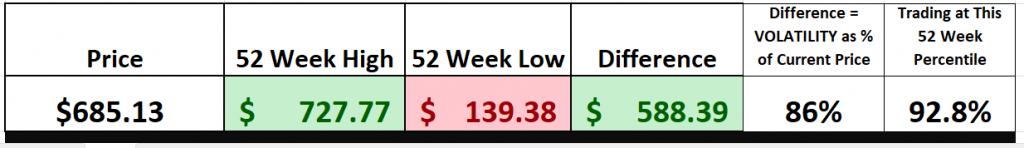
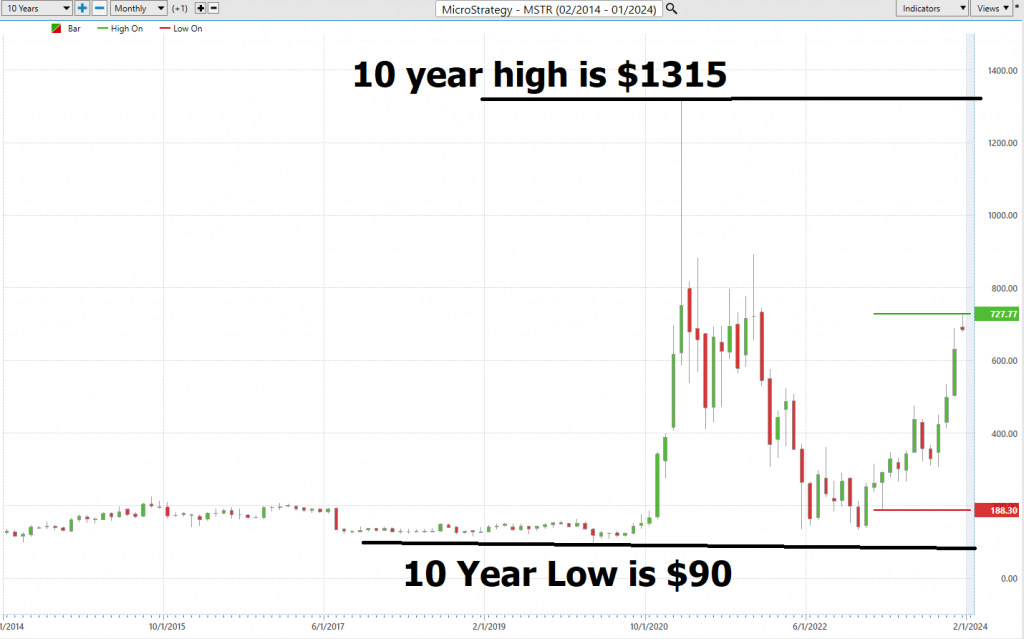
Over the past 52 weeks $MSTR has traded as high as $727.77 and as low as $139.38. The annual trading range was $588.39. These numbers provide us with an accurate perspective of historic volatility which we can calculate by comparing the annual trading range and comparing that value to the current price. Over the last 52 weeks the historic volatility was 86% which is extremely high. This value tells us that based upon the recent past it would be perfectly normal to expect prices to trade 86% higher and or lower over the next 52 weeks.
We also like to look at an asset in terms of its 10-year time frame.
Great traders and investors pay close attention to a stock’s 52-week high and low boundaries for several key reasons. These levels offer insights into a stock’s recent price momentum and trend, helping traders identify potential entry and exit points. Moreover, they carry psychological significance, influencing market sentiment when breached. The 52-week boundaries can also function as support and resistance levels, aiding in risk management and price target setting. Comparing these levels to a longer-term 10-year chart provides context for the stock’s performance, helping distinguish between short-term fluctuations and sustained trends. By considering these factors, traders and investors make more informed decisions and tailor their strategies to current market conditions effectively.
Best Case – Worst Case Scenario
One of the most fundamental techniques for understanding real world volatility is simply measuring on a chart the magnitude of the rallies against the size of the declines. This practical approach allows any trader to understand what the risk and reward potential of the asset has been over the time frames analyzed.
In the realm of market analysis, a price chart serves as an invaluable tool, akin to a detailed map of Wall Street’s labyrinth. During bullish market phases, a chart soars gracefully, mirroring the optimism that draws investors seeking prosperity. Yet, even amid these upswings, periodic corrections test the mettle of seasoned professionals. Likewise, market downturns are like plunging into an abyss, evoking fear, and uncertainty, with investors navigating treacherous waters. In this context, it’s imperative to gauge the magnitude of rallies against downturns, akin to measuring waves in a tempestuous sea, offering a sobering view of risk and volatility.
This analytical approach is indispensable for investors. By examining both optimistic and turbulent scenarios, one gains a comprehensive perspective on a stock’s real potential. It transcends mere projections of future gains, providing a balanced understanding of risks and downturns. This dual viewpoint serves as a compass, guiding investors through market volatility and revealing the essence of asset dynamics. It’s not just a tactical maneuver; it’s a strategic philosophy empowering informed decision-making, enabling the management of exposure, and ensuring a resilient, well-crafted investment strategy that weighs risk and reward.
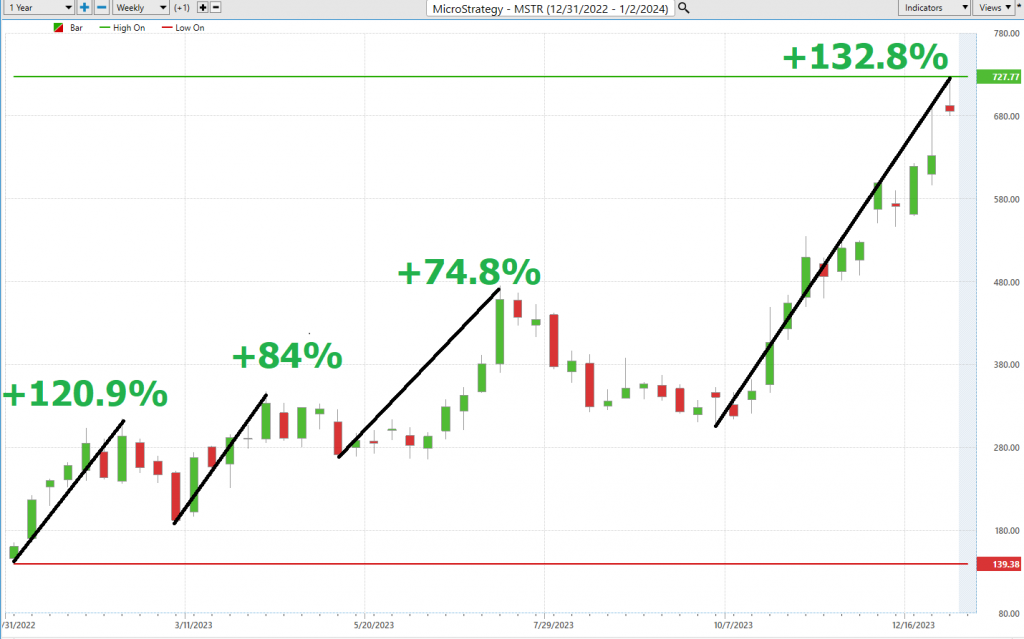
The following charts are helpful in distilling and defining the volatility of this asset.
Here is the best-case analysis:
Followed by the Worst-case Analysis:
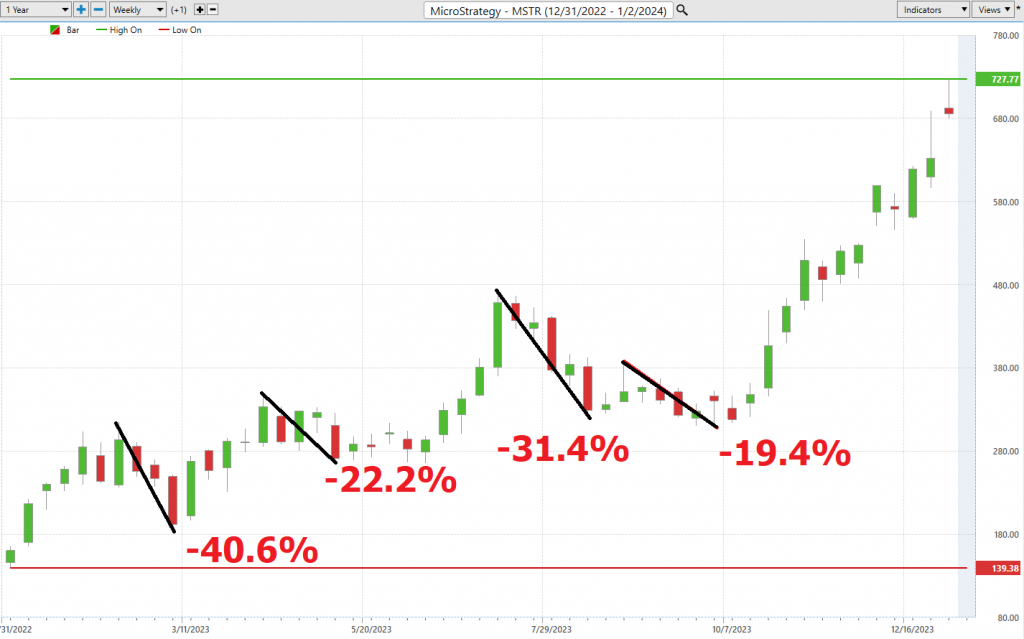
Viewed from this perspective we can immediately see the reward and risk of the past year for $MSTR.
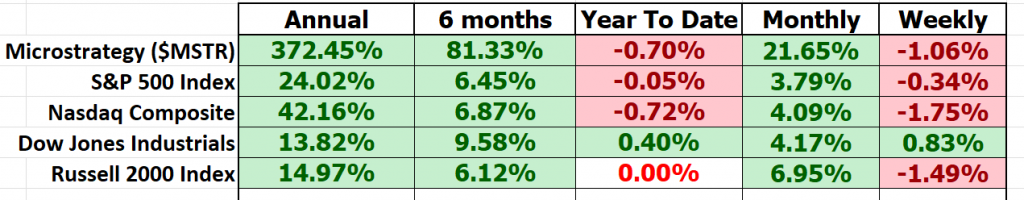
Next, we need to compare $MSTR to the broader stock market indexes. By doing so we can immediately see that $MSTR has massively outperformed the broader market.
Last but not least we need to compare the volatility of $MSTR to the broader market. This is done by looking at BETA. Beta is a measure of a stock’s volatility in relation to the overall market. A beta of 1 indicates the stock tends to move in line with the market, while a beta greater than 1 suggests higher volatility, and a beta less than 1 implies lower volatility compared to the market.
Microstrategy ($MSTR) has consistently outperformed the broader market indices across various time frames, warranting a closer examination of its volatility, particularly in relation to market heavyweights. In the world of finance, this assessment is encapsulated by the metric known as “BETA.” Amidst the complexities of Wall Street, beta (β) emerges as a financial yardstick akin to the Richter scale for stocks. It quantifies a stock’s sensitivity to the broader market’s movements, offering insights into its behavior during market fluctuations, often benchmarked against major indices like the S&P 500.
Microstrategy ($MSTR), over the past 5 years, exhibits a beta of 2.39 , indicating it is 139% more volatile than the broader market.
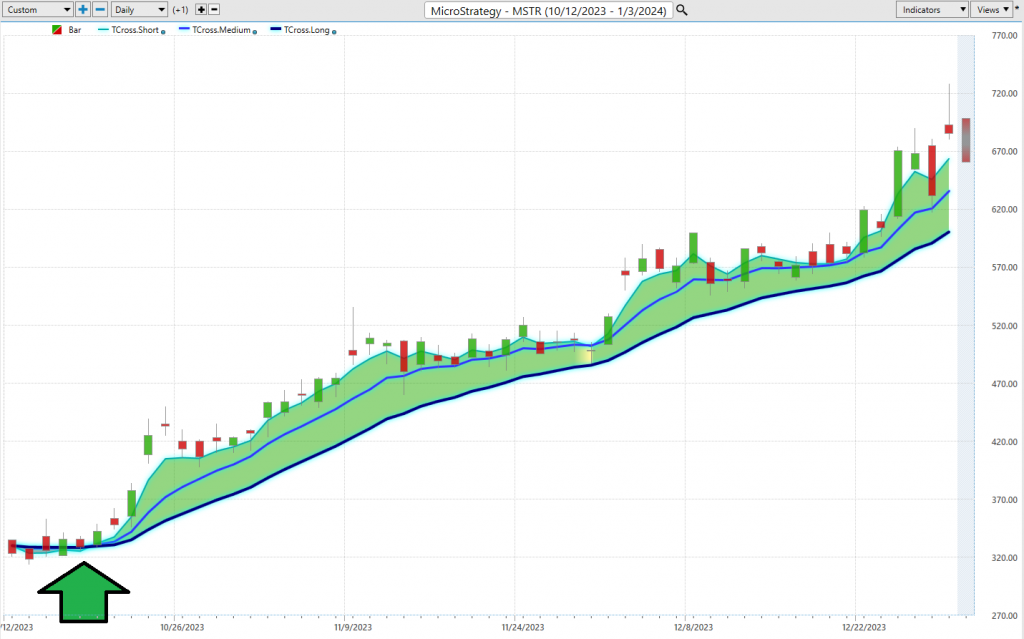
The VantagePoint A.I. Triple Cross Indicator
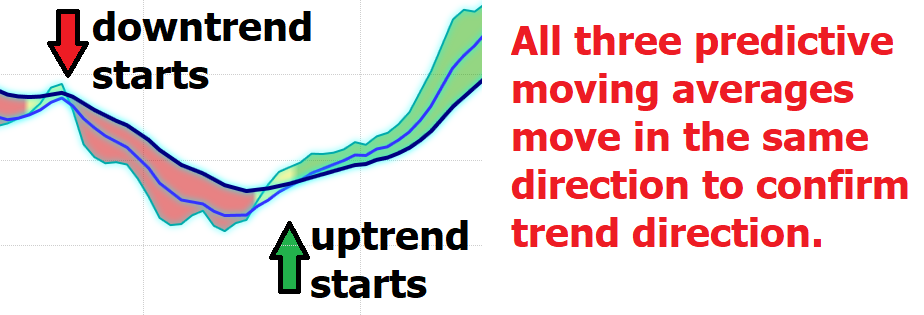
Let’s talk about an immensely powerful indicator in the world of trading, the Triple Cross Indicator – the secret weapon of Power Traders. This revolutionary tool, courtesy of Vantagepoint A.I., takes a bold departure from the conventional dual moving averages and introduces a triumvirate of predictive moving averages: the 3-day, 8-day, and 18-day. It’s like having a crystal ball for short-term, medium-term, and long-term market dynamics!
Now, here’s the genius behind it. When that short-term average crosses above the medium-term, it’s like a subtle market whisper, hinting at a potential shift. But the real symphony starts when the medium-term gracefully eclipses the long-term average – that’s when you’ve got a confirmed trend reversal on your hands. The Triple Cross Indicator doesn’t just observe the market; it orchestrates it, providing traders with a savvy edge.
It’s a shield against hasty decisions, a guardian against market trickery. The Triple Cross Indicator is your trusted ally in spotting early trend changes, backed by its three moving averages. It’s not about making more trades; it’s about making smarter ones, taking your trading game to the next level. Now, let’s apply this brilliance to analyze the recent performance of MicroStrategy ($MSTR
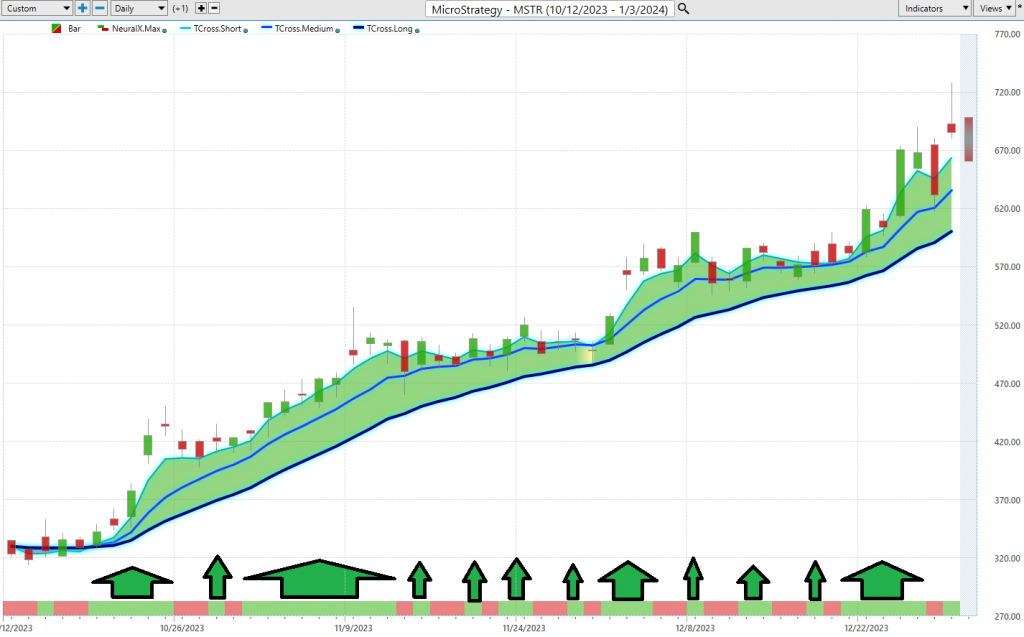
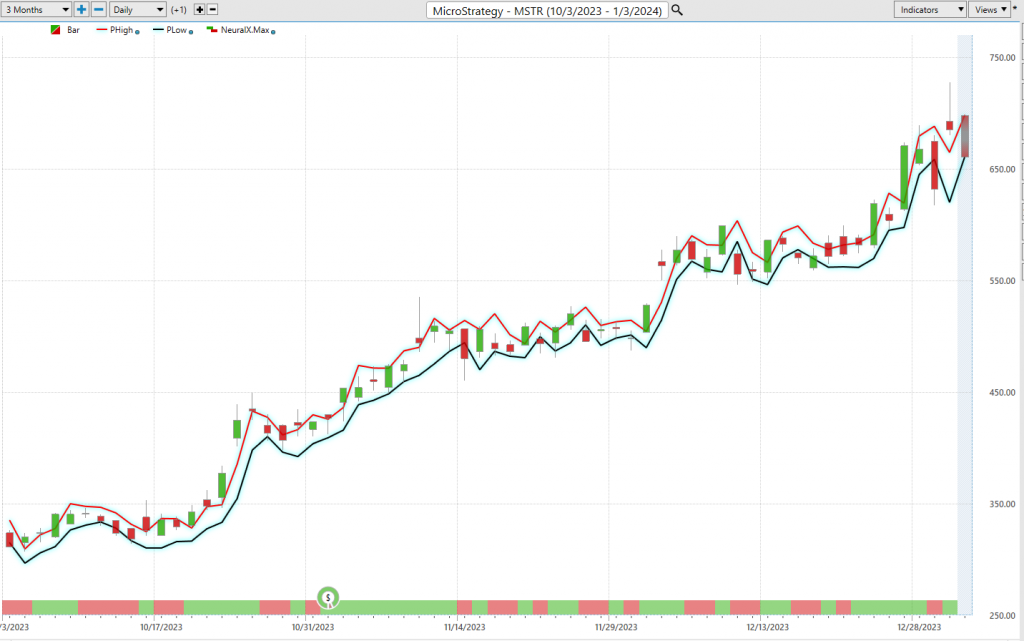
Neural Network Indicator (Machine Learning)
Now, folks, let’s get right down to it. At the heart of this chart, we’ve got the Neural Network Indicator, a real game-changer in forecasting the market’s short-term strength or weakness. When the Neural Index turns green, it shouts “strength!” But when it goes red, it’s saying, “brace for short-term weakness.” And it’s not just a hunch; this Neural Index is looking ahead for the next 48 to 72 hours.
Now, what’s a neural network, you ask? Well, think of it as a computer system that’s taking a page from our own brains. It’s got input nodes, output nodes, and hidden nodes. Input nodes soak in information from the outside world, output nodes send it back out, and those hidden nodes do some processing behind the scenes. It learns by tweaking the weights of the connections between these nodes. The stronger the connection, the more influence it has.
But here’s the beauty – it’s all about translating mountains of data into a clear outcome. A Neural Net is a learning system, always monitoring itself and getting better at the job. When Power Traders are hunting for solid trading setups, they look for DOUBLE confirmation, where the triple cross and the Neural Net agree on the future. Those arrows on the chart? They point right at the double confirmation setup.
Why do we care? Because neural networks are the secret sauce for traders. They’re quantitative and probabilistic, meaning they can sniff out patterns that we humans might miss. Like spotting when a trend’s about to flip. So, when we talk about $MSTR, it’s all about crossing that chart with the triple cross and neural network indicator. That’s how you find your golden entry and exit points.
Power Traders out there, you’ve got to harness the might of neural networks and A.I. to conquer these markets and find trades that stand up to statistical scrutiny. It’s all about gaining that edge and making savvy decisions on when to buy and sell.
VantagePoint Software Daily Price Range Prediction
In the world of trading, we’re always in pursuit of that perfect moment to strike. And to stay ahead, Power Traders turn regularly to the Daily Range Forecast.
Now, what makes this so special? It’s all about fine-tuning those entries and exits, especially for those traders who thrive in the fast lane, seeking those smaller time frames and pinpointing granular opportunities.
Here are the average trading ranges for $MSTR on a daily, weekly, and monthly basis.
Now study the Daily Range Forecast chart. It’s your guide to what short-term swing traders can expect each trading day.
In the high-octane world of trading, precision is everything. And that’s where Vantagepoint A.I.’s Daily Range forecast comes into play. It’s powered by AI, machine learning, and neural networks, delivering a daily forecast for each trading session. It’s your GPS in the market, helping Power Traders strategically navigate trends, make those crucial entries, and exits.
Intermarket Analysis
Intermarket analysis is a critical method of dissecting markets by scrutinizing the intricate relationships between different asset classes. In simple terms, what happens in one market can have a ripple effect on others, and understanding these connections can be a game-changer for traders. Now, Vantagepoint Software is making waves, and rightly so, with its pioneering approach to Intermarket analysis. This method goes beyond the usual chart analysis and dives deep into the interconnected web of market relationships. It identifies assets with significant statistical correlations that often dictate price movements. In today’s complex global marketplace, we need a broader lens to understand the myriad interconnections shaping market dynamics.
Intermarket analysis isn’t your run-of-the-mill single-market evaluation. It’s about recognizing the intricate interplay among various markets – stocks, bonds, commodities, currencies – and how these interdependencies steer the broader market. For instance, a spike in interest rates, typically associated with the bond market, might shift investor preferences toward bonds, reducing the appeal of equities and potentially triggering a stock market decline.
John Murphy, a familiar name from CNBC, has been a staunch advocate of this approach. His work, including “Intermarket Analysis: Profiting from Global Market Relationships,” emphasizes the fact that markets are intrinsically linked. Lou Mendelsohn, the visionary and founder behind Vantagepoint A.I., also champions Intermarket Analysis.
For traders, this analysis offers a panoramic view of the market, moving away from tunnel vision. It’s a comprehensive assessment of intertwined market dynamics, potentially enhancing predictive accuracy and providing clearer insights into market trends.
Moreover, it helps traders manage risk effectively. If one asset class is expected to decline, savvy traders can offset potential losses by investing in another asset poised to rise. While Intermarket analysis is a powerful tool, it should be used in conjunction with other forms of analysis, not in isolation.
We live in a global marketplace where everything is interconnected. To succeed, traders must identify the key drivers behind price movements. These intangibles, often invisible to the naked eye, are the forces driving prices. These markets exhibit high statistical correlations, and studying Intermarket analysis can uncover competitors and sectors poised to trend alongside the asset you’re studying.
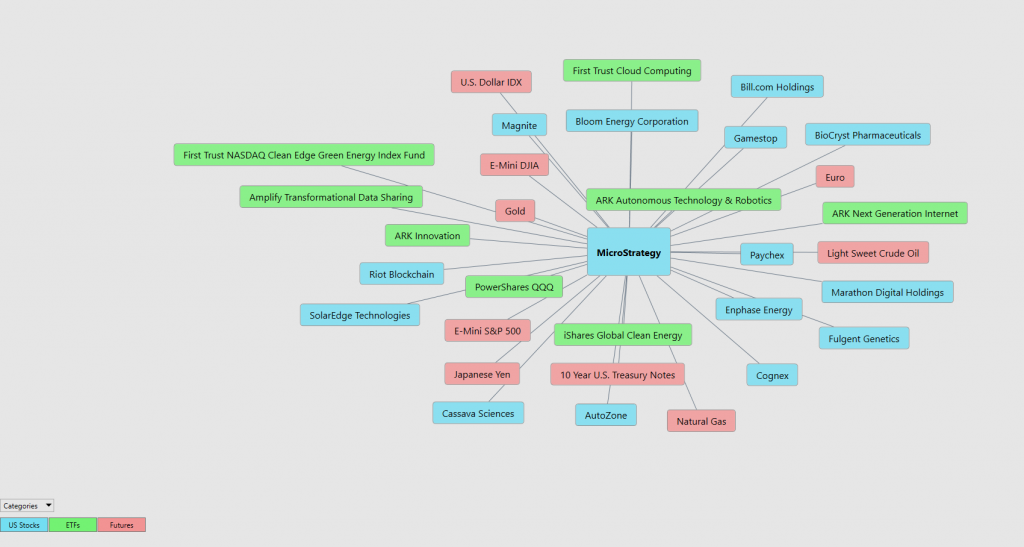
So, folks, understanding the key drivers of price action, like in the case of $MSTR, can be incredibly valuable. Dive into the graphic, and you might just uncover some hidden gems for your trading journey.
Our Suggestion
As I mentioned earlier $MSTR is UP twice as much as bitcoin over the past year. Chances are that occurred because hedge funds were pursuing $MSTR because as a bitcoin substitute. The expectations on the Street are that a Bitcoin ETF will be approved sometime in January 2024. It is difficult to conclude whether this would adversely affect $MSTR.
MicroStrategy’s foray into Bitcoin began in 2020, and its recent actions have raised eyebrows in the financial world. Despite having only $45 million in cash as of Q3 2023, the company managed to purchase over $600 million worth of Bitcoin, bringing its total holdings to more than 189,000 bitcoins at an average cost of $31,168 per coin. With Bitcoin currently trading around $43,000 per coin, MicroStrategy boasts unrealized gains exceeding $2 billion. The company recently sold over 1 million shares to fund this Bitcoin acquisition, emphasizing its commitment to cryptocurrency. While MicroStrategy’s capital-allocation strategy has undeniably boosted shareholder value, questions linger about its long-term plans. As a software business with modest revenue growth and ongoing losses, the company’s path forward remains unclear. Nevertheless, the prospect of a potential Bitcoin surge in 2024 keeps MicroStrategy in the spotlight, as it continues to outperform the market. With the Bitcoin halving approaching, traditionally a bullish period for the cryptocurrency, MicroStrategy’s performance warrants close attention for trading opportunities, especially when using AI-driven trend analysis and prudent money management techniques.
Let’s Be Careful Out There!
Remember, It’s Not Magic.
It’s Machine Learning.
Disclaimer: THERE IS A HIGH DEGREE OF RISK INVOLVED IN TRADING. IT IS NOT PRUDENT OR ADVISABLE TO MAKE TRADING DECISIONS THAT ARE BEYOND YOUR FINANCIAL MEANS OR INVOLVE TRADING CAPITAL THAT YOU ARE NOT WILLING AND CAPABLE OF LOSING.
VANTAGEPOINT’S MARKETING CAMPAIGNS, OF ANY KIND, DO NOT CONSTITUTE TRADING ADVICE OR AN ENDORSEMENT OR RECOMMENDATION BY VANTAGEPOINT AI OR ANY ASSOCIATED AFFILIATES OF ANY TRADING METHODS, PROGRAMS, SYSTEMS OR ROUTINES. VANTAGEPOINT’S PERSONNEL ARE NOT LICENSED BROKERS OR ADVISORS AND DO NOT OFFER TRADING ADVICE.