


This week’s ai stock spotlight is NETFLIX ($NFLX)
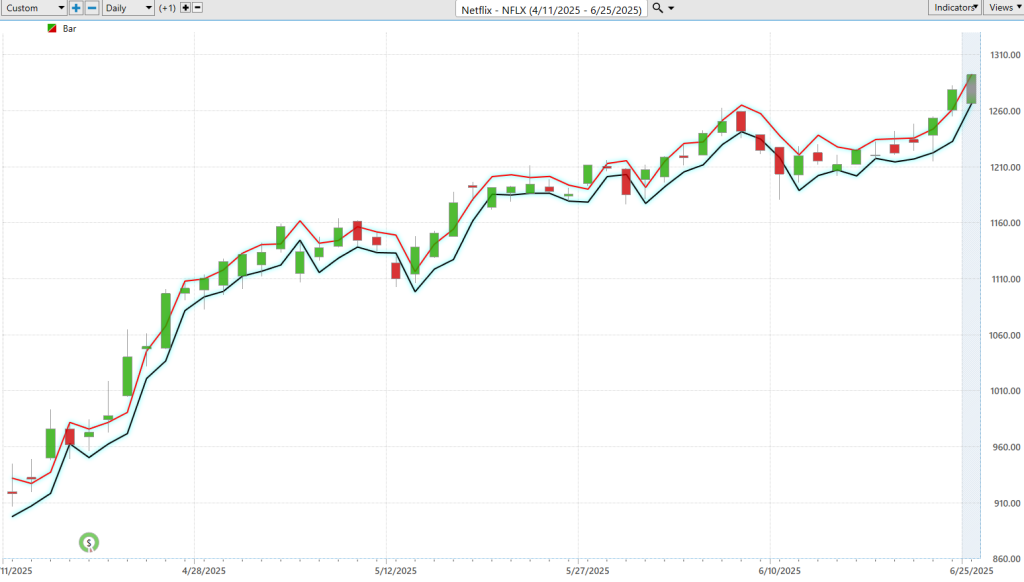
Netflix ($NFLX) is back in the spotlight and not just because of a new season of your favorite show. The stock is making new 52-week and 10-year highs, a sign Wall Street is once again confident in the company that redefined how the world watches entertainment.
Founded in 1997 by Reed Hastings and Marc Randolph, Netflix began as a DVD rental service that delivered movies by mail. At one point, they even tried to sell the company to Blockbuster for a $50 million deal that was famously rejected. Today, Netflix is worth over $250 billion, employs more than 13,000 people, and is headquartered in Los Gatos, California.
Much of the recent excitement is due to Netflix’s strong financial performance. The company has over 270 million paid subscribers globally, and unlike many of its streaming rivals, it’s turning a profit. In its most recent earnings report, Netflix posted over $9.9 billion in revenue, a 28% operating margin, and more than $2 billion in free cash flow. A recent crackdown on password sharing helped convert millions of freeloaders into paying customers, boosting revenue even further.
Let me hit you with a jaw-dropper…
Netflix isn’t just a streaming service — it’s a wealth machine that’s turned more than a few average Joes into millionaires. If you had the vision to toss just $2,020 into $NFLX back in 2005, you’d be sitting on a cool $1 million today. That’s not hype. That’s a real 49,590% return. Go ahead read that again.
This stock went from mailing DVDs to conquering global entertainment, and now it’s sitting pretty with a $520 billion market cap. It’s one of the most valuable businesses on the planet, and it earned every penny.
What many people don’t realize is how deeply Netflix relies on data and technology to drive its business. Years before artificial intelligence became a buzzword, Netflix, like VantagePoint, was ahead of the rest and using machine learning. Netflix however used it to recommend content, choose thumbnail images, and even decide which shows to greenlight.
Another surprising fact: Netflix runs on Amazon Web Services, the very same platform that powers its competitor, Prime Video. And while most viewers notice what’s on screen, few know about “Chaos Monkey,” a tool Netflix created that randomly shuts down its own servers to test system resilience. It’s part of what makes their service so reliable.
Now, Netflix is setting its sights beyond passive streaming. It’s building out Netflix Games, a mobile gaming platform that ties into popular franchises. This push into interactive content could be its next big growth engine. In addition, its ad-supported subscription tier, launched recently, is gaining momentum and attracting major brand advertisers.
Of course, no business is without risk. The biggest challenge for Netflix is staying ahead of a growing number of competitors while continuing to produce hit content that keeps subscribers engaged. If it stumbles on content, users can quickly churn to another platform. Also, expanding in regions like Europe and Asia brings regulatory and cultural hurdles.
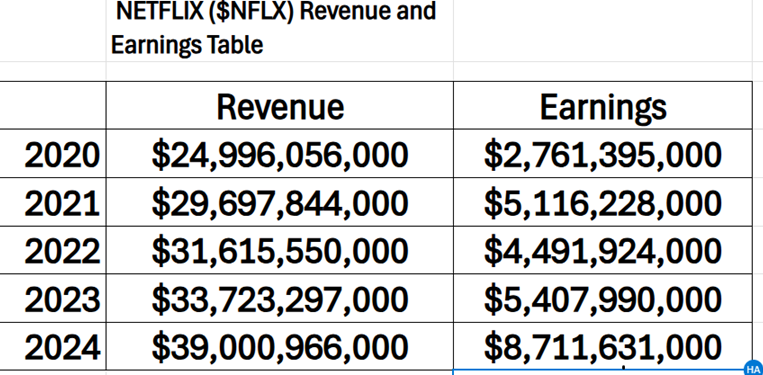
When we study the revenue and earnings growth for $NFLX we see increasing revenue accompanied by increased earnings. Over the last 5 years revenue has grown 56% while earnings have increased 215% in the same time frame.
Still, the leadership team — now led by co-CEOs Ted Sarandos and Greg Peters — is focused and experienced. Sarandos continues to oversee content strategy, while Peters, who came from the operations side, is helping scale the platform globally. Together, they’re executing on a strategy that balances creativity with business discipline.
Netflix isn’t just big — it’s enormous, and prints money like a casino on payday. With over 270 million subscribers, this beast is pulling in nearly $39 billion a year, up 16% from last year and six times what it made a decade ago. Margins? Fat. Projected at 29% in 2025. Free cash flow? Gushing. And they’re squeezing even more juice from the same orange with modest price hikes, a booming ad-supported tier, and a clever crackdown on password moochers. The analysts are eating it up, raising price targets to $1,500 and beyond. They see upside. Serious upside.
But let’s not kid ourselves, this rocket isn’t risk-free. At 43× forward earnings, you’re not getting this stock on clearance. Netflix is trading at a premium, and it better keep the hits coming or the market will turn on it like a bad sequel. Competition is fierce, content costs are rising, and every streaming wannabe wants a piece of the throne. Still, with that kind of scale, brand power, and revenue diversity, Netflix isn’t just another tech stock — it’s the real deal. If it keeps executing like this, it might just be one of the few left standing when the credits roll.
Netflix isn’t just a streaming company anymore. It’s a global entertainment and technology platform. As it continues to grow its revenue streams and expand its influence into gaming and advertising, Netflix is once again proving that it’s not just a leader in streaming, it’s a leader in what comes next.
In this stock study, we’ll analyze the key indicators and metrics that guide our decisions on whether to buy, sell, or stand aside on a particular stock. These inputs serve as both our framework and behavioral compass, rooted in data and powered by predictive intelligence.
- Wall Street Analysts Ratings and Forecasts
- 52-Week High and Low Boundaries
- Best-Case / Worst-Case Scenario Analysis
- VantagePoint A.I. Predictive Blue Line
- Neural Network Forecast (Machine Learning)
- VantagePoint A.I. Daily Range Forecast
- Intermarket Analysis
- Our Suggestion
While our decisions are ultimately anchored in artificial intelligence forecasts, we briefly review the company’s fundamentals to better understand the financial environment it operates in. For $NFLX, this context helps us assess the quality of the A.I. signal within a broader economic and industry backdrop.
Wall Street Analysts Forecasts
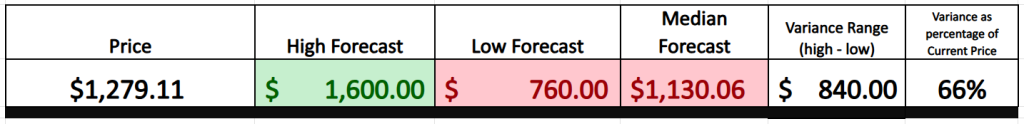
Wall Street’s been running the numbers, and here’s the deal: 38 analysts threw their hats in the ring over the past 3 months, and the average price target for $NFLX is $1,130.06. But don’t miss the bigger picture… the high-end forecast? $1,600. That’s a serious payday. On the low end? $760, which still ain’t a disaster if you’re in early. Bottom line — Netflix is walking the tightrope between greatness and gravity, and smart money is still leaning bullish.
We advise traders to pay close attention to the variance between the most bullish and most bearish forecasts. This provides us with an outline of the expected volatility moving forward. This range at present is $840 or 66% of the current price. This level of volatility is exceptionally high.
52 Week High and Low Boundaries
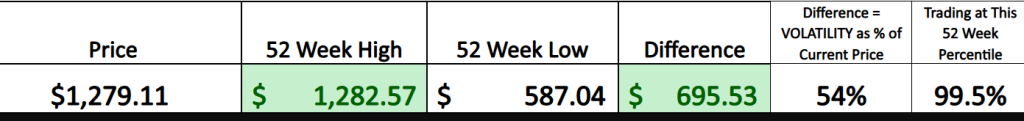
As of today’s trading, the 52-week high for Netflix ($NFLX) was made on June 5, 2025, when the stock peaked at $1,282.57. Conversely, the 52-week low occurred at $587.04, on August 5, 2024, marking the floor for the past year’s range.
This matters more than chart patterns or pundit tweets. Those 52-week high and low prices? Think of them as the iron bars of a cage that contain everything the stock has endured in the past year — freak-out dips, wild rallies, all of it. Hit a new high? That signals breakout strength — bullish pressure, momentum, and possibly institutional interest. Lick the 52‑week low? That’s panic central — the point where sellers lost their nerve, and buyers may start sniffing value.
The width of that range is your volatility meter. A tight range suggests calm; a wide one screams “big swings” — which means bigger risks and opportunities for scalpers and breakout plays. By tracking how the stock behaves around these boundaries — retesting highs, bouncing off lows — you’re not guessing. You’re watching emotional battle lines drawn in price. That’s where rational strategy and real-time profit potential live.
In short: these aren’t just numbers, they’re the battlefield. Master them, and you’ll see the true character of a stock, not the spin.
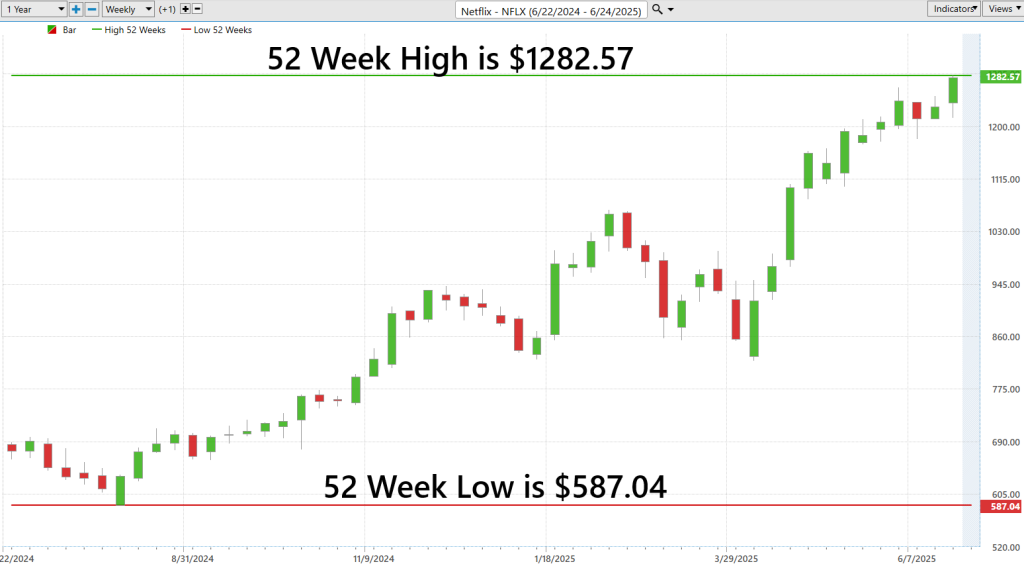
The 10-year chart of Netflix ($NFLX) tells a remarkable story — a story of resilience, reinvention, and strategic clarity. Let’s be clear: this isn’t just a routine technical breakout. It’s a reflection of a seismic shift in how America consumes media. Netflix is leading that transformation, and now we’re seeing the stock surge to fresh all-time highs. In this market, price action is truth, and the message here is loud and unmistakable capital is flowing in, and for good reason.
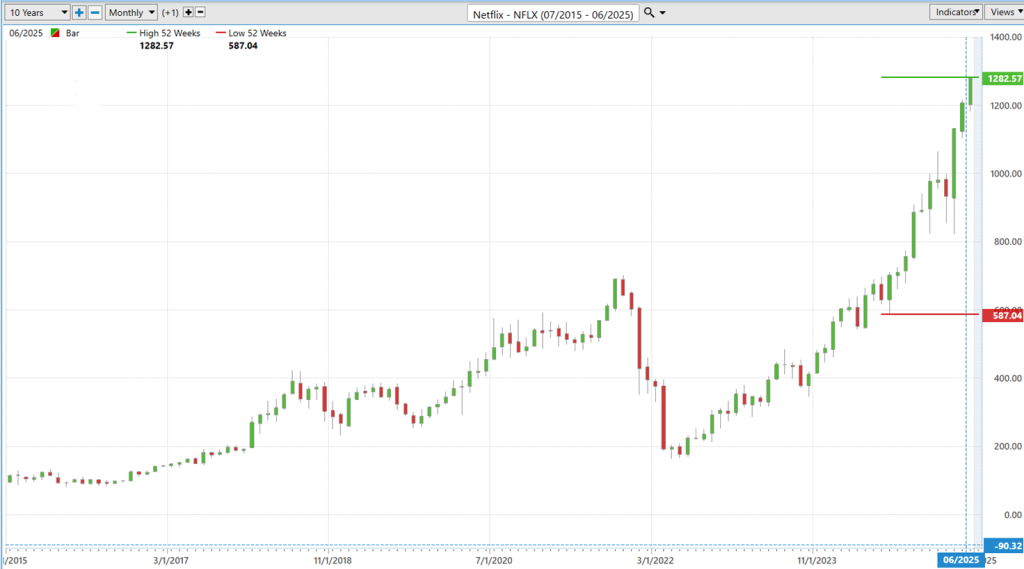
What makes $NFLX so compelling right now is that it’s punching through both its 52-week and 10-year highs simultaneously. This is institutional capital waking up to the fact that Netflix has entrenched itself as a global media powerhouse. It’s being rewarded for disciplined execution, expanding profit margins, and a bold vision for the future of entertainment. This move is real and it’s just getting started.
Best-Case/Worst-Case Scenario Analysis
Here’s a reality every seasoned investor confronts sooner or later: the market doesn’t behave — it reacts. Often violently. And at the center of that reaction is volatility, the force that drives not just prices, but behavior. Most traders would rather ignore it, dismiss it, or overcomplicate it. But those who truly study its patterns are the ones who manage to stay in the game when everyone else is forced to fold.
Before allocating capital to any stock, there’s a fundamental question that must be answered: How volatile is it? Not in abstract terms. Not buried in equations or academic jargon. But in plain historical context. Look at the last 52 weeks. Measure the extremes — the highs and the lows. That range tells you more about the market’s temperament than any spreadsheet ever could. And if the underlying thesis — geopolitical tailwinds, recurring revenue, strategic positioning — is still intact, then the past doesn’t just inform the present; it contextualizes it. In a world where misplaced optimism can be financially fatal, understanding how far a stock can swing is not just smart — it’s survival.
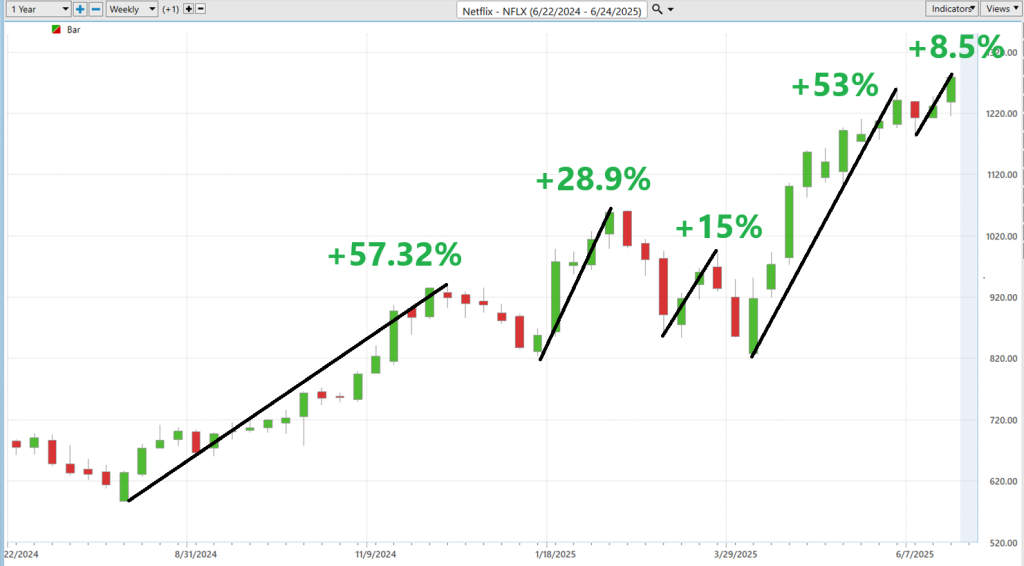
First, we look at the best case scenario by measuring the magnitude of rallies.
Followed by the worst-case scenario where we measure the severity of the declines.
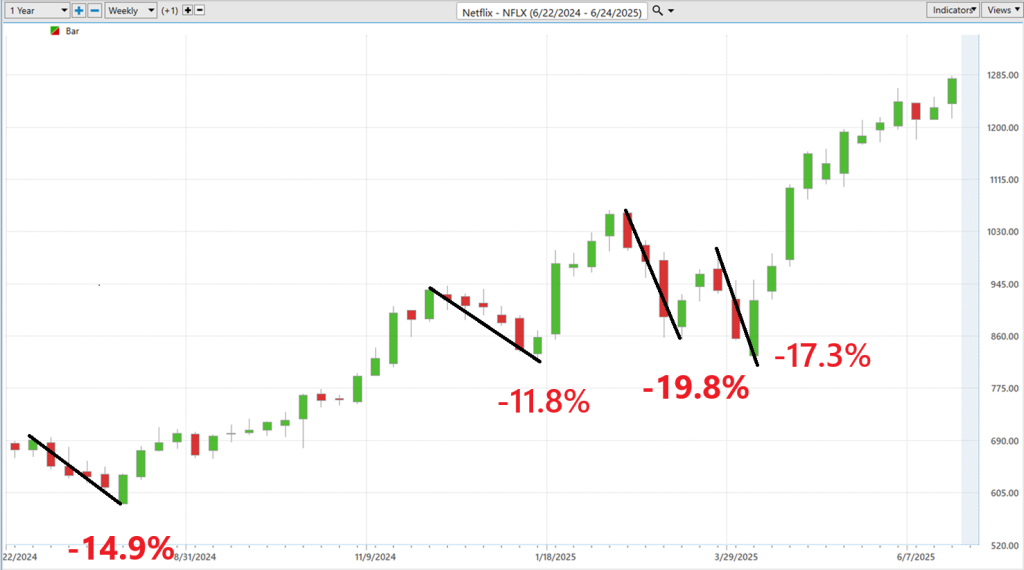
Here’s the bottom line: if you can read just two key charts, you’ll gain a meaningful understanding of the risk-reward profile behind trading Netflix ($NFLX). It’s not about prediction — it’s about consistency and preparation.
Forget the noise. Forget the commentary dressed up as wisdom. What matters is data — real, visual evidence of how this stock behaves under pressure and in momentum. No guesswork, no theatrics — just straightforward analysis that cuts to the core of what traders need to know: how this market leader moves, and what that movement means.
Next, we compare $NFLX to the broader market averages.
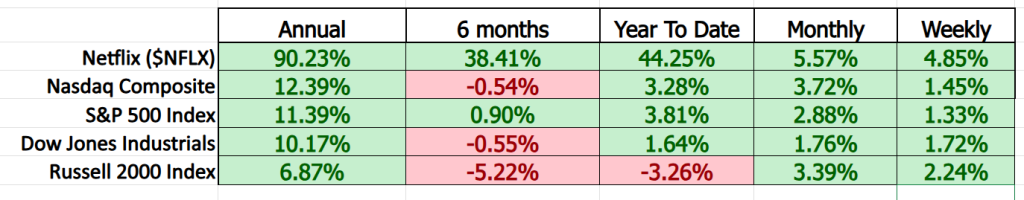
Netflix ($NFLX) is massively outperforming the broader market. The 5-year beta for Netflix ($NFLX), is 1.59.
A beta of 1.59 means Netflix tends to move about 59% more than the overall market. When the S&P 500 climbs 1%, Netflix typically jumps around 1.6% and when the market tumbles, it falls harder.
Here’s the straight take: Netflix is significantly more volatile than the broader market. It’s not some placid dividend stock — it’s a high-octane growth engine. That 1.59 beta isn’t a trivia fact — it’s a warning label and an opportunity tag rolled into one.
It tells you Netflix doesn’t just move — it dances with the market and often leads or exaggerates the steps. For portfolio architects and risk managers, that number isn’t optional — it’s foundational. Because in markets, understanding how much and often your asset moves is the difference between staying in the race and getting run over.
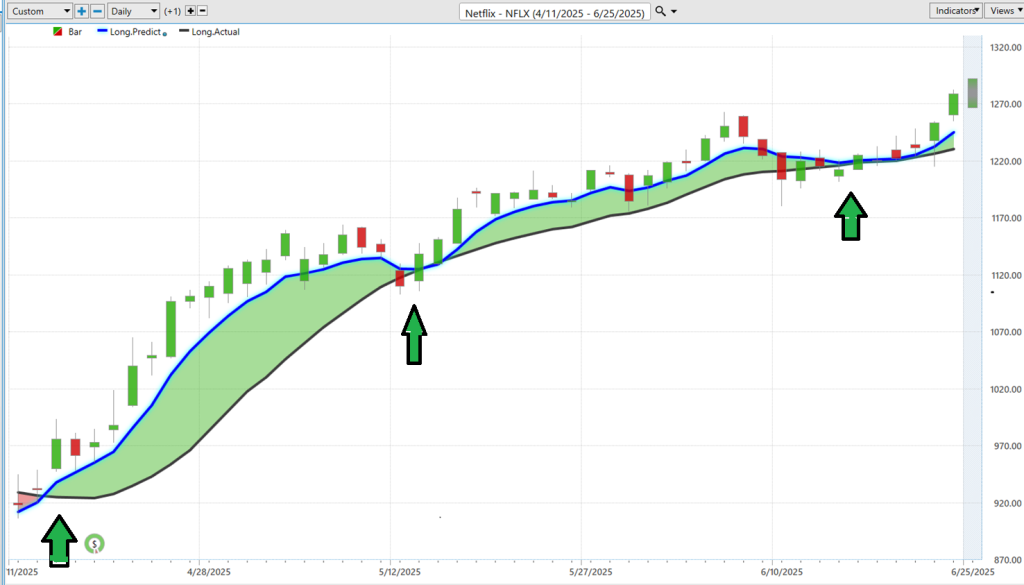
Vantagepoint A.I. Predictive Blue Line
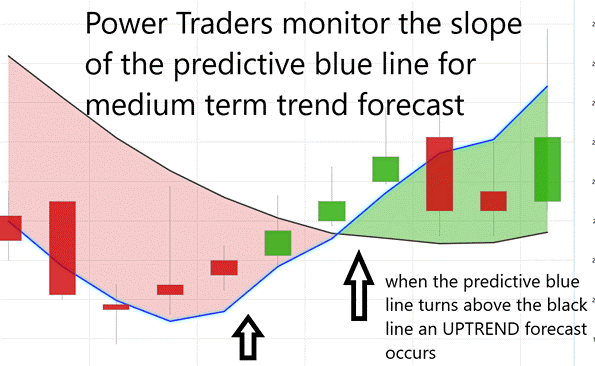
If you’re thinking about trading $NFLX, let me break it down for you — because real success doesn’t come from hype or hot takes. It comes from using smart tools backed by real data, and that’s exactly what you get with VantagePoint’s Predictive Blue Line. We’re talking about artificial intelligence with purpose — forward-looking, momentum-sensitive, and laser-focused. It cuts through the noise Wall Street throws at you and gives you a heads-up on where things might be heading before the crowd catches on.
Now, when that Predictive Blue Line starts pointing north? That’s not just a buy signal, it’s a potential tell that Netflix is gaining strength, that institutional money is walking through the front door, and the momentum is about to shift in a big way. This is the kind of early insight the pros use to position themselves — not after the move, but before it begins.
But let’s be real — when that line starts tilting down? That’s not the time to get cozy. That’s your early warning. It’s telling you to manage your risk, tighten up your stop-losses, take some profit off the table, or double-check your thesis before the market makes that decision for you.
Now let’s talk about something I always pay attention to: the Value Zone. That moment when $NFLX dips down near the Predictive Blue Line during an uptrend? Most traders see weakness. But savvy traders? We see opportunity. That’s where the smart money steps in quietly buying quality at a slight discount, while everyone else hesitates.
On the flip side — if $NFLX’s been drifting lower and then suddenly pops above the Blue Line? Might be time to pump the brakes. That’s where false rallies love to show up. It may look like strength, but beneath the surface, the momentum might not be there. You chase that move blindly, and chances are, you’re the one left holding the bag.
Bottom line? The Predictive Blue Line isn’t a gimmick — it’s an edge. It’s a tool that lets you trade with clarity, with confidence, and with discipline. And in this market? That’s exactly what separates the winners from the watchers.
Neural Network Forecast (Machine Learning
A neural network is a form of artificial intelligence designed to mimic how the human brain processes information — except it does it with vast amounts of data, lightning speed, and zero emotion. In trading, neural networks are trained on years — sometimes decades — of price, volume, and intermarket data to recognize complex patterns that lead to market moves.
Unlike traditional indicators that lag and react to price, neural networks learn, adapt, and predict. They can identify subtle correlations and non-linear relationships that human traders might miss. The result? Smarter, faster, and more accurate decision-making. Traders using neural networks are no longer reacting to what just happened — they’re anticipating what’s likely to happen next.
Imagine if you had a bloodhound — not for scent, but for profits. A relentless, razor-sharp hunting machine that doesn’t sleep, doesn’t guess, and never misses a pattern. That’s what a neural network is. It’s not hype. It’s your unfair advantage, trained on years of raw market data, engineered to sniff out reversals, breakouts, and trends before the rest of the herd even blinks.
Now, let me say something that most folks don’t want to hear: most traders aren’t really trading. They’re guessing. They’re chasing headlines, reacting to noise, and calling it “strategy.” That’s not trading. That’s gambling dressed up in a suit. And Wall Street? It loves those guys. Feeds them hope. Bleeds them dry. But if you’re tired of being a statistic, if you want to stack the odds in your favor, then you need more than gut feelings. You need data. Discipline. A system that thinks like a machine and acts with precision.
That’s where VantagePoint’s neural networks come in. This isn’t a toy indicator. It’s a potential market weapon. One that processes thousands of market relationships in real time and hands you a forecast built on cold, hard probability. It doesn’t care about politics, panic, or pundits. It only cares about the truth in the numbers.
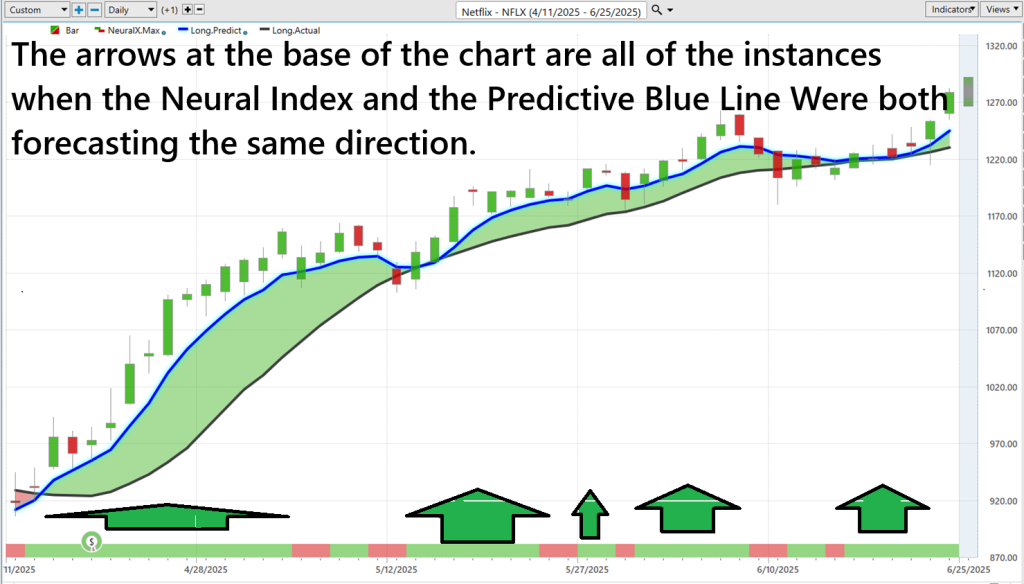
And that Neural Index? That’s your roadmap. When it turns green, you’ve got the wind at your back. Momentum’s building, and it’s time to lean in. When it turns red, you don’t argue — you adjust. You protect your gains, you control your risk, and you stay in the game.
No noise. No guesswork. Just clarity, confidence, and control — the hallmarks of every great trader who wins consistently, while the rest watch from the sidelines.
VantagePoint A.I. Daily Range Forecast
What once felt like science fiction — using predictive analytics to anticipate market direction with near-surgical precision — is quickly becoming standard operating procedure for sophisticated, data-driven traders. The landscape has changed. The tools have advanced.
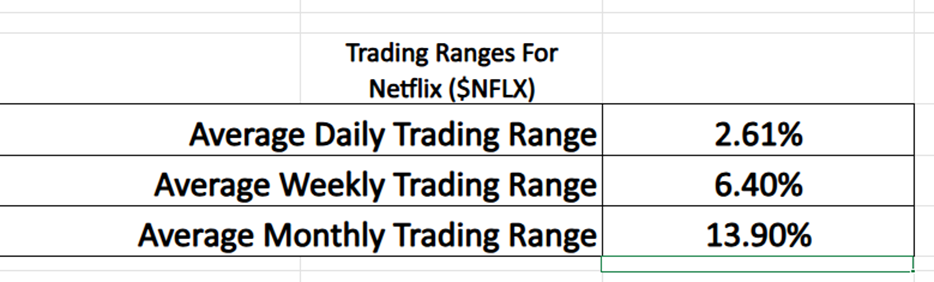
Take a broader look at $NFLX. Analyze its behavior across daily, weekly, and monthly time frames over the past year, and a compelling picture emerges. This is measured, consistent accumulation — the kind of movement that typically signals institutional positioning, not retail speculation. This is not a meme-stock story. It’s a structural move grounded in conviction.
Here are the average trading ranges for $NFLX over the past year for the daily, weekly and monthly time frames:
The truth is, volatility isn’t a problem to avoid, it’s a signal to interpret. The role of the modern trader isn’t to outguess the market’s chaos, but to navigate it with precision. That requires a system — one that adjusts in real time and transforms volatility into opportunity. Netflix has become a textbook example of how strategic traders capitalize on movement. The edge goes to those who come prepared, not those chasing momentum headlines.
This is where VantagePoint A.I. stops being some fancy gadget and starts becoming your unfair advantage. We’re talking about a real-deal weapon in a market that moves faster than most traders can blink. While the herd’s busy chasing clickbait and reacting to yesterday’s drama, this tech is already five steps ahead cutting through the noise, spotting setups, and sniffing out trades before your broker even wakes up.
Don’t take my word for it — just look at the Daily Range Forecast chart below. You’ll see exactly what happens when A.I. goes to work… and starts tilting the odds in your favor.
So take the time to examine $NFLX’s average trading ranges — daily, weekly, monthly. The insights aren’t just academic, they’re actionable. Because in this environment, data isn’t just a tool… it’s a source of competitive advantage.
Intermarket Analysis
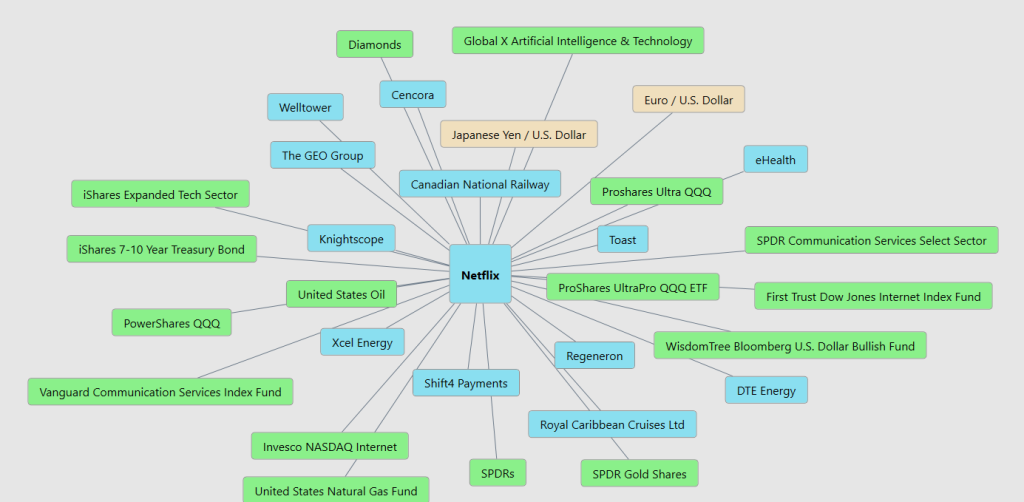
When it comes to understanding what’s driving Netflix’s stock price, most analysts toss around buzzwords and miss the bigger picture. But great investors — like great marketers — know that surface-level answers rarely lead to outsized results. To truly grasp what’s powering $NFLX to new highs, you must look beyond the obvious and decode the hidden drivers that institutional money quietly tracks: the relationship between stocks, bonds, commodities, and currencies — each one affecting Netflix’s performance in subtle but profound ways.
Let’s begin with the most obvious: the market’s appetite for risk. Netflix is no longer just a streaming service — it’s a bellwether of digital media’s future, and it trades accordingly. As tech stocks soar, especially within the Nasdaq 100, so too does $NFLX. When bond yields fall, it makes Netflix’s future earnings more valuable. And when the U.S. dollar weakens, Netflix’s international revenue — which now makes up more than 60% of total sales — gets a powerful lift. These relationships may not dominate the headlines, but professional investors know how meaningful they are to long-term valuation.
Finally, we must not ignore the fundamentals that make $NFLX such a force of nature. Subscriber growth remains robust. Its ad-supported tier is growing faster than expected. And original content — from global blockbusters to regional hits — continues to drive engagement and loyalty. Add it up and what you get is a company not just benefitting from favorable macro trends but also executing a business model that’s aligned with those very forces. That’s why smart traders don’t simply react to headlines — they look deeper, spot the convergence of intermarket currents, and position themselves early — before the next wave of momentum hits.
Here are the 31 key drivers of $NFLX price:
Our Suggestion
When it comes to leadership that leads, Netflix’s management team stands in a league of its own. In an industry littered with missteps, half-measures, and confused strategies, Netflix has quietly built an empire by doing three things masterfully: listening to the market, adapting before anyone else, and executing with relentless discipline. Their recent earnings calls — Q4 2024 and Q1 2025 — don’t just confirm it, they showcase a case study in strategic brilliance. The introduction of their $7.99 ad-supported tier? It wasn’t just a pricing move — it was a market jujitsu maneuver. Over 55% of new users in top markets are coming in through this tier, allowing Netflix to expand reach without sacrificing premium pricing power. At the same time, advertisers are lining up — because Netflix built the ad-tech stack before they turned on the faucet. Now they have engagement metrics most networks dream of: over two hours of daily watch time per user. That’s not a stat, that’s leverage.
Where others guess, Netflix measures. Their content isn’t just a cultural juggernaut — it’s engineered to be. Using precision data and global insights, they’re creating megahits like Squid Game Season 2, Carry-On, and Six Triple Eight, not by accident, but by design. From Brazil to Korea, Netflix speaks the local language — not just with subtitles, but with production dollars. And the addition of live events like the Jake Paul vs. Mike Tyson fight or exclusive NFL broadcasts? That’s not chasing trends. That’s capturing both the binge-watcher and the casual fan. It’s a model built not just to acquire users but to retain them — and advertisers are taking note. Every dollar they spend is backed by attention, not just impressions. And that’s why advertisers keep coming back.
Here’s the unvarnished truth: while other streamers spend billions just to stay afloat, Netflix is compounding strength. With a global footprint in over 190 countries, a product that resonates in multiple languages, and a churn rate competitors would kill for, the company is not merely growing — it’s scaling with surgical precision. Sarandos, Peters, and Neumann aren’t throwing darts at a board. They’re playing chess on a global scale, with every move aligned to grow subscribers, deepen loyalty, and monetize attention. The streaming wars may rage on, but if you’re keeping score by profitability, cultural relevance, and global staying power — Netflix isn’t just ahead. They’re rewriting the rules of the game.
Place $NFLX on your trading watchlist.
We think it will create numerous trading opportunities in the months ahead.
Use VantagePoint’s A.I. Daily Range Forecast for guidance.
It’s Not Magic.
It’s Machine Learning.
Disclaimer: THERE IS A HIGH DEGREE OF RISK INVOLVED IN TRADING. IT IS NOT PRUDENT OR ADVISABLE TO MAKE TRADING DECISIONS THAT ARE BEYOND YOUR FINANCIAL MEANS OR INVOLVE TRADING CAPITAL THAT YOU ARE NOT WILLING AND CAPABLE OF LOSING.
VANTAGEPOINT’S MARKETING CAMPAIGNS, OF ANY KIND, DO NOT CONSTITUTE TRADING ADVICE OR AN ENDORSEMENT OR RECOMMENDATION BY VANTAGEPOINT AI OR ANY ASSOCIATED AFFILIATES OF ANY TRADING METHODS, PROGRAMS, SYSTEMS OR ROUTINES. VANTAGEPOINT’S PERSONNEL ARE NOT LICENSED BROKERS OR ADVISORS AND DO NOT OFFER TRADING ADVICE.

