This week’s ai stock spotlight is Nvidia ($NVDA)
The most valuable company in the world today doesn’t make phones, doesn’t run a social network, and doesn’t sell you toilet paper by drone. No — it’s a company that makes chips. Not the crunchy kind. The kind that power artificial intelligence, video games, self-driving cars, and tomorrow’s weaponized algorithms. That company is NVIDIA. Founded in 1993 by Jensen Huang and two co-founders with a $40,000 check and a dream, NVIDIA has bulldozed its way from niche graphics card maker to A.I. kingmaker.
Traders, here’s the meat of it: as of today, $NVDA commands a market cap north of $4.1 trillion — more than $AAPL, more than $MSFT. Their revenue isn’t just coming from gaming anymore. Nope. They’ve got four core segments now: Gaming, Data Center (their cash-printing machine), Professional Visualization, and Automotive. In their latest fiscal year, the Data Center segment alone grew over 400% year-over-year, powered by demand for A.I. chips like the H100. If you’ve got even half a pulse, you know this isn’t just another tech story — this is a full-blown financial revolution.
This is a stunning American success story. NVIDIA, a company born in the heart of Silicon Valley, didn’t just ride the wave of the tech boom — they built the wave. And while Wall Street pours its billions into A.I., NVIDIA stands at the epicenter. Traders should take serious note of how this company seized the moment — strategically — with years of R&D, dominance in GPU computing, and a loyal developer base through CUDA. That’s not luck, folks — that’s deliberate, long-term thinking in a world increasingly short-sighted.
But let’s be honest — this isn’t all sunshine. There are real risks here. China export restrictions, supply chain reliance on Taiwan’s TSMC, and increasing competition from AMD and Intel are pressure points. And don’t forget the cyclical nature of the semiconductor industry. What goes up, often corrects. But for now, NVIDIA’s execution — and its towering lead in AI hardware — has given it a powerful economic moat. And frankly, that’s something most companies can only dream of.
You want to talk about performance that commands attention? NVIDIA has outpaced the S&P 500 by more than 250% in just the last year alone. That’s not just a beat — that’s a stomp. While the broader market wrestles with inflation fears and rate uncertainty, NVDA just keeps stacking wins. They’re not just a stock anymore — they’re an economic barometer for A.I., innovation, and for where the smart money is going. The stock isn’t cheap, but name one revolutionary company that ever was.
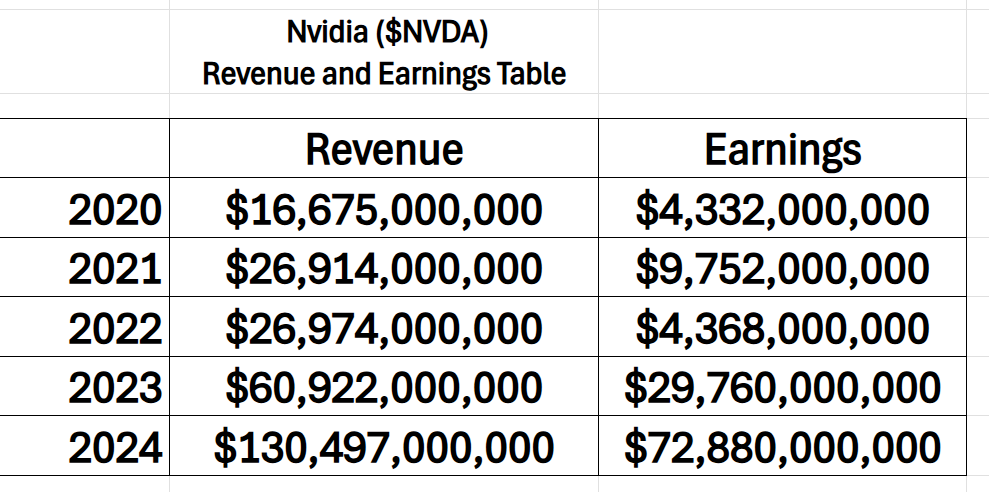
You want to know what real power looks like? Take a look at $NVDA — in just four years, they jacked revenue by 683%, but the real story is the 1,582% explosion in earnings. That’s not linear growth — that’s controlled detonation, the kind of financial supernova that turns traders into millionaires and competitors into footnotes. You don’t see this kind of curve unless a company hits the economic jackpot — and NVIDIA just cashed in.
Now here’s where most traders miss the boat. It’s not just about chips — it’s about ecosystems. NVIDIA built CUDA, which gives developers the tools to build their platform. That’s like owning the road and the cars. Add in their software stack — from A.I. frameworks to digital twin simulations — and you realize this isn’t a commodity chipmaker. It’s a platform company. That’s why the big money is still coming in, and why you need to understand the full picture. It wasn’t luck. It wasn’t timing. It was relentless execution, betting big on AI when the rest of the market was still ogling smartwatches. Huang didn’t just build faster GPUs — he built the infrastructure for the A.I. economy. And he did it while competitors played catch-up or floundered in bureaucracy. Want to know how they became the biggest? They solved the hardest problems in the biggest markets.
And earnings calls? Traders, if you’re not listening to those, you’re skipping class and copying the wrong homework. Last quarter, Jensen Huang didn’t mince words. He called this the start of a new industrial revolution. Think about that. Not hype — a declaration. Revenue? Up. Margins? Expanding. Guidance? Raised. Management sees more demand than they can handle — and that’s a good problem. But Huang also flagged China as a wild card and mentioned the need to diversify supply chains. He’s not asleep at the wheel.
It’s clear: NVIDIA’s leadership is in a class of its own. While other chipmakers are trimming headcount or warning about softness in PC demand, NVIDIA is building the infrastructure for the global A.I. economy. Their earnings calls are direct, confident, and rooted in real, observable execution. They’re not selling dreams — they’re delivering numbers. And investors, rightly, are rewarding them with a sky-high valuation. But they’ve earned that premium. No gimmicks. Just strategy and delivery.
And yet — caution remains critical. You can’t ignore the geopolitical tensions between the U.S. and China. A major chunk of NVIDIA’s revenue comes from Asia. Any escalation could restrict chip exports, hit demand, or create logistics issues. Combine that with supply dependence on TSMC — based in Taiwan — and you’ve got a macroeconomic time bomb that could dent even the best execution. So, while NVIDIA is a leader, it’s not bulletproof.
Now, if you’re wondering whether it’s too late to buy — here’s the deal: traders don’t chase price, they chase strength. And NVIDIA is still showing relative strength across every major time frame. New 52-week highs, institutional inflows, strong EPS growth — it’s all there. The stock is holding support even when the broader market chops sideways. That’s leadership.
That’s a signal. If you’re serious about finding winners, you don’t ignore this kind of dominance.
The real question now isn’t whether NVIDIA will continue growing — it’s whether regulators, competitors, or macro headwinds can slow its momentum. And even then, we’re not betting on a crash — we’re watching for the next high-probability pullback to ride the trend higher.
Traders must remain tactical. Watch the guidance language. Track margin trends. Monitor updates from TSMC. And stay alert for headline risk out of Asia. But until the chart says otherwise, NVIDIA remains not just a stock, but a symbol — of what happens when technical leadership meets visionary management and global demand.
And as the A.I. revolution deepens, remember this: NVIDIA is not just providing parts — they are architecting the digital brainpower of the modern world. Whether you’re trading short-term catalysts or investing in the decade-long megatrend, you can’t ignore a company this central, this dominant, and this embedded into the infrastructure of the future.
They’re reshaping industries, setting new standards, and capturing the lion’s share of value in one of the fastest-growing sectors on the planet. Traders, this is a company you study, not just for potential trades, but for how modern leadership, innovation, and execution come together. If A.I. is the new oil, NVIDIA is the pipeline.
In this stock study, we’ll analyze the key indicators and metrics that guide our decisions on whether to buy, sell, or stand aside on a particular stock. These inputs serve as both our framework and behavioral compass, rooted in data and powered by predictive intelligence.
· Wall Street Analysts Ratings and Forecasts
· Best-Case / Worst-Case Scenario Analysis
· VantagePoint A.I. Predictive Blue Line
· 52-Week High and Low Boundaries
· Neural Network Forecast (Machine Learning)
· VantagePoint A.I. Daily Range Forecast
· Intermarket Analysis
· Our Suggestion
While our decisions are ultimately anchored in artificial intelligence forecasts, we briefly review the company’s fundamentals to better understand the financial environment it operates in. For $NVDA this context helps us assess the quality of the A.I. signal within a broader economic and industry backdrop.
Wall Street Analysts Forecasts
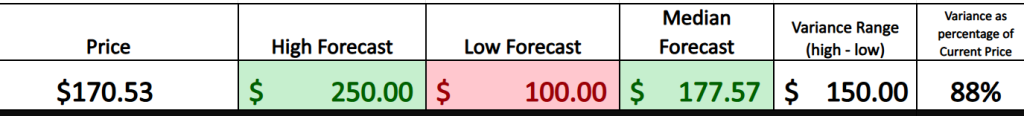
Currently, 41 Wall Street analysts are covering NVIDIA ($NVDA), with a median 12-month price target of $177.57, a high estimate of $250.00, and a low target of $100.00.
With $NVDA trading at $170.53, this gives us a forecast range of:
· +46.6% upside to the high target
· -41.4% downside to the low target
· That’s an 88% total range, a significant spread that implies elevated forward volatility and divergent opinions on valuation.
This wide range tells traders a lot. A tight forecast band would suggest stability and consensus. This isn’t that. Instead, analysts are split — some see another leg up in A.I.-fueled dominance, others are clearly concerned about overextension or macro-driven risk.
Wall Street isn’t guessing here. These targets reflect around-the-clock recalibration based on earnings momentum, macro trends (rates, inflation, chips act), sector competition (AMD, INTC), and company guidance.
While traders shouldn’t blindly trade analyst targets, they serve as a baseline of institutional sentiment. Think of them as the consensus map — and your edge comes from knowing when and why reality starts to deviate from that map.
Key insight: At $170.53, NVDA is trading just below the $177.57 median, suggesting the stock isn’t considered overheated by consensus — and still has ~4.1% upside before reaching the midpoint of analyst expectations.
This matters now. In a choppy tape, stocks with institutional tailwinds and volatility-fueled price dispersion can offer tactical swing and breakout setups. $NVDA fits that profile — especially for traders watching key levels and earnings catalysts
52 Week High and Low Boundaries
Alright traders, gather ‘round — because this is the kind of data that moves money.
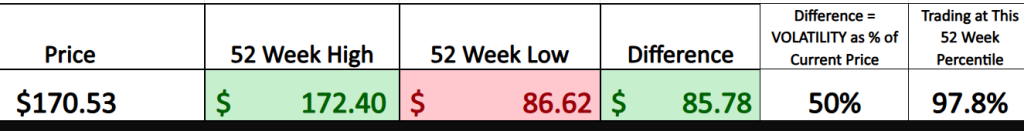
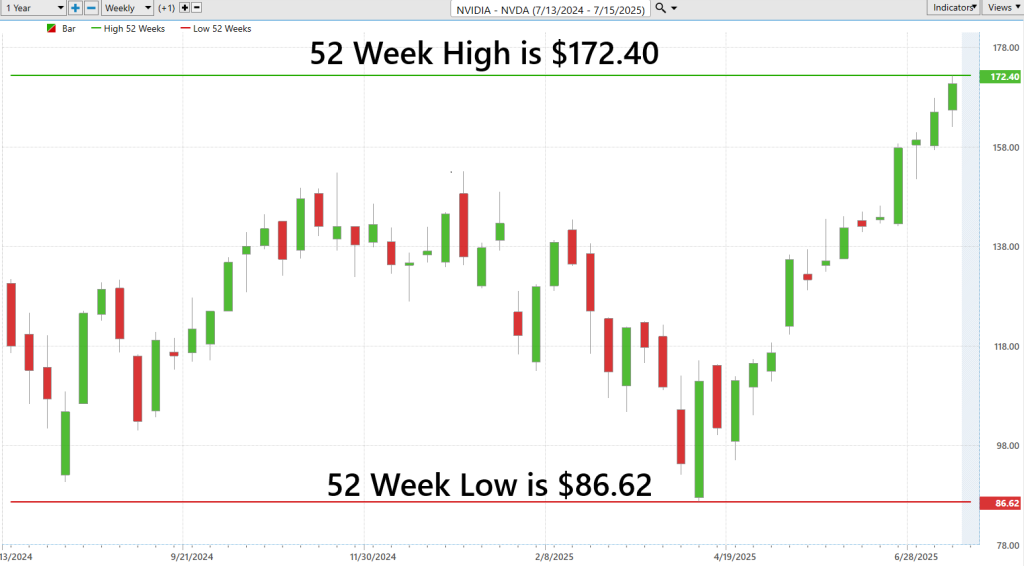
You’re looking at NVIDIA ($NVDA) trading at $170.53, just a stone’s throw away from its 52-week high of $172.40. That’s 97.8% of the way to the top, meaning it’s hugging the ceiling — and that’s no accident. The 52-week low? $86.62. That gives us a jaw-dropping annual trading range of $85.78, or about 50% of the current price.
Let that sink in. This isn’t some sleepy utility stock. This is a rocket that’s already cleared the launch pad and is eyeing orbit. A 50% historical volatility profile means the market has been throwing real haymakers for the last year—and Wall Street analysts, with targets ranging from $100 to $250, are bracing for more action ahead.
So, what do you do with this?
You pay attention.
Because when a stock is pressing up against its 52-week high — especially one with this kind of volatility — it’s a signal. Not a guarantee. Not a prediction. But a signal. It tells you that buyers are in control, momentum is building, and the stock is testing the outer edge of what the market has priced in so far.
Traders love the 52-week range because it’s pure — no fluff, no manipulation. It’s the high-water mark of price discovery over the last year. And when a stock like $NVDA starts knocking on that door, you better believe smart money is watching for a breakout or a reversal.
The takeaway?
Don’t trade blind. Use the 52-week range like a volatility compass to measure risk, spot pressure zones, and line up trades that align with what the market has already told you loud and clear.
And right now? It’s saying $NVDA is hot, volatile, and pushing for new highs.
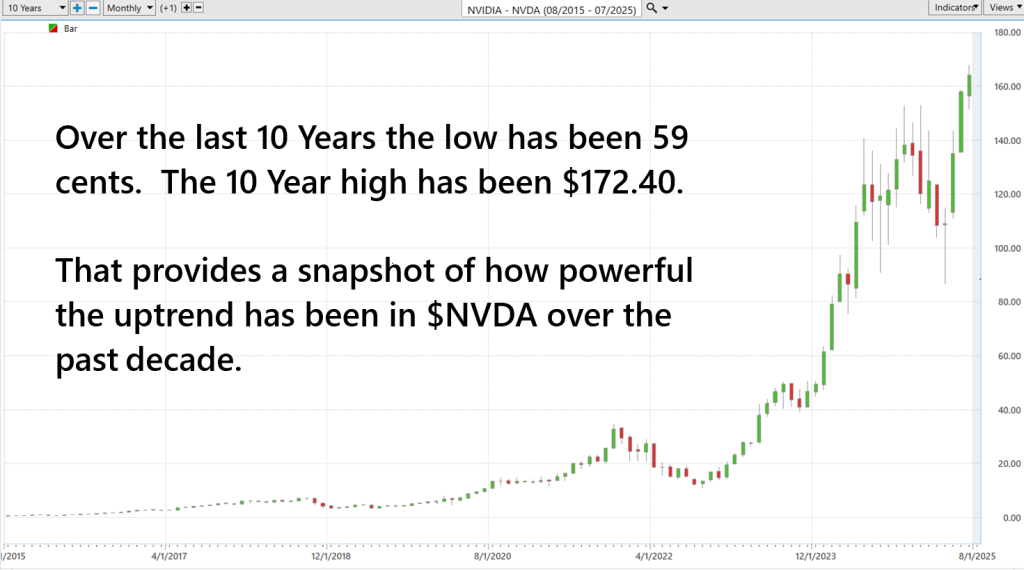
What makes this trend even more fascinating is by zooming out and look at the 10-year trajectory. If you invested just $5,864.50 in NVDA at $1.00 per share over the past decade, that stake would be worth $1,000,000 today.
That’s the power of exponential growth and why traders watch for the next $NVDA like hawks.
Best-Case/Worst-Case Scenario Analysis
Look — the market’s a beast. It doesn’t purr, it growls. And volatility? That’s the bite behind the bark. Most traders either ignore it, drown in it, or pretend they’re smarter than it. But the real players — the ones still standing when the smoke clears — they respect the swing.
This analysis? It strips away the fluff. No guru gibberish. No ten-thousand-word treatises. Just one dead-simple question: How far can this stock really move — up or down?
We’re talking 52-week reality here. Measure the highest highs and the gut-punch lows. That’s your battlefield. Because before you commit a single dollar to a trade, you better know the terrain.
This isn’t about predicting the future — it’s about bracing for it. If NVIDIA ($NVDA) can rocket 80% or crater 40%, that’s not noise — that’s gospel. It’s your cheat code to understanding risk, reward, and everything in between.
The problem this kind of analysis solves? It kills delusion. It gives traders a brutal, unvarnished look at what they’re walking into — not with theories, but with evidence. And in this game, the ones who last aren’t the lucky or the loud — they’re the ones who prepare and trade with their eyes wide open.
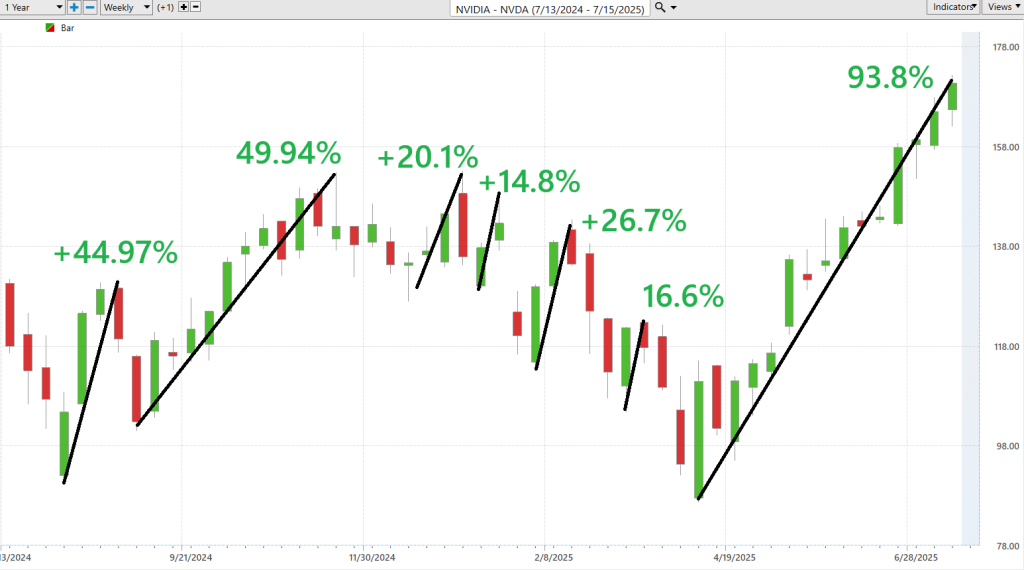
First, we measure the largest uninterrupted rallies to get an idea of the opportunity of trading $NVDA.
Next, we measure the magnitude of the largest uninterrupted declines to get insight on the risk associated with trading $NVDA.
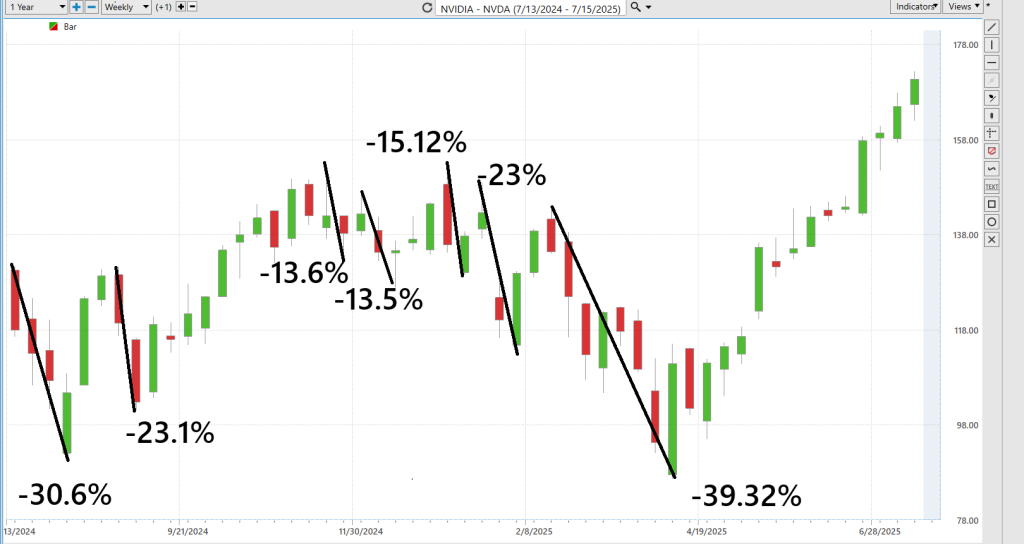
What we’re witnessing in NVIDIA’s ($NVDA) price action over the past year is a masterclass in volatility-driven opportunity — and risk. The stock has endured brutal pullbacks of up to -39%, only to roar back with recoveries as large as +93.8%, underscoring
a market environment where the extremes aren’t outliers — they’re the norm. For traders, this chart isn’t just a historical reference — it’s a real-time reminder that navigating A.I.-fueled momentum stocks requires both conviction and the discipline to survive the swings.
Next, we compare the performance of $NVDA to the broader stock market indexes.
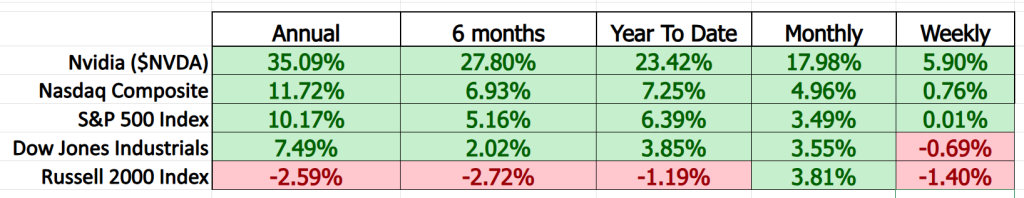
NVIDIA ($NVDA) isn’t just winning, it’s lapping the field.
While the Nasdaq’s crawling at +11.72% annually, and the S&P 500’s trotting in at +10.17%, NVIDIA is blasting forward with a +35.09% gain over the same period. Look across every timeframe—6 months? +27.80%. Year-to-date? +23.42%. Monthly? +17.98%. Weekly? +5.90%. Every single data point screams the same thing: outperformance.
So, what does this mean for you?
It means that $NVDA isn’t just riding the A.I. wave — it’s the wave. When you’re hunting for leadership in a choppy market, this is what it looks like: consistent strength, relentless demand, and a trend that refuses to quit. This kind of outperformance tells you smart money is still leaning hard, while the small caps (Russell 2000, anyone?) are choking on dust.
Lastly, NVIDIA ($NVDA) has a beta north of 1.5, which means it’s about 50% more volatile than the overall market — and that’s no surprise given its role at the center of the A.I. revolution. Now, what does that mean for investors and traders? It means when the market moves, $NVDA moves more — both up and down. This is a high-octane stock, not for the faint of heart. But for those seeking growth and momentum, that elevated beta is a signal of opportunity, not fear — it’s a trader’s playground and a volatility machine wrapped in silicon.
Vantagepoint A.I. Predictive Blue Line
Let me give it to you straight, my friend…
The number one reason traders lose money? They react late. They buy when it’s already too hot. They sell when it’s already too cold. They’re always one step behind, watching an opportunity pass them by like a freight train they just missed. But what if you had a a clean, honest-to-God heads-up that told you before the big moves happened?
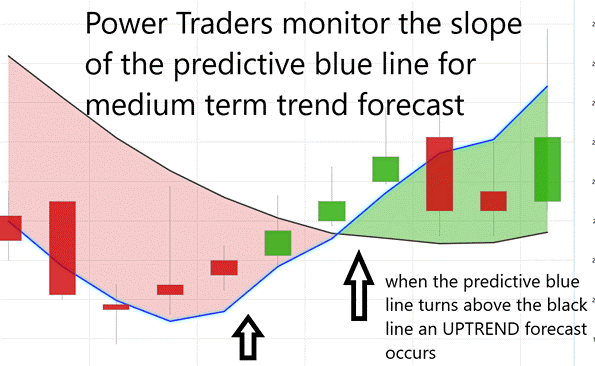
That’s what the Predictive Blue Line gives you.
This isn’t some wishful thinking or repackaged chart voodoo. This is artificial intelligence, designed to show you when momentum is about to shift. When the line turns up? It’s not hype. It’s institutional money stepping in. It’s strength rising from the inside out. And when the line starts dipping? That’s your cue to get sharp — protect profits, check your thesis, and sidestep the next blindside.
But here’s the part most traders miss — the Value Zone. That quiet moment when price pulls back to the Blue Line during an uptrend? Most amateurs flinch. But pros? They lean in. That’s where the smart money quietly accumulates, like wolves in the snow.
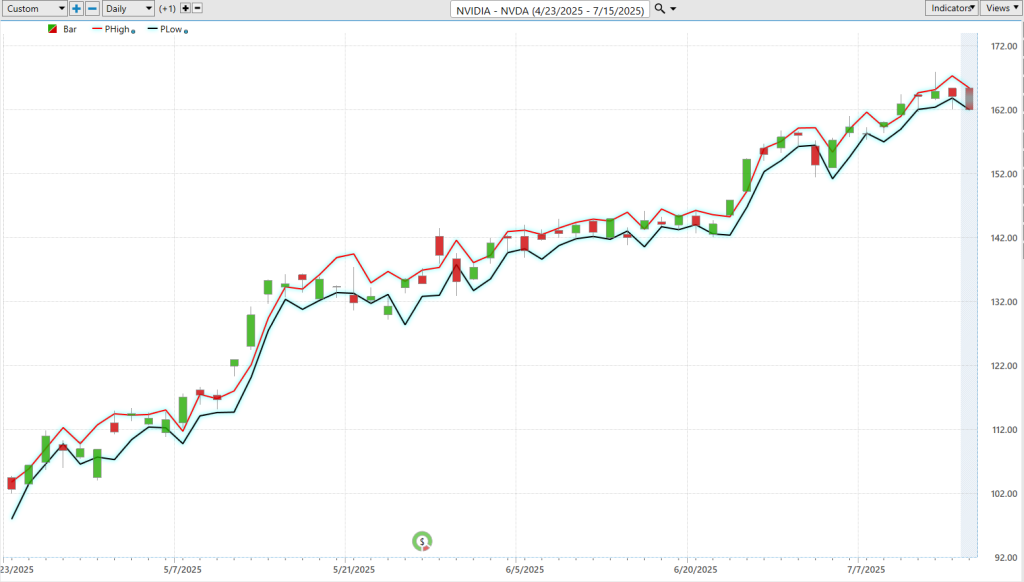
Traders often enter too late, exit too early, or get whipsawed by noise and false signals. The Predictive Blue Line powered by VantagePoint’s A.I., provides an early read on potential trend shifts — helping traders spot entries during uptrends (the “Value Zone”) and identify
possible exhaustion during fake-outs. It replaces emotional guesswork with data-backed precision, guiding smarter risk management and helping avoid the trap of chasing hype.
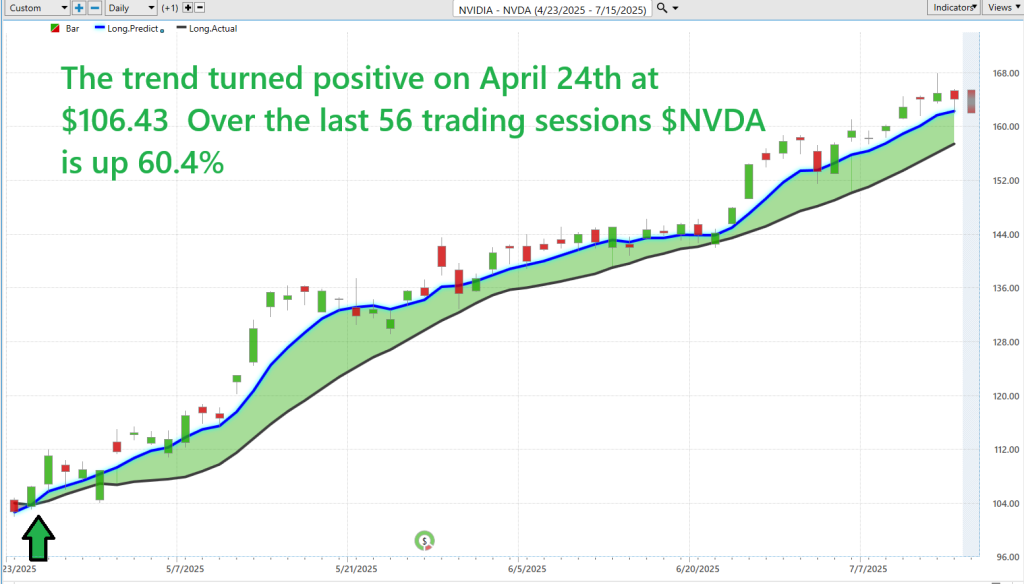
Bottom line? The Predictive Blue Line is your early-warning radar. It spots traps, identifies setups, and gives you confidence to act when everyone else is still guessing. And in this market? The only traders left standing are the ones who use tools that actually tilt the odds in their favor.
Neural Network Forecast (Machine Learning)
Well folks, here’s the truth — the markets don’t care about your feelings, and they certainly don’t wait for you to catch up. That’s why traders using neural networks aren’t sitting around reacting to the news — they’re anticipating the next move before it happens. This is artificial intelligence modeled after the human brain, but without the fear, hesitation, or fatigue that plagues so many investors.
We’re talking about machine learning systems trained on decades of price action, volume, and intermarket behavior — and they’re doing what no human can: spotting patterns in real time, adapting on the fly, and predicting what’s likely coming next. It’s fast, it’s unemotional, and it works.
And here’s something the Wall Street elites don’t want you to hear: most traders are just gambling. They chase hype, they follow noise, and they get slaughtered. But the smart money? It’s using tools like VantagePoint’s neural networks — cutting through the clutter, crunching thousands of market relationships, and delivering a forecast grounded in data, not drama.
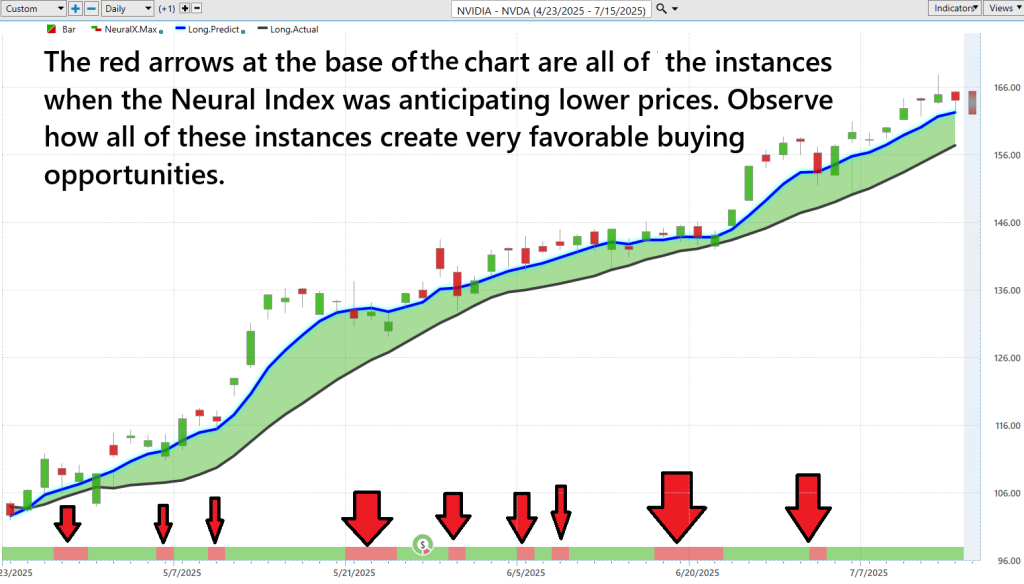
Most traders rely on outdated indicators or gut instinct — often chasing headlines or reacting after moves have already happened. Neural networks are a solution because they analyze massive datasets, detect complex patterns, and generate forward-looking forecasts with speed, precision, and zero emotion.
Bottom line? This isn’t a crystal ball — it’s a tactical advantage. And in this market, it’s not just useful. It’s essential.
VantagePoint A.I. Daily Range Forecast
In a market increasingly driven by algorithms, cross-asset flows, and machine-learned signals, the idea of anticipating price movement with precision is no longer a theoretical edge — it’s table stakes for serious traders. The case of NVIDIA ($NVDA) is a striking example of what that new reality looks like in action.
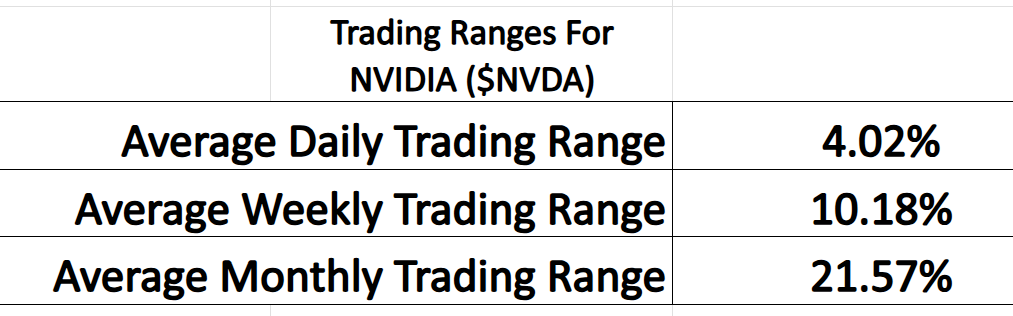
Take a step back from the headlines and look at the data. $NVDA’s average daily trading range clocks in at 4.02%, expanding to 10.18% weekly and 21.57% monthly. These are not minor fluctuations — they’re the footprints of a stock caught in the crosshairs of institutional capital, momentum funds, and macro traders seeking exposure to A.I.’s most iconic name.
The significance? This is not about retail frenzy or social media hype. This is about measured volatility — a signature of conviction-driven accumulation and calculated rotation. In a world where volatility is often dismissed as risk, $NVDA is showing us something else entirely: volatility as opportunity, engineered by forces far larger than the average investor.
Volatility isn’t the enemy, folks. It’s the market waving a flag and saying, “Opportunity’s right here — if you’ve got the guts and the game plan to go after it.” The truth is, most traders panic when things get wild. But the pros? They lean in. They don’t try to outguess the chaos — they come equipped with systems that turn that chaos into a payday.
Just look at what’s happening with NVIDIA ($NVDA). It’s the perfect case study in how smart traders ride the storm and come out stronger. And that’s where VantagePoint A.I. enters the picture. This isn’t some gimmick or dashboard fluff. It’s a serious tool for serious traders, slicing through the noise and shining a light on setups before most people even know something’s happening.
While the crowd is busy reacting to headlines and hype, this technology is already five steps ahead — identifying trends, spotting reversals, and calling the plays before the whistle blows. You want an edge? This is it.
Take a close look at NVDA’s average trading ranges — daily, weekly, and monthly. That’s not just market movement… that’s a roadmap. In a market like this, data isn’t a luxury — it’s your weapon. So arm yourself accordingly… and trade like you mean it.
Observe how clearly delineated the daily range forecast is and how effective it has been in anticipating $NVDA’s price action.
Intermarket Analysis
Imagine trying to ride a bike with one eye closed. Sure, you might stay upright for a while, but the moment something unexpected pops up — boom! You’re off balance and in trouble. That’s exactly what it’s like to trade stocks without understanding intermarket analysis. You’re not seeing the full road ahead. And if you want to ride the markets with confidence, especially a fast-moving one like NVIDIA ($NVDA), you need both eyes wide open, scanning everything.
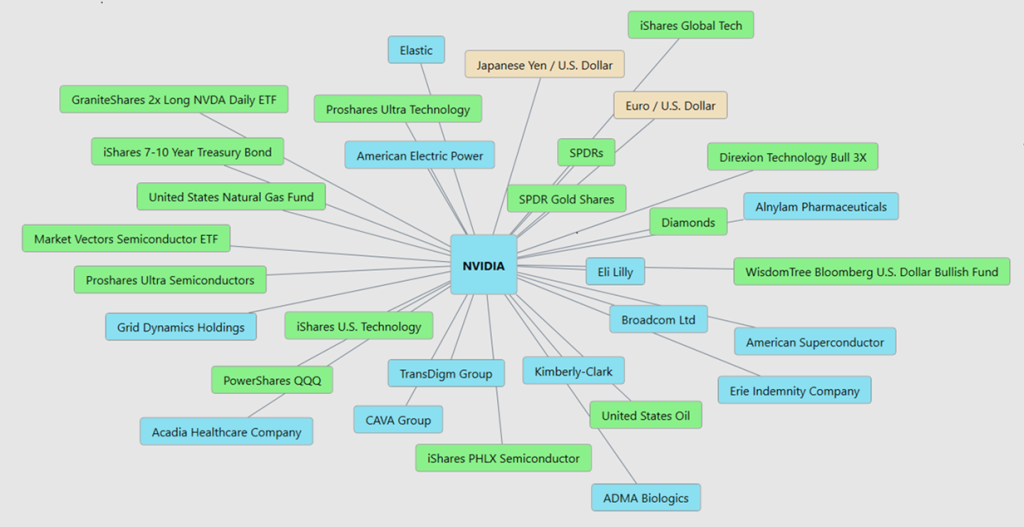
Now, here’s the magic of intermarket analysis: it lets you see how the world’s biggest markets — stocks, bonds, commodities, and currencies — are dancing together. They’re like four horses pulling one carriage. If one horse stumbles or bolts off in another direction, the whole ride gets rough. Traders who spot these shifts early can steer clear of trouble or use the shift to get ahead.
Let’s break this down: a table. A strong table stands on four solid legs — just like the market. One leg is stocks. One is bonds. One is commodities like oil or metals. And one is currencies like the U.S. dollar. If one leg weakens — say, interest rates shoot up or the
dollar falls — the whole thing wobbles. A trader with sharp eyes sees this before the table tips over… and they act.
But what does all this mean for a red-hot company like NVIDIA?
Let me tell you a secret about $NVDA — it’s not just a company. It’s a barometer for the future. When people get excited about things like artificial intelligence, robotics, self-driving cars, or the metaverse, guess what they need? Fast, powerful computer chips. And NVIDIA makes some of the best in the world.
When the world wants more A.I., $NVDA soars. When tech takes a breather, it stumbles. But here’s where intermarket analysis gives you X-ray vision…
Let’s say bond yields are jumping. That means interest rates might go up. Growth stocks like NVDA don’t like that, because future profits look less valuable when money gets more expensive. A trader using intermarket analysis sees the bond market yelling, “Hey! Risk is rising!”—before the NVDA chart turns red.
Or imagine the U.S. dollar drops in value. Suddenly, NVIDIA’s overseas sales look great, because foreign buyers can afford more. That’s good for the bottom line, and smart traders spot the opportunity before the crowd.
Or let’s say oil and metal prices skyrocket. Sounds unrelated, right? Wrong. Chips are made from rare materials and shipping them across the world takes energy. If those costs go up, NVIDIA’s profits might shrink. Intermarket analysis connects those dots while others are still watching the wrong scoreboard.
This is the kind of edge you need. Not guesswork. Not hype. Just the facts — seen through a wider lens.
Think of $NVDA like a race car. It’s fast. It’s powerful. But if the track (the market) is slick, the weather (interest rates) is turning, and the tires (commodity costs) are wearing down, it doesn’t matter how good the driver is. You need to understand the conditions, not just the car.
And here’s the real kicker — intermarket analysis doesn’t just help you avoid crashes. It helps you spot green lights. When all four legs of the table — stocks, bonds, commodities, and currencies — line up in harmony, that’s when big moves happen. That’s when traders jump in, not out.
So, whether you’re trading NVIDIA or watching the next tech breakout, never ride with one eye closed. Intermarket analysis gives you the full view. The whole playing field. The warning signs and the gold mines.
Because the market doesn’t move in a straight line. It moves like a symphony. And intermarket analysis? That’s how you learn to read the music — before the next note plays.
Our Suggestion
NVIDIA just delivered two of the most watched earnings calls in the entire market, and for good reason — when NVIDIA speaks, Wall Street listens. But it wasn’t all fireworks and fanfare this time. The tone from CEO Jensen Huang? Direct. Determined. And yes, decidedly sober.
Let’s start with the most recent quarter — ending in late April. Jensen didn’t sugarcoat it: the U.S. government’s ban on shipping high-powered AI chips to China hit hard. We’re talking about $4.5 billion in write-downs and another $2.5 billion in sales that vanished like smoke. Huang called the moment “painful,” and he’s right. But instead of panicking, he pivoted — pointing to big opportunities in places like Saudi Arabia and the United Arab Emirates. He’s betting big on America’s allies stepping up where China no longer can.
In the previous earnings call back in February, the mood was much more bullish. NVIDIA was flying high on surging demand for its Blackwell chips — chips that are powering A.I. infrastructure around the globe. Huang was on offense, not defense. But even then, the
company acknowledged one simple truth: geopolitical tensions are real, and they will impact the business.
The two biggest stories shaping NVIDIA right now are rooted in power and politics.
First, the export ban. This is about America’s dominance in artificial intelligence. Cutting China off from NVIDIA’s top-tier chips may serve national security interests, but it comes at a cost. Huang warned: locking NVIDIA out of a $50 billion Chinese A.I. market could handicap American leadership. Whether Washington listens remains to be seen.
Second, NVIDIA’s $4 trillion milestone. That’s right, folks — $4 trillion in market value. No company has ever hit that mark before. NVIDIA isn’t just in the driver’s seat — it is the road. Its chips are the backbone of modern A.I. But here’s the kicker: when you’re this big, the market expects perfection. One stumble, one misstep, and the consequences echo across the entire S&P 500.
So, what does this mean for traders?
It means you don’t ignore $NVDA. This is a market bellwether, plain and simple. If you’re not watching NVIDIA, you’re not watching the real market.
But — and I say this every time — no stock is bulletproof. Great trading requires discipline. Risk management. Stop-losses. Know your exit before you enter. Never bet more than you can afford to lose. The best traders aren’t gamblers, they’re strategists.
So keep NVIDIA on your radar. Watch the tone of management. Watch the headlines. And above all — watch how the market reacts. Because this company isn’t just building A.I. It’s building the future of the market itself.
And that, folks, is something worth paying attention to.
Use the VantagePoint A.I. Daily Range Forecast to uncover short term trading Opportunities.
Practice great money management on all your trades.
It’s not magic.
It’s machine learning.
Disclaimer: THERE IS A HIGH DEGREE OF RISK INVOLVED IN TRADING. IT IS NOT PRUDENT OR ADVISABLE TO MAKE TRADING DECISIONS THAT ARE BEYOND YOUR FINANCIAL MEANS OR INVOLVE TRADING CAPITAL THAT YOU ARE NOT WILLING AND CAPABLE OF LOSING.
VANTAGEPOINT’S MARKETING CAMPAIGNS, OF ANY KIND, DO NOT CONSTITUTE TRADING ADVICE OR AN ENDORSEMENT OR RECOMMENDATION BY VANTAGEPOINT AI OR ANY ASSOCIATED AFFILIATES OF ANY TRADING METHODS, PROGRAMS, SYSTEMS OR ROUTINES. VANTAGEPOINT’S PERSONNEL ARE NOT LICENSED BROKERS OR ADVISORS AND DO NOT OFFER TRADING ADVICE.