


This week’s ai stock spotlight is ORACLE ($ORCL)
Oracle Corporation is, in many ways, one of the great survivors of the technology age—a company that was once synonymous with legacy enterprise software but is now undergoing a calculated and aggressive reinvention. Founded in 1977 by Larry Ellison, Bob Miner, and Ed Oates, Oracle was built on the strength of its relational database software. Fast forward nearly five decades, and the company employs approximately 159,000 people globally, with its headquarters now located in Austin, Texas, a move that reflects its evolving identity in a faster, leaner, and more cloud-native future.
Today, Oracle’s ambitions are no longer centered solely around databases. Under the dual leadership of CEO Safra Catz and founder-turned-CTO Larry Ellison, Oracle is making one of the boldest pushes into cloud infrastructure and artificial intelligence among the old-guard tech giants. Their focus is two-fold: continue expanding Oracle Cloud Infrastructure (OCI), and leverage their unmatched enterprise reach to integrate AI and automation into every corner of the business software ecosystem. Their cloud product isn’t just catching up—it’s aggressively taking share, thanks to strategic partnerships with Microsoft, Google, and Amazon, a level of cross-pollination rarely seen in Big Tech.
The tone of Oracle’s last two earnings calls has been nothing short of assertive. In their Q4 FY2025 report, the company projected a future defined by hypergrowth in the cloud. OCI revenues surged 52% year-over-year, with management forecasting 40% total cloud growth in FY2026 and up to 70% growth in infrastructure. More telling was the staggering $138 billion in remaining performance obligations—essentially, signed contracts for future services. The message was unmistakable: Oracle’s cloud ambitions are not a promise—they’re already priced in. Even in Q3 FY2025, Ellison maintained a similar tone, emphasizing multi-cloud capabilities and AI integration not as future goals, but as current momentum. Oracle isn’t asking for a second chance—it’s rewriting its legacy while the ink is still wet.
The bottom line is this: Oracle is no longer a company investors can ignore. It is executing a multi-front transformation at scale—cloud, AI, enterprise SaaS—and it’s doing so with a confidence rooted in decades of market dominance and fortified by billions in guaranteed future revenue. For long-term investors and short-term traders alike, Oracle offers something few legacy firms can: the credibility of past performance, and the blueprint of a company determined to lead in the next chapter of the digital economy.
Oracle’s not your granddad’s sleepy database company anymore. The stock’s been ripping higher—up a scorching 41% year-to-date—and investors are tripping over themselves to get in. Why? One word: AI.
At the center of this excitement is talk of a massive $30 billion cloud and AI infrastructure deal. This isn’t pie-in-the-sky speculation. Analysts believe this is the kind of multiyear contract that could reshape the enterprise tech landscape. It’s likely tied to Oracle’s “Stargate” infrastructure—something insiders believe is powering none other than OpenAI and SoftBank. That’s not just a win. That’s a defining moment.
Here are the revenue and earnings figures for the last 5 years.
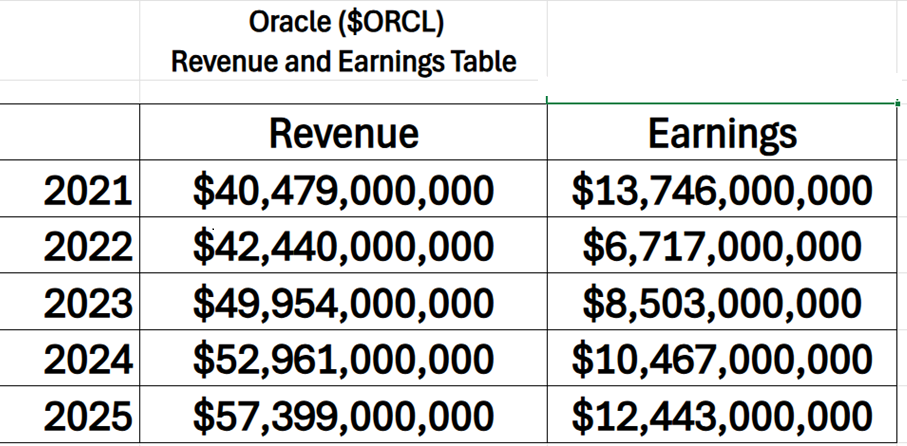
Over the past five years, Oracle’s revenue has climbed from $40 billion to $57 billion—a solid top-line growth of over 40%. But here’s the kicker: despite pulling in $17 billion more in sales, net income has actually slipped, from $13.7 billion down to $12.4 billion.
What does that mean in plain English?
It suggests the company is growing its sales but squeezing less profit out of each dollar earned. That could point to rising costs, thinner margins, or heavy investment in cloud and AI infrastructure. In other words, Oracle’s expanding, but profitability isn’t keeping pace—raising serious questions about operational efficiency and whether this growth is being bought at the expense of earnings.
And the street is piling on. Stifel has raised its target to $250. Bernstein is bullish. UBS and Guggenheim are climbing aboard. There’s a growing consensus among analysts that Oracle’s cloud business is about to enter another gear—and this time, it might just leave Amazon and Microsoft looking over their shoulders.
But—and this is important—there are storm clouds in the distance. Oracle’s been offering aggressive discounts to land deals, particularly with federal agencies. That might win contracts in the short term, but it raises red flags about margin compression. You can’t give it away forever and expect profits to magically balloon. If this is how Oracle is driving its revenue, the music could stop quicker than expected.
And that leads to the big question—how much of this growth is real, and how much is just reshuffling old business into a new wrapper? If this is fresh, organic, AI-fueled expansion, then Oracle is sitting on a rocket ship. But if it’s just a clever rebrand of legacy clients moving to the cloud with price cuts baked in, well, that’s not growth. That’s accounting theater.
Here’s the bottom line. Oracle is making a bold play to dominate the AI infrastructure game, and Wall Street’s placing their bets. But margins, earnings, and execution still matter. If Oracle can prove this surge is built on real, profitable growth, the sky’s the limit. If not, we’ll look back on this rally as one driven more by hype than horsepower.
But here’s where it gets sticky. Oracle’s been winning contracts with aggressive pricing—particularly with federal agencies. That’s great for top-line numbers, but it also raises a red flag for margins. If you’re practically giving it away to win deals, how long can that last? Skeptics are asking whether this is real growth—or just Oracle slapping a cloud sticker on old business.
Still, you can’t ignore the numbers. Oracle has quadrupled from its 2022 lows, and some analysts think we’re only halfway through the upside. If that AI/cloud deal holds water—and margins don’t cave—this stock could keep flying. But if it turns out to be smoke and mirrors? You’ll want to be the guy who bailed before the engine sputtered.
Bottom line? Oracle’s riding high on the AI wave with Wall Street behind the wheel.
In this stock study, we’ll analyze the key indicators and metrics that guide our decisions on whether to buy, sell, or stand aside on a particular stock. These inputs serve as both our framework and behavioral compass, rooted in data and powered by predictive intelligence.
- Wall Street Analysts Ratings and Forecasts
- 52-Week High and Low Boundaries
- Best-Case / Worst-Case Scenario Analysis
- VantagePoint A.I. Predictive Blue Line
- Neural Network Forecast (Machine Learning)
- VantagePoint A.I. Daily Range Forecast
- Intermarket Analysis
- Our Suggestion
While our decisions are ultimately anchored in artificial intelligence forecasts, we briefly review the company’s fundamentals to better understand the financial environment it operates in. For $ORCL this context helps us assess the quality of the A.I. signal within a broader economic and industry backdrop.
Wall Street Analysts Forecasts

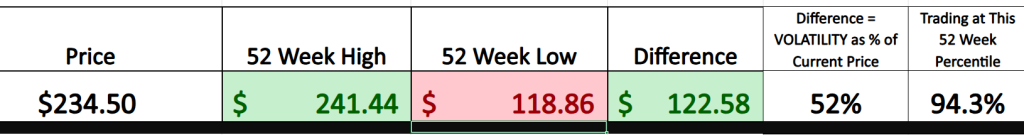
Wall Street analysts are sharply divided on Oracle’s next move. With the stock currently trading at $234.50, price forecasts range from a bullish $275 to a bearish $175, creating a wide variance of $100—a full 43% spread from top to bottom.
The median forecast sits at $220, which is actually below the current price—signaling some caution despite the stock’s strong year-to-date performance. The optimistic camp sees Oracle riding the AI and cloud momentum to fresh highs, while skeptics point to margin compression and growth quality concerns, dragging the floor lower.
This $100 variance paints a picture of uncertainty—and opportunity. It tells traders that Oracle sits at a potential crossroads, with analysts split on whether the company is leading the next tech wave or overextending on discounted deals and bold promises.
Alway pay attention to the variance between the most bullish and most bearish forecast as this metric communicates the expected volatility moving forward. Currently this variance stands at 43% which is very high.
52 Week High and Low Boundaries
Let me walk you through one of the most powerful, underrated tools in a trader’s arsenal: the 52-week range. It’s not just a number—it’s your volatility compass and trend confirmation guide, all rolled into one.
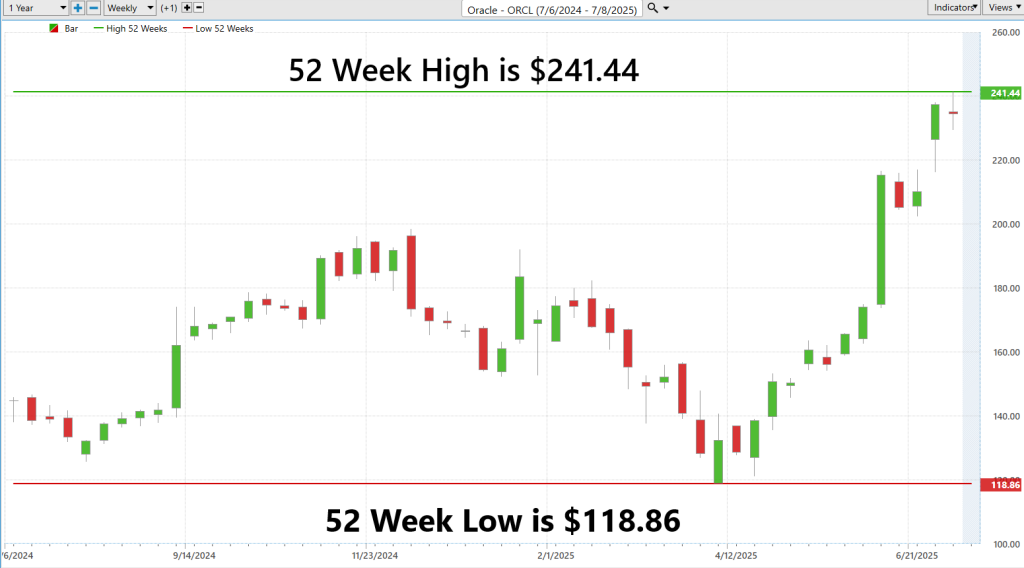
Take a look at Oracle ($ORCL). Right now, it’s trading at $234.50, which places it 94.3% of the way toward its 52-week high of $241.44. That alone should raise your eyebrows. Why? Because stocks that live in the top decile of their annual range are telling you something loud and clear: they’ve got momentum. Traders and institutions are piling in. There’s conviction.
Now here’s the kicker: the 52-week low sits way down at $118.86. That’s a jaw-dropping spread of $122.58—a 52% range relative to the current price. That’s not just historical data—it’s a volatility benchmark. It tells us that Oracle has had some real shakeouts, some real moves—and those kinds of setups are gold for tactical traders looking to play breakouts, pullbacks, or trend continuations.
Just look at the chart. From a choppy first half of the year, ORCL exploded to the upside, with a near-vertical rally over the past few weeks. This isn’t random—it’s how leadership stocks behave when the market gets serious about AI and cloud infrastructure plays. The bounce off the 52-week low earlier this year wasn’t just a recovery—it was the launchpad.
The 52-week high/low range helps you ask the right questions:
- Is the stock in accumulation or distribution?
- Is it sitting at the top, begging for a breakout?
- Or is it languishing at the bottom, waiting for a reversal?
That’s the power of understanding these boundaries. They aren’t just lines—they’re market psychology in action.
Bottom line: the smart traders don’t ignore the 52-week range—they build their game plan around it. Because when a stock is pushing its upper limits like Oracle is now, the message is clear: this thing’s moving, and the market knows it.
When we look at the 52-week chart we can see the trajectory which the stock has had over the past year. Observe when it made new 52 week highs and how the pattern continued.
When it comes to identifying stocks with unstoppable momentum, one of the most powerful trading setups we track is this: a stock making simultaneous new 52-week highs and new 10-year highs.
That’s exactly what we’re seeing with Oracle ($ORCL) right now.
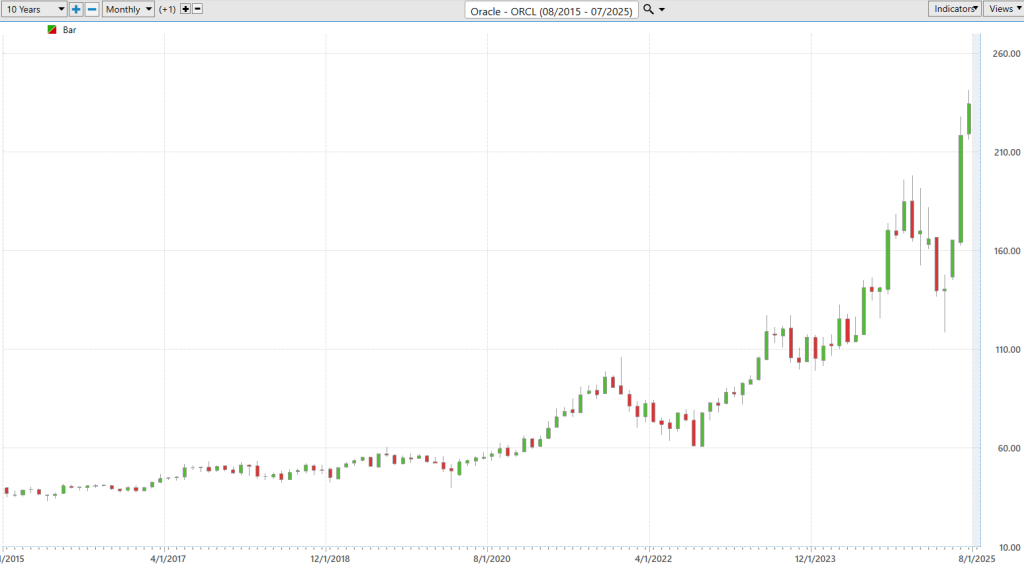
Take a look at the 10-year monthly chart. From 2015 to early 2020, Oracle moved like a legacy tech name—steady, predictable, but nothing explosive. Then came the shift. As the world digitized and enterprise cloud adoption surged, Oracle started breaking out of its long-term base. The rally from 2021 onward shows a fundamental transformation—from slow-moving database giant to AI-infrastructure juggernaut.
But here’s what really matters: over the past few months, ORCL hasn’t just reclaimed old highs—it’s smashed through them. It’s now printing new all-time highs on both the 1-year and 10-year time frames. That tells us this is no ordinary move. It’s a re-rating, a fundamental revaluation by institutions betting big on Oracle’s cloud and AI future.
When a stock clears every historical ceiling in its path, it’s a sign that buyers are in full control—overcoming every obstacle, discounting every risk, and rewriting the company’s growth story. These setups tend to attract more capital, more momentum, and more breakout traders.
Bottom line: Oracle is showing the kind of price behavior that separates true leaders from the pack. For traders, this is the setup you look for—a long-term breakout backed by institutional conviction, strong narrative, and explosive upside potential.
Watch this trend closely. Stocks that lead like this don’t just drift—they accelerate.
Best-Case/Worst-Case Scenario Analysis
One of the uncomfortable truths that every seasoned investor eventually grapples with is this: the market is not a measured machine. It’s a mood—prone to overreaction, driven by narrative, and, more often than not, shaped by volatility. This isn’t just a statistical quirk. Volatility is the underlying current that moves capital, reshapes strategy, and tests conviction.
Yet despite its central role, volatility is either ignored, misunderstood, or overanalyzed. Too often it’s buried in technical jargon or obscured by complex models. But at its core, the question is simple — and profoundly important: How far can this stock swing? Not in theory, but in historical terms. That’s why the 52-week range—its absolute highs and lows—is so essential. It’s not just data. It’s sentiment in numeric form. It reflects the breadth of emotion investors have priced into a company over the past year—fear, greed, conviction, doubt.
If the underlying story remains intact—whether it’s tied to structural tailwinds, sustainable cash flow, or defensible market share—then understanding that range isn’t just academic. It becomes a lens through which present risk is measured and future opportunity is contextualized. In a market where narratives can shift overnight and capital moves with precision, knowing how far something can stretch—or snap back—isn’t merely prudent. It’s essential.
So, before capital is committed, before models are built, we begin with the range. Because in a world increasingly driven by noise, magnitude still matters.
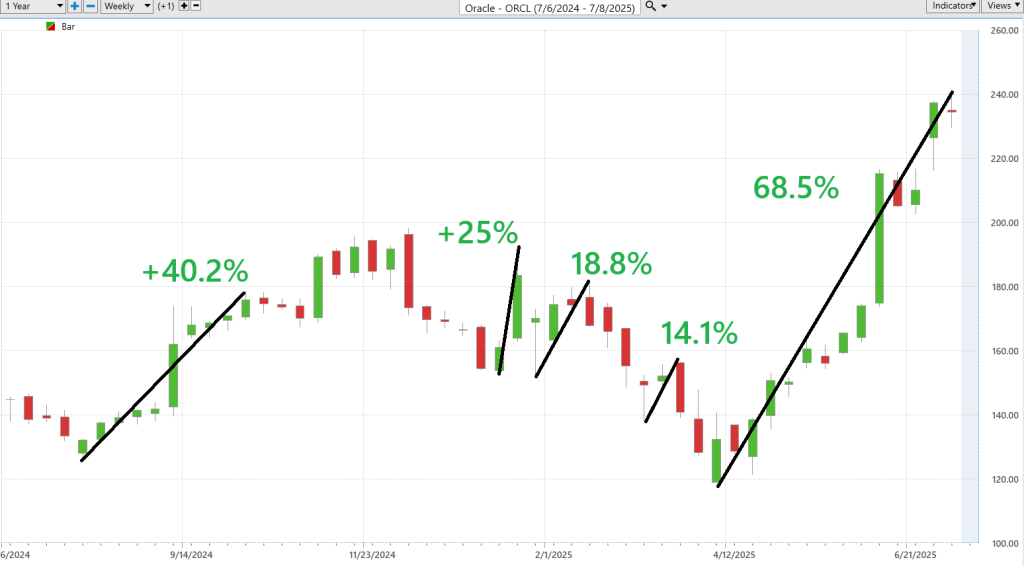
We start by looking at the best-case scenario qand measure the largest uninterrupted rallies on the weekly chart.
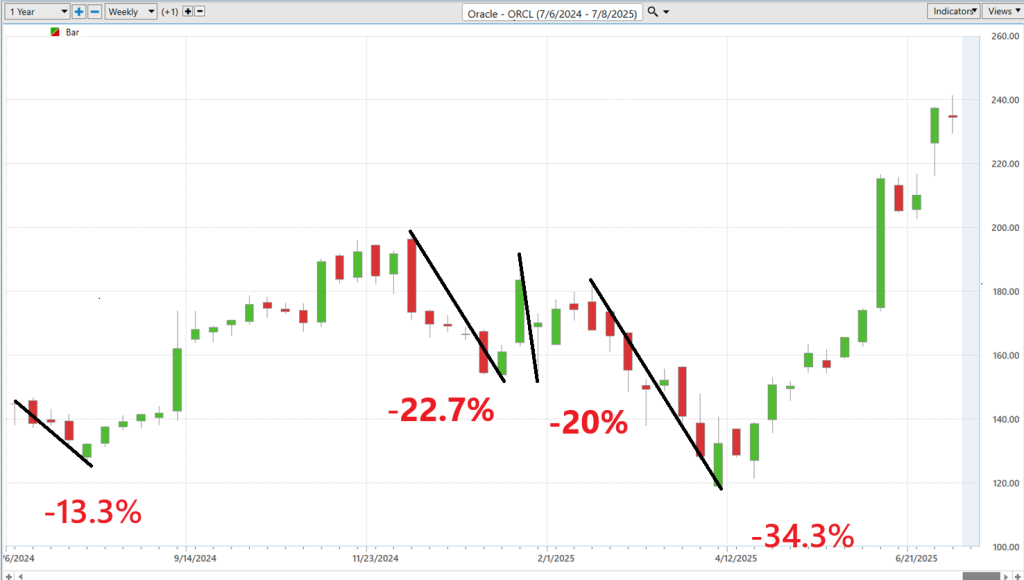
Followed by the worst-case scenario where we measure the largest uninterrupted declines.
Most traders make volatility far more complicated than it needs to be. They rely on dense technical formulas—standard deviation, ATR bands, beta coefficients—while missing what’s right in front of them.
Instead, here’s a simpler approach: measure the largest uninterrupted rallies and declines on a chart. These are the true expressions of market behavior—clear, visible, and rooted in real-world price action.
Take Oracle ($ORCL) over the past year. The data doesn’t lie. There have been multiple sharp pullbacks—-13.3%, -22.7%, -20%, and a brutal -34.3% drop. These weren’t statistical noise. These were deep, confidence-shaking moves that would’ve shaken out retail traders.
But now look at the flip side: +40.2%, +25%, +18.8%, +14.1%, and most recently a monstrous +68.5% rally. That kind of upside doesn’t come from a weak stock—it comes from a leader in motion, attracting serious capital.
Yes, the bulls are in control—but if you don’t respect the downside, you’re trading blind. That’s why studying these largest swings gives you a grounded understanding of the risk-reward profile without getting lost in mathematical fog.
If you really want to win this game—and I mean win it with conviction—you’ve got to stop dancing around with theories and equations that don’t belong outside of a think tank. This market doesn’t reward complexity. It rewards clarity.
The truth? Every surge and every sell-off on a chart is a message. A message from the institutions, the whales, the heavy hitters who move billions like chess pieces. They don’t whisper—they shout. And those moves, those swings? They’re not random. They’re breadcrumbs. And if you’ve got the guts and the sense to follow them, you’ll know exactly where the next big move is headed.
What’s happened in the past isn’t just background noise. It’s the entire blueprint. It’s where you see the fingerprints of the smart money and the footprints of everyone else trying to catch up. Markets don’t repeat perfectly—but they rhyme. And those rhymes? That’s where the money is.
So stop guessing. Start tracking. You want to know the best-case scenario? Measure the biggest rallies. Want to know your downside risk? Measure the nastiest drops. That’s not theory—that’s trading reality. And it’s how you find out which stocks are built to lead… and which are destined to fold.
Pay attention—because here’s where we separate the winners from the wannabes.
Let’s put $ORCL under the microscope and see what the big money’s really chasing. You don’t need some crystal ball or fancy algorithm—you just need to know where the strength is. And right now? Oracle is blowing the doors off the competition.
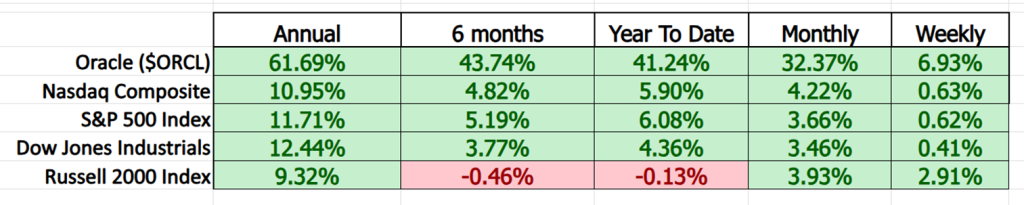
Look at the numbers. While the S&P 500 is putting up a respectable 6% year-to-date and the Nasdaq Composite clocks in at around 5.9%, $ORCL is up a scorching 41.24%. And it doesn’t stop there—over the past six months, Oracle’s jumped 43.74%, while the Russell 2000? It’s negative. That’s right—small caps are getting dragged while Oracle’s torching the trail.
Zoom in tighter. On a monthly basis, Oracle surged 32.37%. That’s not a typo. Meanwhile, the Dow’s barely moving, and the Russell 2000 continues to sputter like an old engine on a cold morning.
So what does this tell you?
It tells you Oracle’s not riding coattails. It’s leading the charge—defying gravity while small caps crumble under rate pressure, inflation drag, and capital flight. This kind of outperformance isn’t luck. It’s leadership.
Bottom line: when you line up $ORCL next to the market’s heavyweights, it’s not even close. And in this business, relative strength matters. You want to trade the generals, not the foot soldiers. Oracle is marching. The rest? Scrambling to keep up.
Now the question is—are you riding the right horse?
Vantagepoint A.I. Predictive Blue Line
In a market where sentiment shifts by the hour and headlines move billions, edge doesn’t come from instinct—it comes from insight. And not just any insight. The kind forged from data, built on discipline, and sharpened by algorithms.
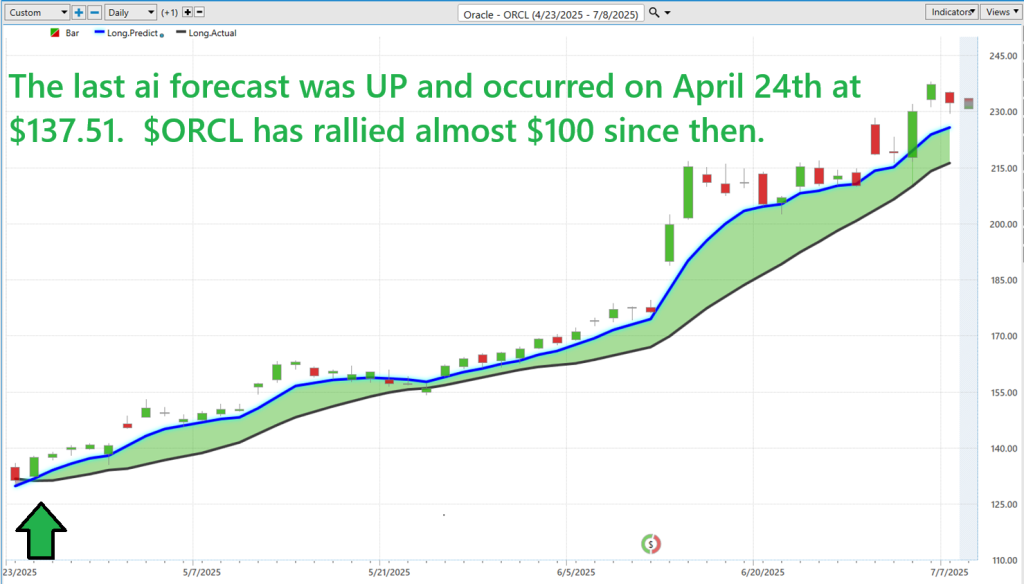
Enter the Predictive Blue Line, a proprietary signal generated by VantagePoint’s artificial intelligence engine. It doesn’t rely on lagging indicators or static trendlines—it anticipates. On April 24th, this A.I. signaled an upward shift in momentum for Oracle ($ORCL) at $137.51. What followed wasn’t just a good call. It was a defining one.
Since that signal, Oracle has surged nearly $100—a gain that doesn’t just outperform the market, it redefines what leadership looks like in the current cycle. The forecast wasn’t a guess—it was an informed, algorithmically derived signal that cut through volatility and positioned traders early in one of the year’s most impressive rallies.
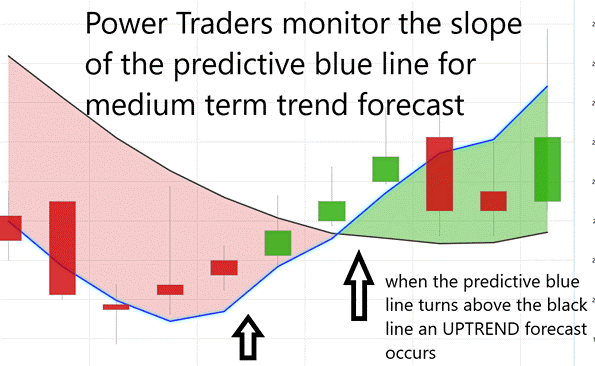
But what truly makes the Predictive Blue Line different is how it interacts with what professionals call the Value Zone—the shaded area where price converges with predictive momentum. It’s here that the market tests conviction. In a rising trend, dips toward this zone often mark optimal buy points. In falling trends, any price action breaking above the zone can be a tactical exit or short signal. It’s not magic—it’s machine learning, converted into action.
This chart isn’t just a case study—it’s a proof point. In a world chasing speed and certainty, the traders armed with predictive analytics aren’t playing catch-up. They’re already at the next level.
Neural Network Forecast (Machine Learning
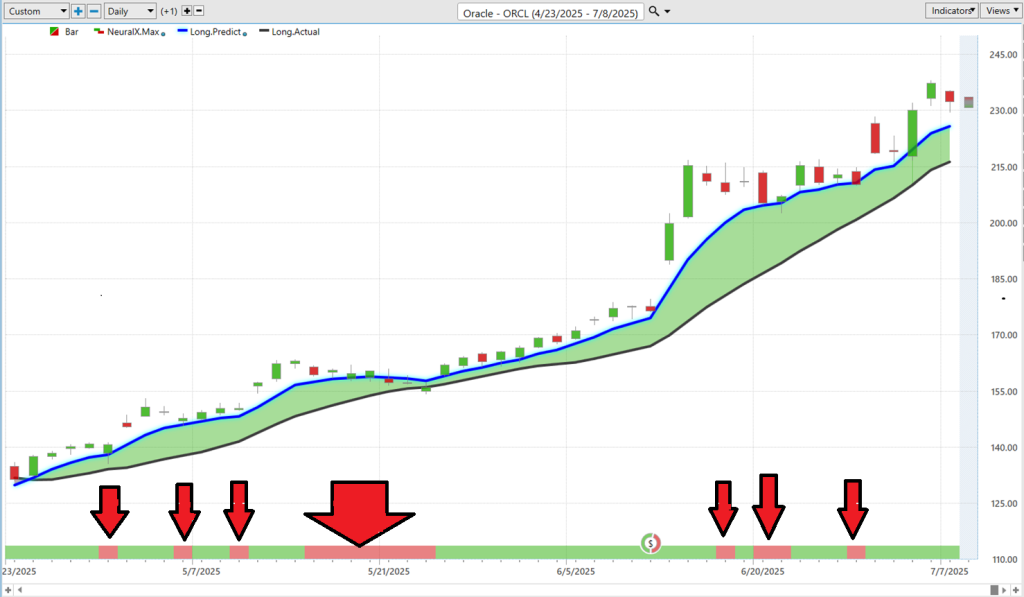
Let’s cut through the hype and get right to the core of what we’re seeing here. Those red down arrows on the chart? They’re not random. They’re not hunches. They’re neural index warnings—and they come straight from a machine that doesn’t blink. Every time the neural index flashed red it is a short-term forecast that the market is overextended and will pull back to the predictive blue line.
A neural index is a high-powered forecasting tool built on artificial intelligence—more specifically, a neural network, modeled after the human brain but running on math, data, and zero emotion. It’s trained to study years—sometimes decades—of market history: prices, volume, intermarket relationships, the works. And instead of reacting to the market like most traders do, it predicts the likely short-term direction—up or down.
Now take a good look at the chart. Every time that neural index flashed red, the market rolled over. Not days later—right on cue. That’s not a coincidence. That’s pattern recognition at machine speed, and it’s the kind of insight that gives you time to prepare instead of scramble.
This isn’t some off-the-shelf indicator with a fancy name. It’s a tactical warning system, helping you avoid bad entries, tighten stops, and protect profits. You’re no longer flying blind or chasing rumors—you’re operating with a roadmap built from raw, unbiased data.
And here’s the hard truth, folks—most people out there aren’t trading. They’re guessing. They’re reacting to headlines, chasing price, and calling it a “strategy.” Meanwhile, Wall Street’s laughing all the way to the bank.
But with a neural index? You’re armed. You’re informed. You’re acting before the herd catches up. It’s not hype—it’s what serious traders are using to stay one step ahead in a market that doesn’t care about hope, only probability.
If you’re tired of playing defense, maybe it’s time to let the data go to work for you. Because in this game, speed and precision are the only edge that matters—and the neural index gives you both.
VantagePoint A.I. Daily Range Forecast
Let’s have a real talk about volatility. Because the truth is, volatility isn’t your enemy—it’s your opportunity. It’s the heartbeat of the market. And if you’re serious about building wealth, you don’t run from it… you read it, plan around it, and capitalize on it.
Here are the average trading ranges for $ORCL over the daily, weekly and monthly time frame:
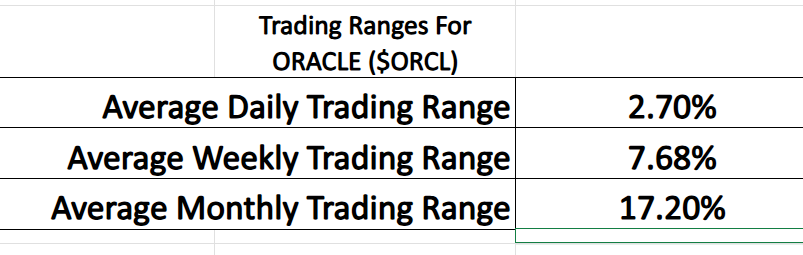
Now take a look at Oracle ($ORCL). According to the data, the stock’s average daily trading range sits at 2.70%, the weekly range expands to 7.68%, and on a monthly basis we’re looking at a massive 17.20%. That’s not noise—that’s a blueprint for strategic positioning.
You see, in today’s market, stocks like Oracle are the modern-day battlegrounds. And while most traders are out there chasing headlines, reacting emotionally, or trying to “feel” the market, those who come armed with hard numbers and a game plan are the ones raking in results.
That’s where tools like VantagePoint A.I. come in. This isn’t just tech for tech’s sake—it’s a tactical edge. It sees what most can’t. It processes faster than any human possibly could. And when paired with a high-volatility stock like ORCL, it becomes your navigation system in the fog of financial warfare.
These trading ranges aren’t academic curiosities. They’re the framework for setting expectations, adjusting risk, and timing trades with confidence. When you know a stock like Oracle moves nearly 7–8% per week, you stop getting surprised—and start getting prepared.
Bottom line? The edge goes to the trader who respects the data, plans around the swings, and shows up ready. Oracle is giving you the range. Now the question is—do you have the tools to make it work for you?
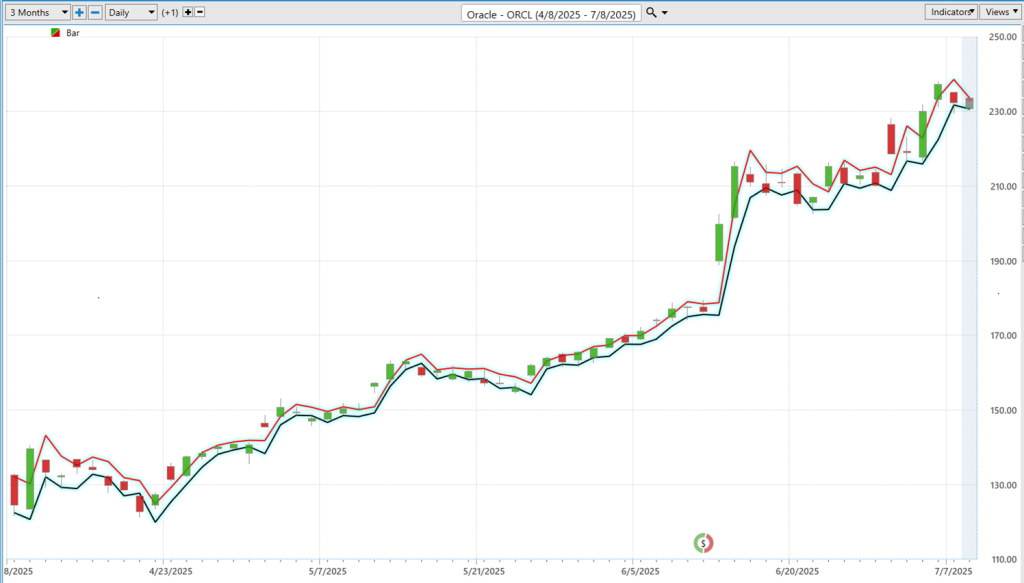
Now check out how effective the VantagePoint Daily Range forecast is in anticipating each day’s trading range.
Intermarket Analysis
Intermarket analysis is the study of how different asset classes—such as stocks, bonds, commodities, and currencies—interact and influence one another. It’s important because it helps traders anticipate market moves by understanding the broader economic forces and correlations that drive asset prices, rather than analyzing one market in isolation.
Let’s break it down, plain and simple—Oracle Corporation ($ORCL) doesn’t move in a vacuum. It’s a heavyweight in the tech world, and its stock price is a reflection of intermarket dynamics, not daydreams or hype.
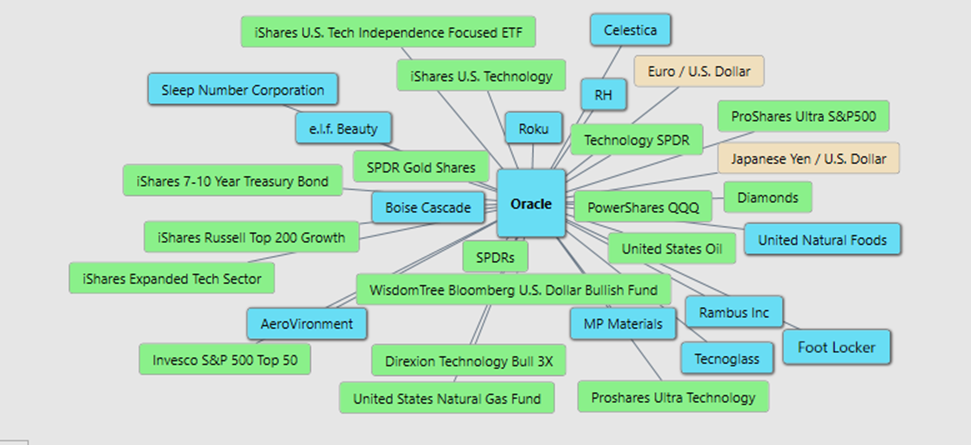
First, let’s talk technology ETFs—XLK, QQQ, IYW, TECL, ROM. These aren’t just ticker symbols. They’re sentiment gauges for the entire tech sector. When investors are piling into tech, chasing growth driven by AI and cloud innovation, you’d better believe Oracle is riding that wave. Strong numbers in QQQ or XLK? That’s bullish fuel for ORCL. But if those ETFs start slipping—maybe it’s regulation, maybe it’s economic slowdown—ORCL gets hit, no questions asked.
Then you’ve got your broad market barometers—SPY, DIA, SSO, IWY, XLG. These tell you how the overall market feels about risk. When Wall Street’s feeling good, when the indexes are rallying, Oracle’s right there climbing the ladder. But if the market turns cautious, big-cap names like ORCL don’t get a free pass—they feel the heat. And don’t ignore the leveraged ETFs like TECL and SSO. These aren’t for the faint of heart—they exaggerate the trend, giving us a crystal-clear read on momentum and conviction.
Now here’s where it gets serious—interest rates. The IEF ETF tracks 7-10 year Treasuries, and it matters. Oracle is a growth stock. That means when yields rise and IEF falls, it’s like a tax on future earnings. It compresses valuation, especially in cloud and infrastructure. On the flip side, falling yields lower capital costs and light a fire under stocks like ORCL. This is classic market physics—you ignore it, you lose money.
What else? Commodities. That’s right—GLD, USO, UNG. Oil and natural gas costs can squeeze Oracle’s massive data centers. And when gold is rising, it usually means fear is rising too—and that’s not good for risk-on names like Oracle. These aren’t just macro signals—they’re operational reality.
And let’s not forget about currencies. A stronger U.S. dollar (USDU up, EUR/USD or JPY/USD down) is a problem when 40% of your revenue comes from international markets. It makes Oracle’s products more expensive overseas, cuts into profits. A weaker dollar? That’s good news for foreign sales—and good news for ORCL shareholders.
Finally, you want to watch the related names. Companies like Celestica (CLS) and Rambus (RMBS) echo the sector’s health. Consumer plays like ELF or FL, and cyclicals like BCC and AVAV? They reflect corporate confidence and IT spending—exactly the environment Oracle needs to thrive.
Bottom line: if you’re watching Oracle, you better be watching everything—tech sentiment, interest rates, commodities, currencies, and market breadth. Because that’s what moves this stock. And in today’s market, only the informed survive.
Here are the 31 key driver of $ORCL price action:
Our Suggestion
Oracle just dropped a massive bargain-bomb on the federal government—75% off its license-based software packages, plus steep cloud-container discounts through November. That makes it the first big cloud provider to roll out government-wide infrastructure savings, tying into the OneGov initiative that’s stripping out middlemen, consolidating buy power, and squeezing tech vendors to pass the savings to taxpayers (wsj.com).
This isn’t charity—it’s strategic muscle flexing. Oracle’s loading the deal with AI tools, white-glove migration, and elite-security clearances to pry open defense, USDA, VA, and other federal coffers. In a cloud world dominated by AWS and Azure, Oracle’s using this move to drive deep into the public sector—and lock agencies into its ecosystem before those discounts evaporate.
Oracle is standing out in the crowded software field, and Wall Street can’t ignore it. Analysts highlight a massive cloud-services agreement expected to deliver over $30 billion annually by fiscal 2028, signaling a game-changing shift into hyperscale infrastructure. Jefferies’ Brent Thill and others point to Oracle’s 100%+ growth in remaining performance obligations (RPO) and an acceleration in revenue as proof the company is executing—and it’s not a small feat. This isn’t just hype—it’s a real transformation, giving investors a new level of confidence and duration in Oracle’s cloud strategy.
Other institutions have chimed in too. Stifel upgraded ORCL to “buy”, citing explosive multi-cloud trends and AI momentum, forecasting a path toward $104 billion in revenue by 2029. Mizuho echoed the sentiment, tying Oracle’s surge to its crucial role in initiatives like OpenAI’s Stargate and even possible ties to TikTok’s US footprint—all indicators of real tailwinds behind OCI growth. With nearly 60% of analysts rating the stock a “Buy,” Oracle has broken free from legacy tech and morphed into one of today’s premier cloud contenders.
Oracle’s takeaway is a strong vote of confidence: analysts see its pivot to hyperscale cloud as more than smoke — it’s a potential game-changer. With a major deal projected to generate over $30 billion in annual revenue by FY 2028, Oracle is rewriting its narrative from legacy software to a full-throttle cloud infrastructure play. That kind of backing fuels not only its fundamentals but also raises its valuation floor.
These stats aren’t theoretical — they position Oracle as a bona fide hyperscaler, strengthening the credibility of its long-term targets and suggesting meaningful upside for investors who believe in its cloud-first transformation.
We suggest you place $ORCL on your trading radar.
It will create numerous trading opportunities over the coming year.
Practice good money management on all of your trades.
Use the VantagePoint A.I. Daily Range forecast for short-term trading opportunities.
It’s not magic.
It’s machine learning.
Disclaimer: THERE IS A HIGH DEGREE OF RISK INVOLVED IN TRADING. IT IS NOT PRUDENT OR ADVISABLE TO MAKE TRADING DECISIONS THAT ARE BEYOND YOUR FINANCIAL MEANS OR INVOLVE TRADING CAPITAL THAT YOU ARE NOT WILLING AND CAPABLE OF LOSING.
VANTAGEPOINT’S MARKETING CAMPAIGNS, OF ANY KIND, DO NOT CONSTITUTE TRADING ADVICE OR AN ENDORSEMENT OR RECOMMENDATION BY VANTAGEPOINT AI OR ANY ASSOCIATED AFFILIATES OF ANY TRADING METHODS, PROGRAMS, SYSTEMS OR ROUTINES. VANTAGEPOINT’S PERSONNEL ARE NOT LICENSED BROKERS OR ADVISORS AND DO NOT OFFER TRADING ADVICE.


