


This week’s ai stock spotlight is Palantir ($PLTR)
Palantir Technologies (PLTR) is a U.S.-based software company founded in 2003 by Peter Thiel, Alex Karp, and others, originally to develop advanced data integration and analytics tools for U.S. intelligence agencies. They’re best known for building platforms that ingest massive, disparate datasets and transform them into actionable intelligence — first for counterterrorism and defense, and later for commercial enterprises.
Their two flagship products are Gotham (used by government agencies for intelligence, defense, and law enforcement) and Foundry (used by corporations for operational data integration, analytics, and decision-making). More recently, they launched AIP (Artificial Intelligence Platform), designed to plug A.I. models directly into workflows so organizations can make faster, automated decisions.
They’re controversial for several reasons. First, their deep ties to defense, intelligence, and law enforcement have sparked privacy and civil liberties debates — critics say the tools can enable mass surveillance, while Palantir argues they’re built to uphold Western democratic values. Second, they’ve been awarded massive, long-term contracts (like their NHS England data platform work and a recent $10B U.S. Army agreement), which raises questions about the influence and reach of private tech firms in public-sector decision-making. Third, their close association with government operations, especially in national security, makes them a lightning rod in political discourse about Big Tech’s role in society.
Palantir is successful because they operate in high-stakes, high-barrier-to-entry markets where trust, security, and proven execution are essential. Their government contracts tend to be sticky — once an agency embeds Palantir into its operations, switching costs are enormous. On the commercial side, they’ve leveraged this credibility to win business with Fortune 500 companies in finance, manufacturing, healthcare, and energy, where data complexity is equally daunting. They also benefit from network effects — as more datasets and use cases flow through their platforms, the systems become smarter and more indispensable.
When we study their revenue and earnings over the last 5 years we see very impressive surges of growth.

Look at this table and tell me you’re not seeing a company in full beast mode. In just five years, Palantir ($PLTR) has nearly tripled its revenue — from about $1.09 billion in 2020 to almost $2.87 billion in 2024. And the earnings story? Even more jaw-dropping. They’ve gone from bleeding $1.16 billion in losses to stacking up $462 million in profits. That’s a $1.6 billion swing in the right direction. You don’t pull that off unless you’re in the right place, with the right product, at exactly the right time.
$PLTR is sitting right at the epicenter of the A.I. boom. While other companies are scrambling to figure out their A.I. play, Palantir’s been quietly building the infrastructure for it for years. Government contracts, enterprise adoption, their A.I. Platform (AIP), it’s all converging now. The market’s waking up to the fact that Palantir isn’t just another software company; it’s one of the primary beneficiaries of the biggest tech wave since the internet. And if you’ve been waiting for a signal that this company is built for the next decade, this table is it.
Palantir ($PLTR) is making history right now. The data analytics powerhouse smashed past the $1 billion quarterly revenue mark for the first time ever, crushing Wall Street’s expectations, and raised its full-year revenue outlook to as high as $4.15 billion. Driving this surge is explosive demand for its A.I. platform, with U.S. commercial revenue nearly doubling year-over-year and total U.S. business soaring 68%. CEO Alex Karp calls it “the astonishing impact of A.I. leverage,” and the market agrees — the stock closes at an all-time high, up nearly 8% on the day, delivering a staggering 600% gain over the past year.
$PLTR makes money primarily through software subscriptions and long-term contracts. Government clients pay for Gotham, while commercial clients pay for Foundry and AIP. These deals often start as pilot programs, expand into multi-year enterprise licenses, and can be worth hundreds of millions of dollars. Palantir’s business model blends recurring subscription revenue with substantial professional services to onboard and customize solutions for clients, creating both short-term cash flow and long-term recurring income streams.
Palantir (PLTR) isn’t just some Silicon Valley darling. This is the Denver-based data and A.I. war machine that just hauled in its first-ever billion-dollar quarter and jacked up its 2025 outlook. Why? Because U.S. demand for its AI platform is exploding while the government side just locked in a ten-year U.S. Army deal worth up to $10 billion. Their secret weapon? AIP — Palantir’s Artificial Intelligence Platform — that doesn’t just give flashy demos, it deploys into real-world operations to automate the kind of work entire departments used to choke on. The stock’s been ripping, the company’s now GAAP profitable, and the cash flow’s flowing. This is no longer a “someday” story. It’s here.
But here’s the part the Beltway and Silicon Valley would rather whisper about: the valuation is nosebleed-high-priced for growth that must keep compounding without a hiccup. And Palantir’s fingerprints are all over public-sector projects that keep privacy watchdogs frothing — look no further than the ongoing knife fight over their NHS England data platform. The political tension between being the go-to A.I. contractor for liberal democracies and being accused of enabling surveillance? That cloud doesn’t go away. Add in the fact that U.S. growth is roaring but international adoption’s still lopsided, and any slowdown in A.I. spending or procurement could pop this balloon fast.
When I listen to their recent earnings call, I see management celebrating the following accomplishments:
Record scale: Q2 revenue blasts past $1B, full-year guidance raised — momentum’s not imaginary.
Government moat: A $10B Army deal cements them deep in U.S. defense for the next decade.
Commercial flywheel: AIP is cranking U.S. commercial growth as customers move from “pilot” to “permanent.”
Profitable and funded: GAAP profits and strong free cash flow give them staying power.
High stakes, high multiple: Price is rich, politics are messy, execution has to be perfect.
Bottom line? Palantir’s an American A.I. juggernaut with real earnings power, but it’s a stock for disciplined operators who know the difference between a rocket ride and a cliff dive.
In this stock study, we’ll analyze the key indicators and metrics that guide our decisions on whether to find opportunities to buy, sell, or stand aside on a particular stock. These inputs serve as both our framework and behavioral compass, rooted in data and powered by predictive intelligence.
- Wall Street Analysts Ratings and Forecasts
- 52 Week High and Low Boundaries
- Best-Case / Worst-Case Scenario Analysis
- VantagePoint A.I. Predictive Blue Line
- Neural Network Forecast (Machine Learning)
- VantagePoint A.I. Daily Range Forecast
- Intermarket Analysis
- Our Suggestion
While our decisions are ultimately anchored in artificial intelligence forecasts, we briefly review the company’s fundamentals to better understand the financial environment it operates in. For $PLTR this context helps us assess the quality of the A.I. signal within a broader economic and industry backdrop.
Wall Street Analysts Forecasts
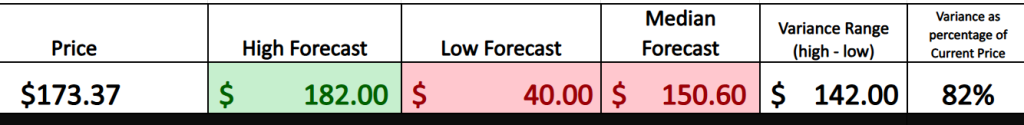
Sixteen Wall Street analysts have all taken their shots at calling where Palantir ($PLTR) is headed over the next year. On average, they’re pegging it at $150.60 — which, if they’re right, means the stock dips about 6.26% from where it’s sitting now at $160.66. The most bullish? They’re swinging for $182.00. The most bearish? They think it tanks down to $40.00. That’s a canyon-wide gap, folks, and when the experts disagree this much, it’s your signal that volatility is locked and loaded.
What the graphic really shows is dispersion and how far apart smart, well-informed people can be about the same stock. For Palantir ($PLTR), the 12-month targets run from $40 to $182. That’s a $142 spread, which is roughly 82% of the current price (~$173.37). Think of that gap as a proxy for expected volatility: not a formal options metric, but a clear market signal that the path ahead could be wide, bumpy, and fast. When the range is this large, it tells you the Street is debating fundamentals in real time — A.I. adoption pace, federal contract cadence, margin durability, and how much premium investors will keep paying for growth.
Treat the spread as a scenario map. A wide range argues for cautious position sizing, tighter risk controls, and — if you trade options — structures that respect big moves (debit spreads over naked calls, defined-risk put hedges, collars). Watch whether the dispersion narrows after updates on AIP deployments or major government awards; tightening ranges usually mean rising consensus and lower perceived risk. Until then, the message is straightforward: the opportunity is large, and so is the uncertainty — plan accordingly.
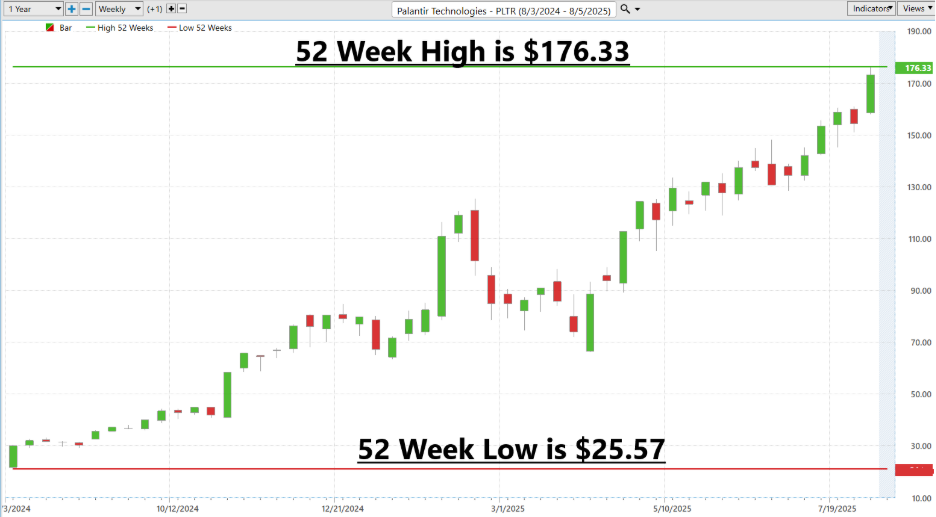
52 Week High and Low Boundaries
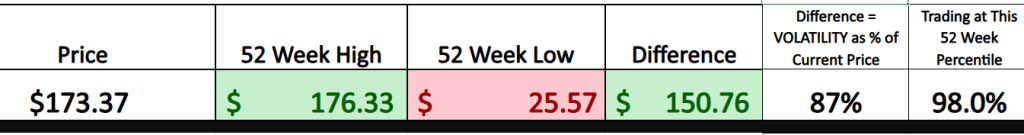
What this chart makes immediately clear is just how dramatic Palantir’s ($PLTR) trading year has been. The stock’s 52-week low sits at $25.57, while the high is $176.33. Subtract the low from the high and you get a $150.76 range — and when you express that as a percentage of the current price, you arrive at 87% historic volatility. This is a window into the magnitude of swings investors have had to navigate over the past year.
Why does this matter? Because historic volatility is the factual record of how far the stock has moved, not a forecast. It tells you the bandwidth the market has been willing to explore for this name. And with PLTR trading at 98% of its 52-week range, the market is pricing it near peak optimism, leaving little cushion if sentiment shifts. For traders and portfolio managers, that combination — high historic volatility and a position near the top of the range — forces a strategic decision: lean into the momentum with tight risk controls or prepare for the possibility that gravity eventually reasserts itself.
What jumps out from this chart is not just the trend — it’s the sheer scale of the moves. Over the past 52 weeks, Palantir ($PLTR) has traded as high as $176.33 and as low as $25.37. That’s a swing of more than $150 per share, representing an enormous percentage of its current price. In other words, this is not a stock that moves in quiet, predictable increments — it moves in surges and plunges that can erase or create months of gains in just a few weeks.
For traders, that level of historic volatility is both opportunity and danger. On one hand, it creates a fertile environment for outsized returns if you’re on the right side of the move; on the other, it can punish overexposure or poor timing with equal speed. The chart shows that PLTR hasn’t just drifted higher — it’s ripped upward in powerful rallies, paused in consolidation, and then accelerated again, with drawdowns along the way that test conviction. Anyone stepping into this trade must be prepared to confront that reality: with PLTR, volatility is a main characteristic. Risk management, position sizing, and discipline are your survival tools.

Best-Case/Worst-Case Analysis
Trading is a lot like driving. There are stretches where you can hit the gas — clear, straight, wide-open lanes where momentum is your friend. And there are stretches where you need to ease off — blind curves, slick surfaces, and tight squeezes where one wrong move can send you over the edge. In the markets, just like on the road, knowing the terrain you’re in changes everything. And the best way to know what’s ahead is to understand what’s already behind you. For $PLTR, that means more than just watching price ticks — it’s reading the story the price action is telling. Volatility isn’t noise. It’s the plotline.
That’s why it matters so much. In today’s hyper-speed markets — where one headline can flip an entire sector — volatility isn’t just “risk.” It’s a real-time read on sentiment and structure. It tells you how to size your position, how much conviction to carry, and how to shape your game plan. With high-volatility stocks like $PLTR, you don’t go in with the same weight you’d give a slow-moving utility. You scale smart. Not because the upside is weak, but because the cost of being wrong is magnified. A small misstep here can mean the difference between stacking gains and getting wiped out.
That’s why traders care about the 52-week range. Not because it predicts the future, but because it tells you how much drama — both euphoria and pain — the stock has absorbed. And when a company like $PLTR has strong fundamentals, big contracts, and exposure to the AI boom, that volatility becomes an advantage, not a deterrent. It hands you tactical entry points, exposes institutional footprints, and forces discipline. The 52-week range becomes less a red flag and more a targeting reticle.
And this is why mapping extremes — the biggest uninterrupted runs and drops on a chart — is so valuable. It gives you context. Was that surge driven by blowout earnings and upgrades? Or was that plunge fueled by panic selling and macro fear? Serious traders answer those questions before they click “buy.” Because when perception can turn on a dime, knowing the size and cause of past moves gives you clarity when others see chaos.
So, before you put a dollar in the game, study the biggest moves — the runs and the collapses. The unbroken stretches where something just took off. Those are the moments where emotion, liquidity, and logic all collided to create a surge. That’s where real traders earn their keep. Everyone else just hears about it after the fact. And that’s why we start by measuring the largest uninterrupted rallies — to set the stage for our best-case analysis.
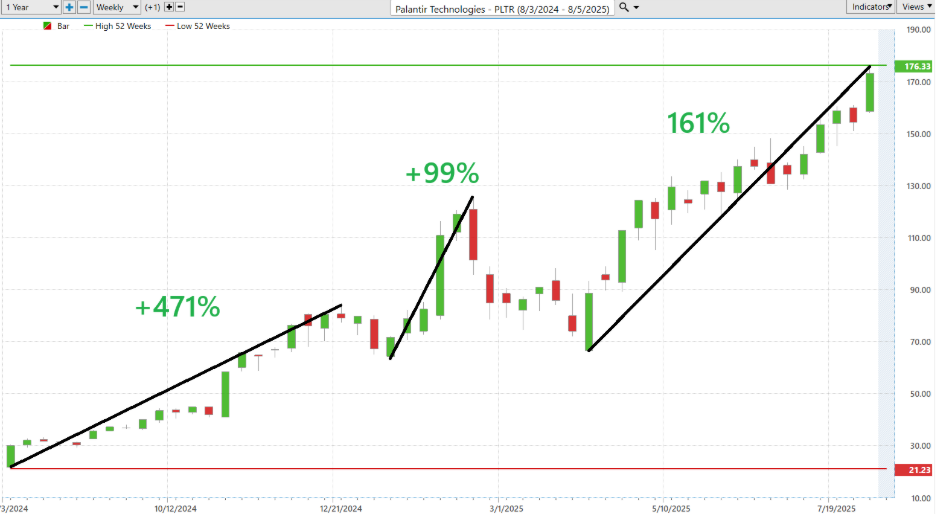
We start by measuring the largest uninterrupted rallies.
Followed by the worst-case scenario where we measure the largest uninterrupted declines.
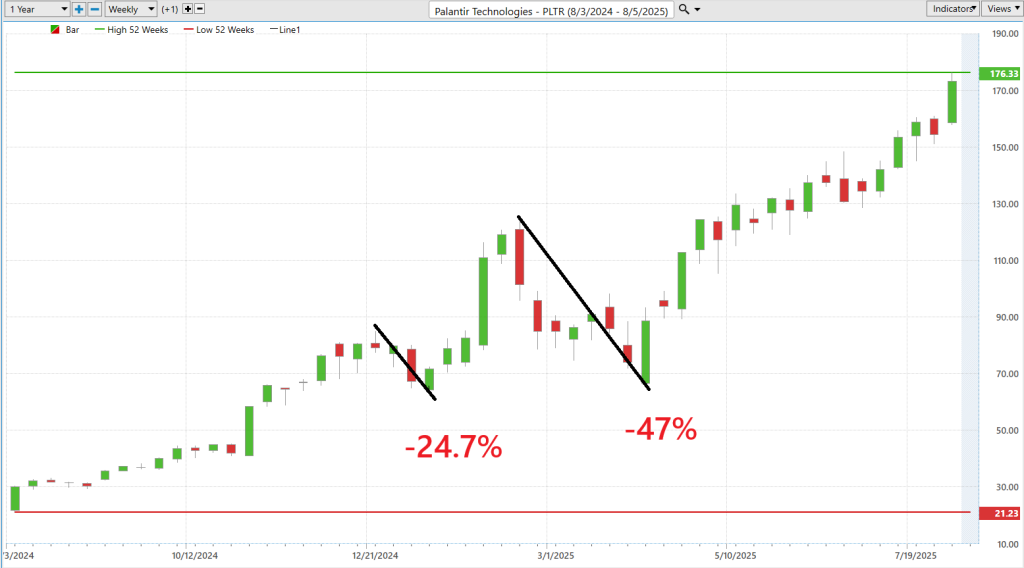
What these two charts lay bare is the reality of Palantir’s ($PLTR) trading temperament — its most powerful rallies and its deepest drawdowns over the past year. The stock has seen uninterrupted surges of +471%, +99%, and +161%, but it has also endured drops of -24.7% and -47%. This isn’t abstract volatility; it’s the lived history of price behavior. By mapping these extreme swings, you can see not just the upside potential when momentum is in your favor, but also the scale of losses that are possible when sentiment turns.
This exercise is critical because it turns volatility from a vague concept into a measurable framework. Understanding the magnitude of past rallies and declines gives traders a realistic lens for position sizing, stop placement, and risk tolerance going forward. In practice, it’s the difference between being surprised by a sudden move and being prepared for it — because you’ve seen exactly what the stock can do when the market decides to test both extremes.
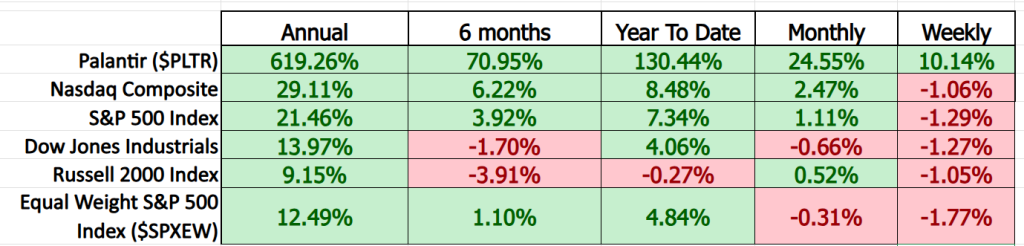
Just take a look at this scoreboard — Palantir ($PLTR) is running circles around the broader market across every major time frame. Over the past year, it’s up an extraordinary 619%, leaving the Nasdaq’s 29% gain and the S&P 500’s 21% in the dust. And it’s not just a one-year phenomenon — the momentum is relentless. Six-month performance? +70.95%, while the major indexes barely crack mid-single digits or even slip into the red. Year-to-date? +130%, more than fifteen times the Nasdaq’s return.
Even on the shorter-term snapshots, PLTR is flexing its muscles — up 24.55% over the past month and 10.14% in just the past week, while the other indexes show negative returns. This is absolute dominance, the kind of outperformance you rarely see sustained across multiple time frames. It’s a decisive vote of confidence from the market — a sign that institutional money, retail enthusiasm, and A.I.-driven tailwinds are all converging. In a market filled with winners and laggards, Palantir is in a league of its own right now.
Vantagepoint A.I. Predictive Blue Line
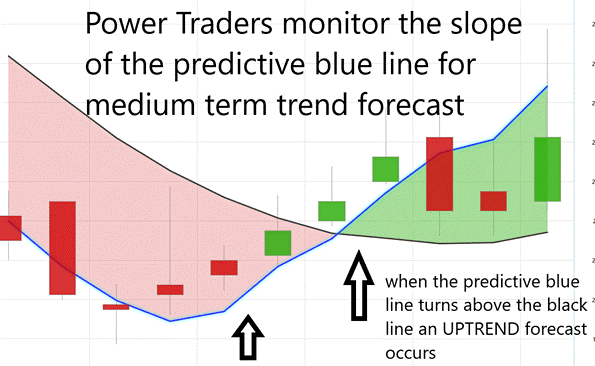
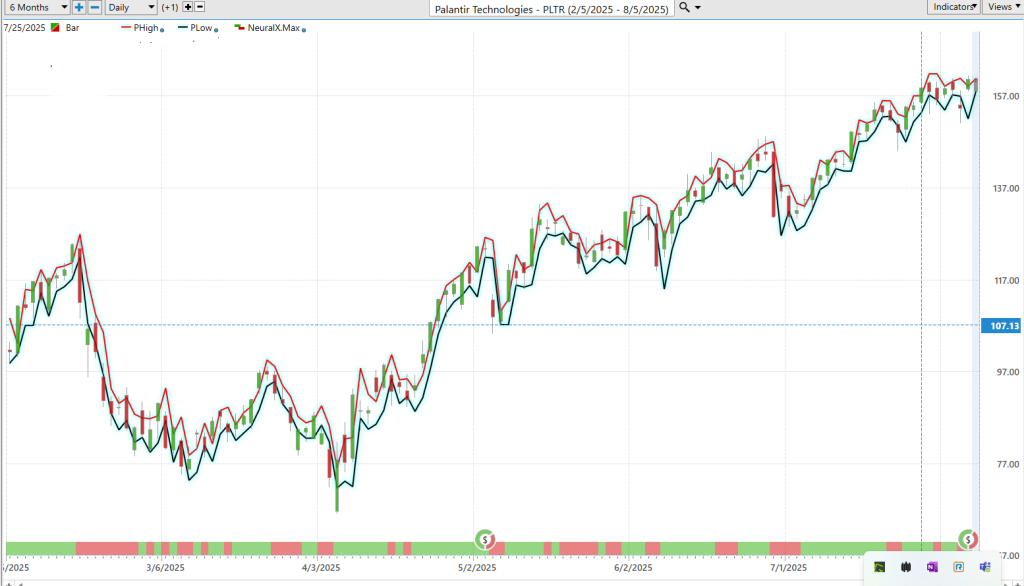
Look at the chart of Palantir ($PLTR) and you’ll see what a proactive edge looks like. The VantagePoint A.I. Predictive Blue Line consistently turns higher before price accelerates and flattens or rolls over ahead of pullbacks. That’s not a lagging overlay — it’s a forward-looking signal trained to catch momentum shifts early. When the Blue Line lifts, it’s often the first quiet tell that institutions are accumulating shares; when it bends down, that’s your heads-up to scale back, tighten stops, or step aside before a routine dip becomes a drawdown.
The shaded band between the Predictive (blue) and Actual (black) lines is your Value Zone. The flip side is just as important: if PLTR pops above the Blue Line while the line is sloping down, treat it as a likely bull trap — great for fading strength or protecting gains.

Bottom line: this tool isn’t just about calling direction; it’s about context — where pressure is building, where traps sit, and where the highest-probability entries live. In a market ruled by speed and algorithms, using the Predictive Blue Line to buy pullbacks in trend and to de-risk on turns helps you act before the crowd, size positions intelligently, and keep your edge intact.
Neural Network Forecast (Machine Learning)
In a marketplace increasingly defined by data streams, algorithmic trades, and the accelerating influence of artificial intelligence, traders are confronting a profound shift. The days of relying solely on instinct or hand-drawn charts are fading. In their place, a new standard is emerging: Neural Networks — sophisticated, adaptive systems capable of uncovering patterns hidden deep within the noise of the markets. These digital architectures don’t just analyze; they evolve, offering a glimpse into the future of price action before the broader market catches on.
At a fundamental level, a neural network is modeled after the human brain — only faster, more precise, and unburdened by fatigue. It consists of layers of “neurons” that process immense amounts of historical market data: everything from prices and trading volumes to macroeconomic indicators and complex intermarket relationships. Over time, these systems refine themselves, learning from past market behaviors to improve their forecasts. The result is an analytical engine that merges the adaptability of machine learning with the strategic demands of Wall Street, capable of flagging shifts in momentum, trend reversals, and inefficiencies well before they appear on traditional radars.
For active traders, the appeal is clear. Neural networks strip away the emotional and cognitive biases that so often cloud decision-making. They compress millions of disparate data points into a single, statistically grounded forecast — built on patterns proven across countless historical examples. The effect is transformative: instead of reacting to moves already underway, traders gain the ability to anticipate them, stepping into positions with greater conviction and fewer surprises. In practice, it’s a shift from chasing opportunity to being positioned for it before it’s obvious to everyone else.
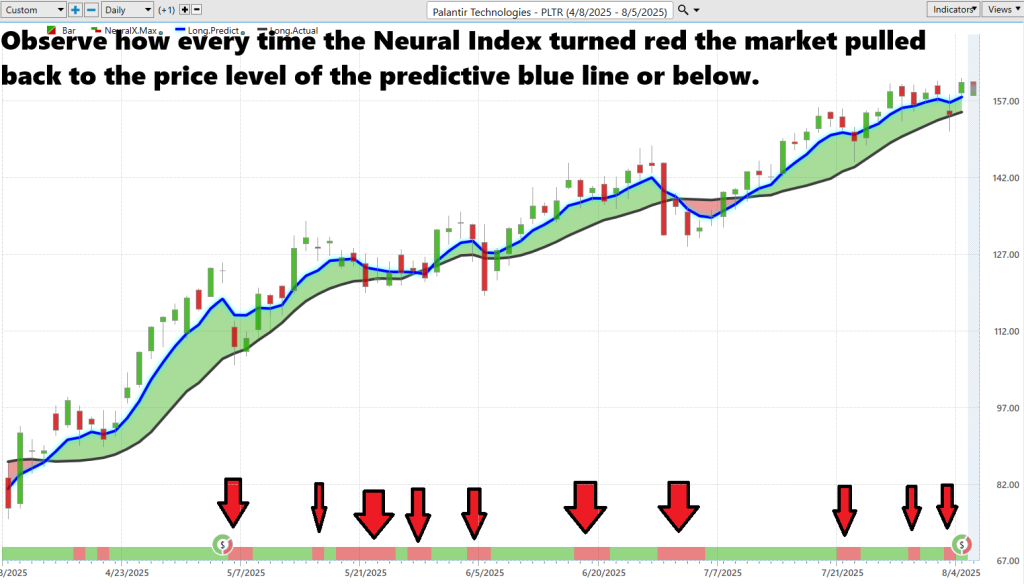
Here’s where it gets downright powerful. Pair the Predictive Blue Line with the Neural Index and you’ve got yourself a high-probability setup machine. The Blue Line gives you the forward-looking map of where price is headed; the Neural Index tells you whether the market’s short-term muscle — momentum, order flow, intermarket forces — backs it up. When they both light up in the same direction? That’s your green light. In a world where news travels faster than you can blink and volatility can spike out of nowhere, this isn’t just “nice to have” tech — it’s the kind of edge the smart money quietly uses to get in early, stay in the move, and get out before the crowd even knows what happened.
VantagePoint A.I. Daily Range Forecast
In today’s hyper-connected, high-speed markets, the baseline for trading success has shifted. Algorithmic systems capable of processing massive volumes of data in real time are no longer optional — they’re the cost of entry. We’ve moved decisively away from the days of purely reactive decision-making toward proactive, forward-looking strategies driven by artificial intelligence. This is the structural reality of modern trading: the intersection of machine precision and market opportunity.
Combine cutting-edge A.I. technology with the discipline and perspective of market experience, and the result is a powerful formula — strategies built on data, not emotion. That combination creates a framework where execution is methodical, focused, and grounded in fact. In a landscape where volatility is constant, this disciplined approach transforms uncertainty from a liability into a source of consistent opportunity.
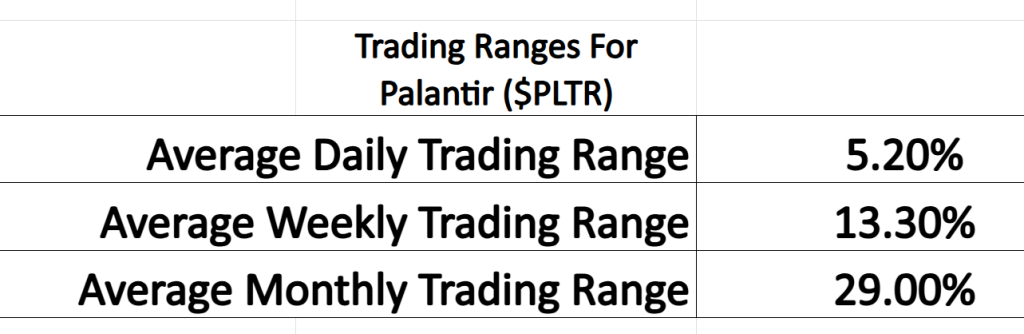
Take a closer look at Palantir ($PLTR). By studying its daily, weekly, and monthly behavior over the past year, a clear rhythm of tradable volatility emerges. For those equipped with the right analytical tools, this isn’t noise, it’s signal. The swings that rattle less-prepared traders become calculated entry and exit points, offering a consistent supply of opportunities to act before the broader market responds.
Here’s the bottom line: the data never lies. $PLTR has the kind of price action smart traders salivate over — dynamic, high-energy moves that can turn into serious gains if you know how to play them. And here’s the dirty little secret: price movement is opportunity, pure and simple. Big swings mean big paydays — but only if you’re in before the herd. Most traders? They’re chasing the taillights. The smart ones? They’re already in the driver’s seat. That’s where VantagePoint’s A.I. comes with your unfair advantage in a market built to punish the slow. It’s not about yesterday’s moves, it’s about tomorrow’s.
Neural networks crunch oceans of data and deliver precise daily range forecasts so you can plan, position, and execute before everyone else knows what’s coming. You get the roadmap in advance. Use it right, and you’re not just trading — you’re outmaneuvering the mob and stacking wins while they’re still waiting for confirmation. This isn’t luck. It’s leverage. Use it.
Look at how well the VantagePoint A.I. Daily Range Forecast anticipated every single day’s trading range very effectively.
Intermarket Analysis
Intermarket analysis is the study of how different markets — such as stocks, bonds, commodities, and currencies — interact and influence one another. For traders, it reveals the correlations, lead-lag relationships, and capital flows that can signal shifts in price direction before they appear on a single asset’s chart. By understanding these cross-market dynamics, traders gain a broader, more predictive view of market behavior, improving timing, risk management, and trade selection.
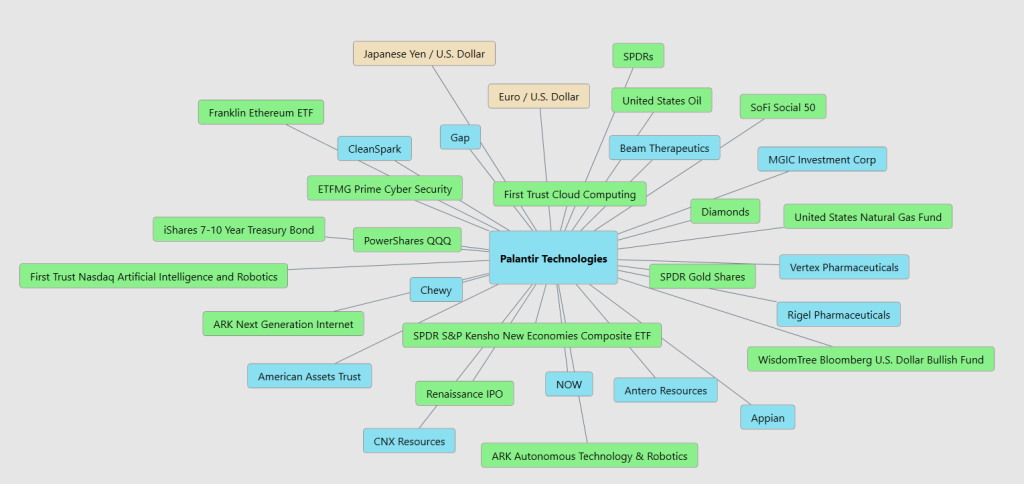
Let’s pull back the curtain on Palantir ($PLTR) and the web of intermarket forces that shape its every move. The picture couldn’t be clearer: when the risk-on tech tide comes in, Palantir is one of the first ships to rise. Look at the cluster — QQQ, First Trust Cloud Computing, FT Nasdaq AI & Robotics, ARK Next Gen/Autonomous Tech, and ETFMG Prime Cyber Security. These are the pipelines of capital flowing straight into Palantir’s profit engines: A.I., data infrastructure, and mission-critical software. Add names like ServiceNow ($NOW) and Appian, and you’ve got a real-time read on enterprise budgets and digital transformation spend. When this group turns green, history says PLTR doesn’t just follow — it accelerates.
Now, let’s talk about the risk thermometer. Watch Renaissance IPO, SoFi Social 50, PowerShares QQQ, and even the Franklin Ethereum ETF. These are the pulse points of speculative capital. When money pours into fresh IPOs, momentum darlings, and crypto, investors are telling you one thing — they’re ready to pay for tomorrow’s growth today. That’s the same premium Palantir lives on. If these names are running, PLTR gets a valuation tailwind; if they stall, the market’s appetite for long-dated growth just shrank.
Then there’s the macro governor — iShares 7–10 Year Treasuries and the U.S. Dollar (via WisdomTree USD Bullish, plus EUR/USD and JPY/USD). Higher yields and a rising dollar are like sand in the gears for growth stocks — they raise discount rates and crimp international deal flow. A softer dollar and easing yields? That’s like cutting the chains — risk budgets expand, and discounted cash-flow names like PLTR get lifted higher. Old truth, new market: rates and the greenback still set the table.
Don’t ignore the commodity compass — U.S. Oil, U.S. Natural Gas Fund, and Gold ($GLD). Surging energy can trigger inflation fears and rate hikes — bad news for long-duration software. Gold strength often signals a move to risk-off positioning. Sustained risk-off flows pull money out of premium A.I. software plays like Palantir and into defensives, which can compress multiples fast.
Finally, the sector-rotation radar — Diamonds (DOW), SPDRs (broad market), and standouts like Vertex, Rigel, Chewy, Gap, CleanSpark. These aren’t Palantir clones; they’re money-flow beacons. When the market rotates into cyclical value or healthcare, growth software can lag. When it swings back into high-beta tech and automation, Palantir’s order book and its multiple both get a boost.
Bottom line: Palantir is a pure A.I. software story, but its stock price is written by the broader ecosystem. Tech ETF inflows, enterprise software strength — tailwind. Rising yields, strong dollar — headwind. Keep these clusters in sight and you won’t just follow PLTR’s moves, you’ll predict them, before they even hit the tape.
Our Suggestion
Alright, here’s the straight talk on Palantir ($PLTR):
They just pulled off their first-ever billion-dollar quarter and cranked up their full-year forecast. Wall Street didn’t just nod — they raced to bump their targets. Why? Because AIP is rolling out in the real world, solving problems, and printing results.
The U.S. Army just locked them in for up to $10 billion over the next decade. That’s 75 separate contracts bundled into one monster agreement. It’s not just business; it’s a moat you could sail an aircraft carrier through.
The market’s cheering. New record highs, leadership across every time frame, and analysts lining up to call Palantir a clear A.I. winner. Momentum plus validation is a dangerous combo — if you’re on the other side of the trade.
When I say they’re crushing revenue and earnings, I’m not throwing confetti. This is a business hitting its stride because AIP is moving clients from “let’s test it” to “we can’t operate without it.” U.S. commercial growth is on fire, government relationships are expanding, and the quality of those dollars is going up. Fatter margins, cleaner revenue, stronger cash flow — this is what happens when you’re not just in the right place at the right time… you’re the one building the place.
Now the last two earnings calls — they were a masterclass in focus. Management didn’t sound like they were selling software. They sounded like they were running essential infrastructure. The tone was confident; the message was simple: AIP isn’t an experiment — it’s already working. They talked acceleration, standardization, and cutting deployment times so deals close faster and customers scale sooner.
Are they delivering? On the big goals — absolutely. U.S. commercial is exploding, the government side is now fortified for years, and they’re turning A.I. buzz into hard, contracted revenue. The one frontier still in play? Expanding that same momentum overseas. But with the Army deal locked and AIP demand snowballing, this is a company that’s not just meeting its goals — it’s stacking the deck in its favor.
Bottom line: Palantir has graduated from “potential” to “proven.” They’ve got the high ground at the intersection of defense, data, and deployable A.I. and they’re not giving it up anytime soon. The market knows it. Smart money knows it. The only question is whether you see it in time.
We suggest you place $PLTR on your trading radar. They are one of the huge beneficiaries of the recent boom.
Use the VantagePoint Daily Range forecast to locate short term trading opportunities.
Practice good money management on all your trades.
It’s not magic.
It’s machine learning.
Disclaimer: THERE IS A HIGH DEGREE OF RISK INVOLVED IN TRADING. IT IS NOT PRUDENT OR ADVISABLE TO MAKE TRADING DECISIONS THAT ARE BEYOND YOUR FINANCIAL MEANS OR INVOLVE TRADING CAPITAL THAT YOU ARE NOT WILLING AND CAPABLE OF LOSING.
VANTAGEPOINT’S MARKETING CAMPAIGNS, OF ANY KIND, DO NOT CONSTITUTE TRADING ADVICE OR AN ENDORSEMENT OR RECOMMENDATION BY VANTAGEPOINT AI OR ANY ASSOCIATED AFFILIATES OF ANY TRADING METHODS, PROGRAMS, SYSTEMS OR ROUTINES. VANTAGEPOINT’S PERSONNEL ARE NOT LICENSED BROKERS OR ADVISORS AND DO NOT OFFER TRADING ADVICE.


