




This week’s AI stock spotlight is ROKU ($ROKU)
The most important fact about Roku today is not its streaming devices, its advertising platform or even its improving profitability.
Fox has agreed to acquire the company.
Fox and Roku announced a definitive acquisition agreement on June 15, 2026, valuing Roku at approximately $22 billion in enterprise value. The transaction was announced at $160 per Roku share, but there is an important distinction for traders: this is not a $160 all-cash offer.
Roku shareholders are expected to receive $96 in cash plus 0.9693 shares of Fox Class A stock for each Roku share. At the reference price when the transaction was announced, the Fox shares were worth approximately $64, producing the $160 headline valuation.
That distinction matters enormously.
Roku is no longer trading solely on earnings, advertising growth or expectations for the streaming market. It is increasingly a merger security whose value depends on Roku’s underlying business, the price of FOXA, the probability that the transaction closes and the amount of time required to get there.
The transaction is expected to close in the first half of 2027, assuming the necessary approvals and closing conditions are satisfied. Because roughly 40% of the original consideration came in Fox stock, the actual value of the transaction can move above or below $160 as FOXA moves.
Traders should therefore not treat $160 as a guaranteed future price for Roku.
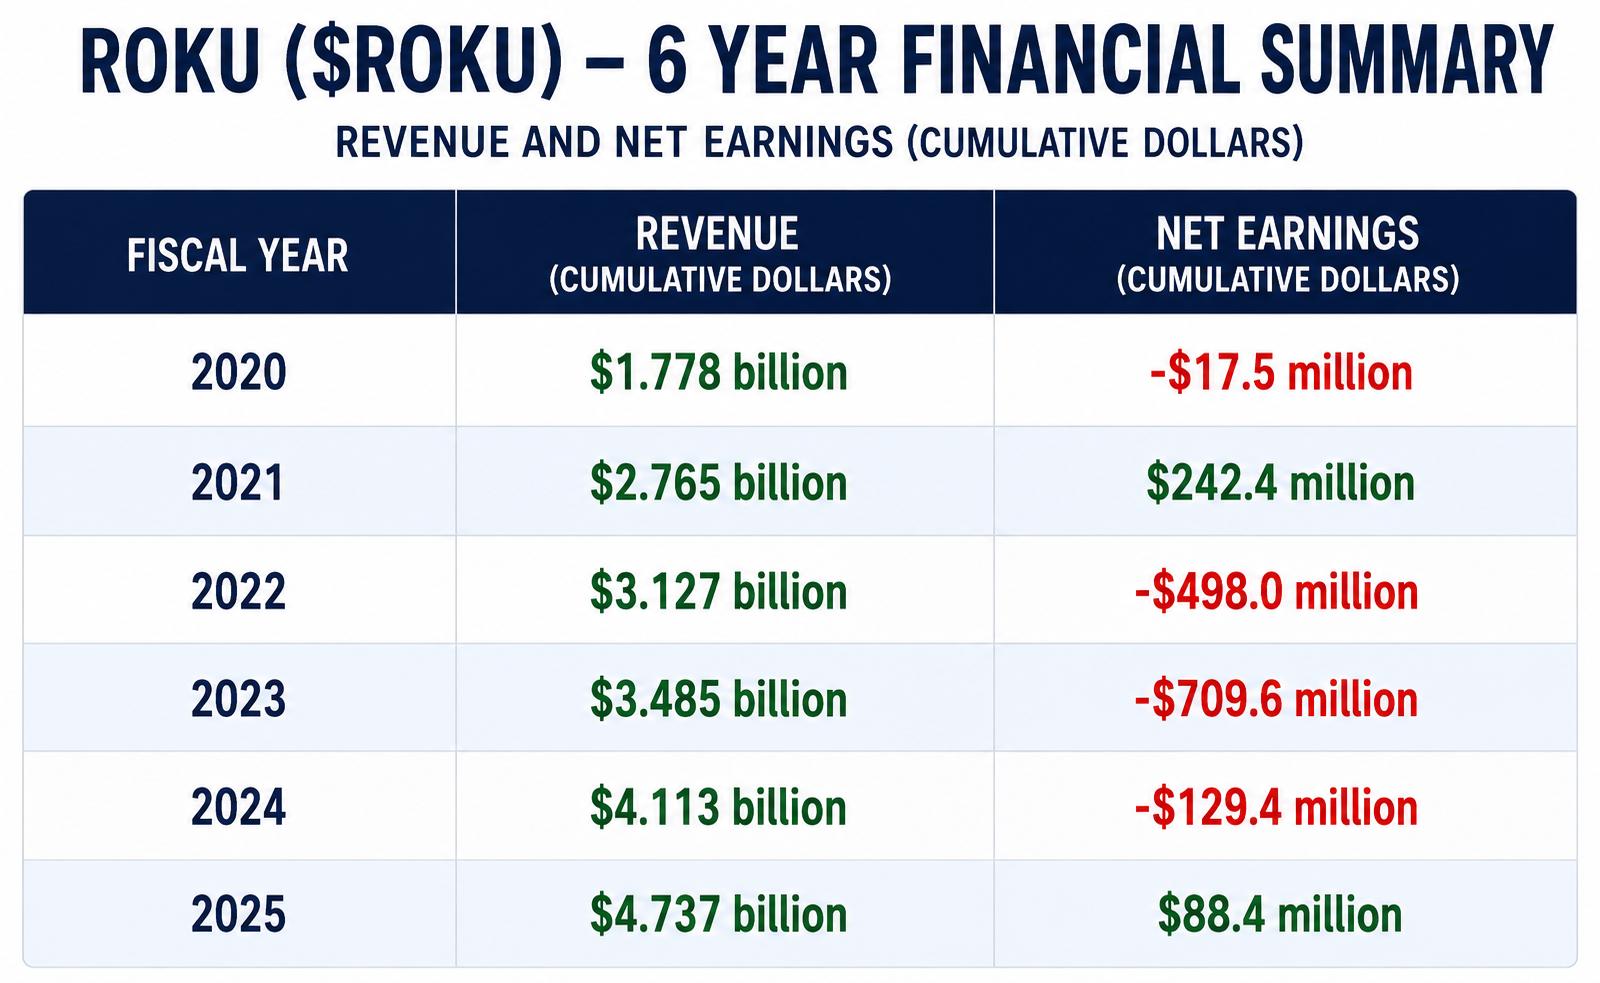 Roku’s numbers tell the story of a company that learned how to grow long before it learned how to make money.
Revenue climbed steadily from $1.78 billion in 2020 to $4.74 billion in 2025, while profits wandered around like a tourist without a map, including a spectacular $710 million loss in 2023.
But something important finally changed.
Losses collapsed in 2024, and Roku returned to an $88 million profit in 2025. Revenue growth was never Roku’s problem. The question was whether management could turn all those streaming households and advertising dollars into actual earnings.
For the first time in several years, the answer appears to be yes.
That is the underlying story traders should not overlook. Fox is not buying yesterday’s Roku. It is attempting to acquire Roku just as the economics of the business appear to be improving materially.
For years, Roku’s investment case rested heavily on scale. Get Roku into more households. Increase streaming hours. Build the advertising platform. Monetize the audience later.
The problem is that “later” has financed a great many disappointing technology stocks.
Roku is finally beginning to provide evidence that scale can translate into profits and free cash flow.
That also explains why Roku’s rally cannot simply be attributed to the Fox announcement. The stock had already been appreciating as investors recognized improving profitability, stronger advertising economics and better cash generation. Fox then placed a very large price tag on those improving economics.
The opportunity from here is straightforward.
Roku’s underlying business could continue strengthening while the transaction works its way toward completion. If Platform revenue maintains strong growth, advertising remains healthy and margins continue expanding, the market may conclude that Fox acquired Roku at an attractive point in its earnings cycle.
But from here forward, the risk is different.
Between now and the expected closing, Roku effectively becomes two investments wrapped inside one ticker symbol.
There is still the Roku business.
But sitting on top of it is a merger trade.
The first variable traders need to watch is FOXA. Because shareholders are expected to receive $96 in cash plus 0.9693 FOXA shares, Roku’s ultimate deal value moves with Fox’s stock price.
If FOXA rises, the value of the consideration rises.
If FOXA falls, it falls.
That means Roku traders suddenly have another stock to watch. FOXA now matters almost as much as ROKU.
The second variable is deal probability.
Between now and closing, the transaction must work through regulatory review, shareholder approval and the other required closing conditions. Good news on those fronts can increase confidence in completion and potentially narrow the merger spread.
Bad news can do precisely the opposite.
A regulatory challenge, unexpected delay, shareholder resistance or another development that causes investors to question whether the transaction will close could cause that spread to widen quickly.
Then there is time.
The transaction is not expected to close until the first half of 2027. Every additional month creates another opportunity for something to change. Fox shares can rise or fall. Roku’s business can strengthen or weaken. Markets can change. Regulators can create delays.
That is why a merger spread exists in the first place.
Investors are being compensated for waiting and accepting uncertainty.
But there is an even more important question every Roku trader should ask:
What is Roku worth if the Fox deal never closes?
Before the acquisition announcement, traders worried primarily about advertising demand, competition, losses and Roku’s ability to monetize its enormous installed base. Those risks did not disappear simply because Fox arrived with a checkbook.
If the transaction fails, Roku could quickly stop trading as a merger security and return to trading on its standalone revenue, earnings, cash flow, growth prospects and valuation.
That creates an asymmetry traders need to understand.
The remaining upside to the transaction may be relatively easy to calculate based on the current value of the cash-and-stock consideration. But the downside from a failed transaction could be considerably larger if the market believes Roku’s standalone value is substantially below the prevailing price.
There is, however, an important counterweight.
Roku’s underlying business appears to be improving while everyone waits.
If revenue continues growing, margins expand, profitability improves and free cash flow strengthens, Roku’s standalone value could potentially increase while the transaction moves toward completion.
That could become increasingly important if anything threatens the deal.
So the conclusion on Roku is very different from what it would have been six months ago.
Roku has improving fundamentals, expanding cash generation, strong price momentum and a strategic buyer. Those are powerful tailwinds.
But Fox’s acquisition agreement has transformed the nature of the trade.
From here forward, traders should watch ROKU, FOXA, the value of the merger consideration, the merger spread, regulatory progress and Roku’s underlying operating performance.
The central question is no longer simply:
How valuable can Roku become?
It is:
What is Fox’s offer worth today? How likely is the transaction to close? How long will shareholders have to wait? And what could Roku be worth if the deal doesn’t happen?
That is the new risk-reward equation.
In this analysis, we will review and evaluate forecasts using the following set of indicators and tools.
Wall Street Analysts Ratings and Forecasts
52 Week High and Low Boundaries
Best-Case / Worst-Case Scenario Analysis
VantagePoint AI Triple Cross Indicator
Neural Network Forecast (Machine Learning)
VantagePoint AI Daily Range Forecast
Intermarket Analysis
Our Suggestion
Wall Street Analysts Price Forecasts
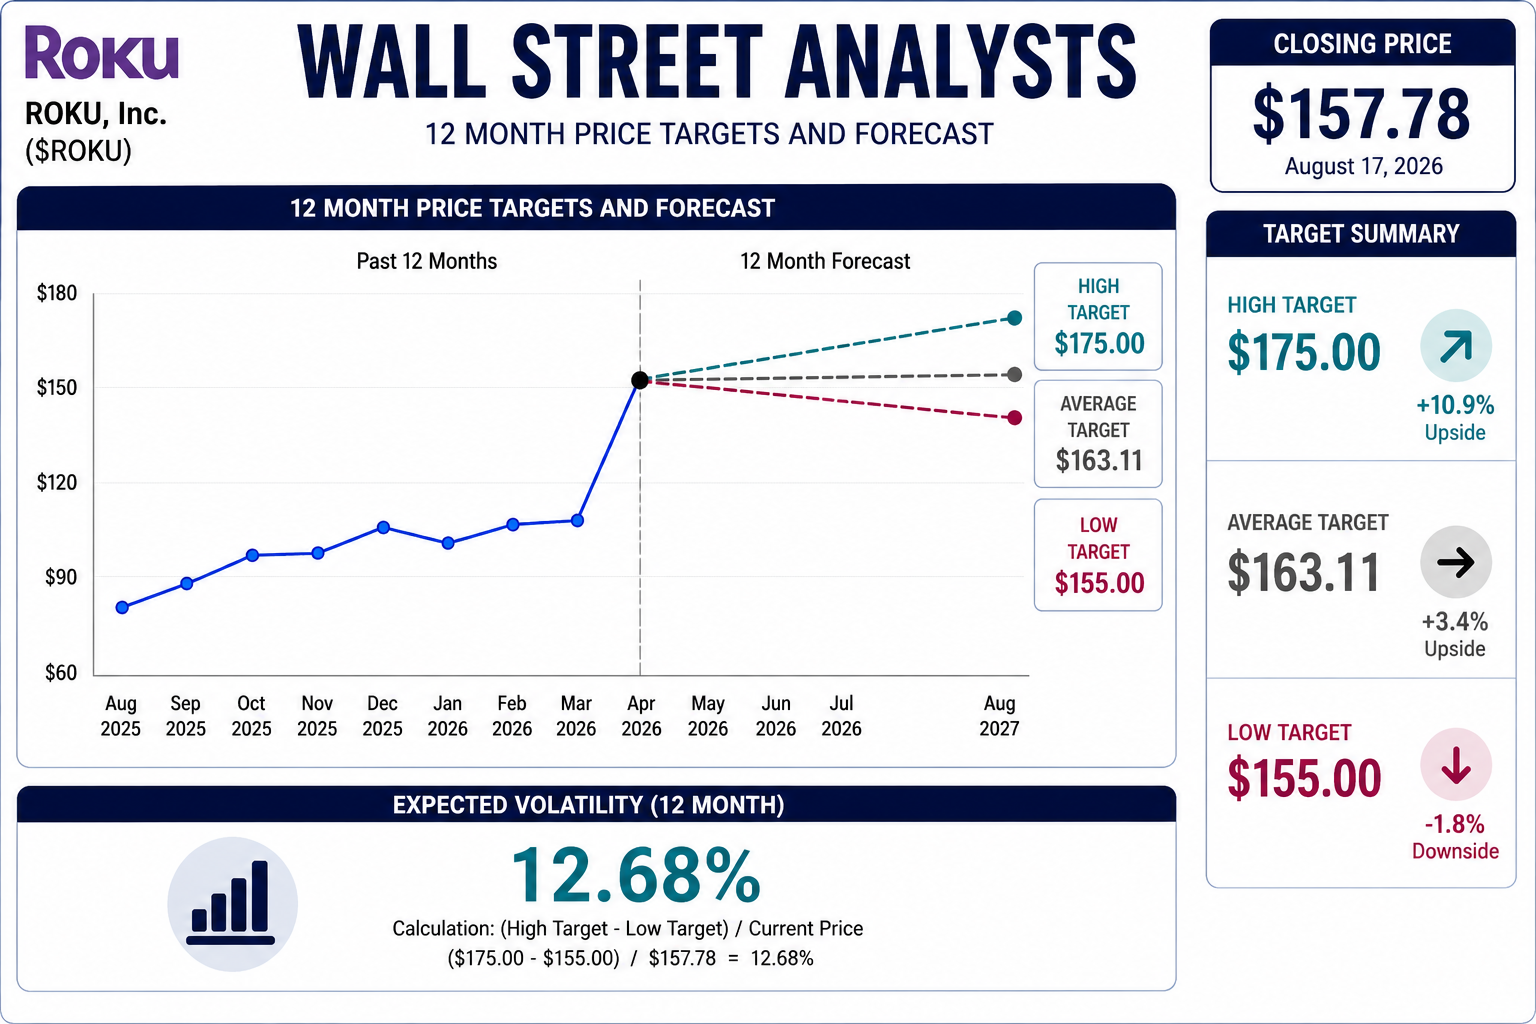
Wall Street’s expectations for Roku are unusually compressed, and the reason is straightforward: Fox has agreed to acquire Roku in a transaction initially valued at $160 per share. With Roku trading at $157.78, the buyout has created a powerful valuation anchor around the stock.
That explains why analyst forecasts are packed into such a narrow range. The average 12-month target is $163.11, the high target is $175, and the low target is $155. The difference between the highest and lowest forecasts produces expected volatility of just 12.68%. For a stock as historically volatile as Roku, that would normally be remarkable. With a pending acquisition, it makes perfect sense.
The important detail is that Fox’s offer is not simply $160 in cash. The announced consideration consists of $96 in cash plus 0.9693 shares of FOXA for each Roku share. That means the ultimate value of the transaction moves with Fox’s stock price. Roku can therefore trade above or below the original $160 headline value as investors continually recalculate what the deal is worth and the probability that it closes.
For traders, this means the narrow analyst forecast range should not be interpreted as Wall Street suddenly reaching perfect agreement about Roku’s long-term prospects. The compression largely exists because the Fox acquisition has put a valuation anchor on the stock. Unless something changes with the transaction, Roku’s price is likely to remain heavily influenced by the changing value of the Fox consideration and the market’s assessment of deal risk.
Analysts can still debate Roku’s advertising growth, margins and future cash flow. But for the moment, Fox has put a price tag on the company. And that price tag is helping keep Wall Street’s forecasts unusually close together.
52-Week High and Low Boundaries
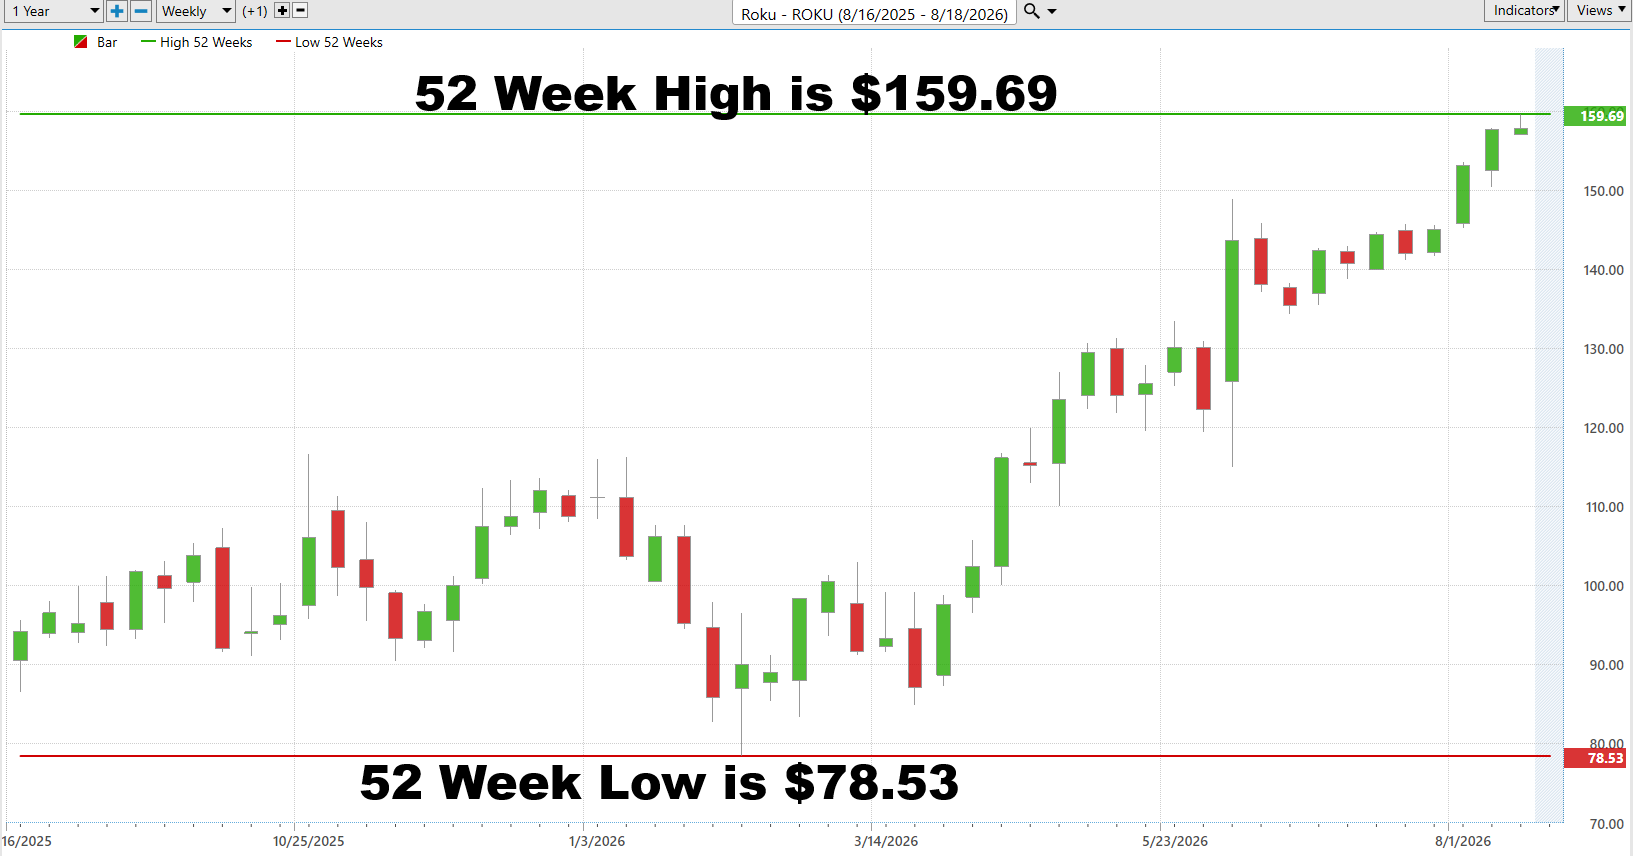
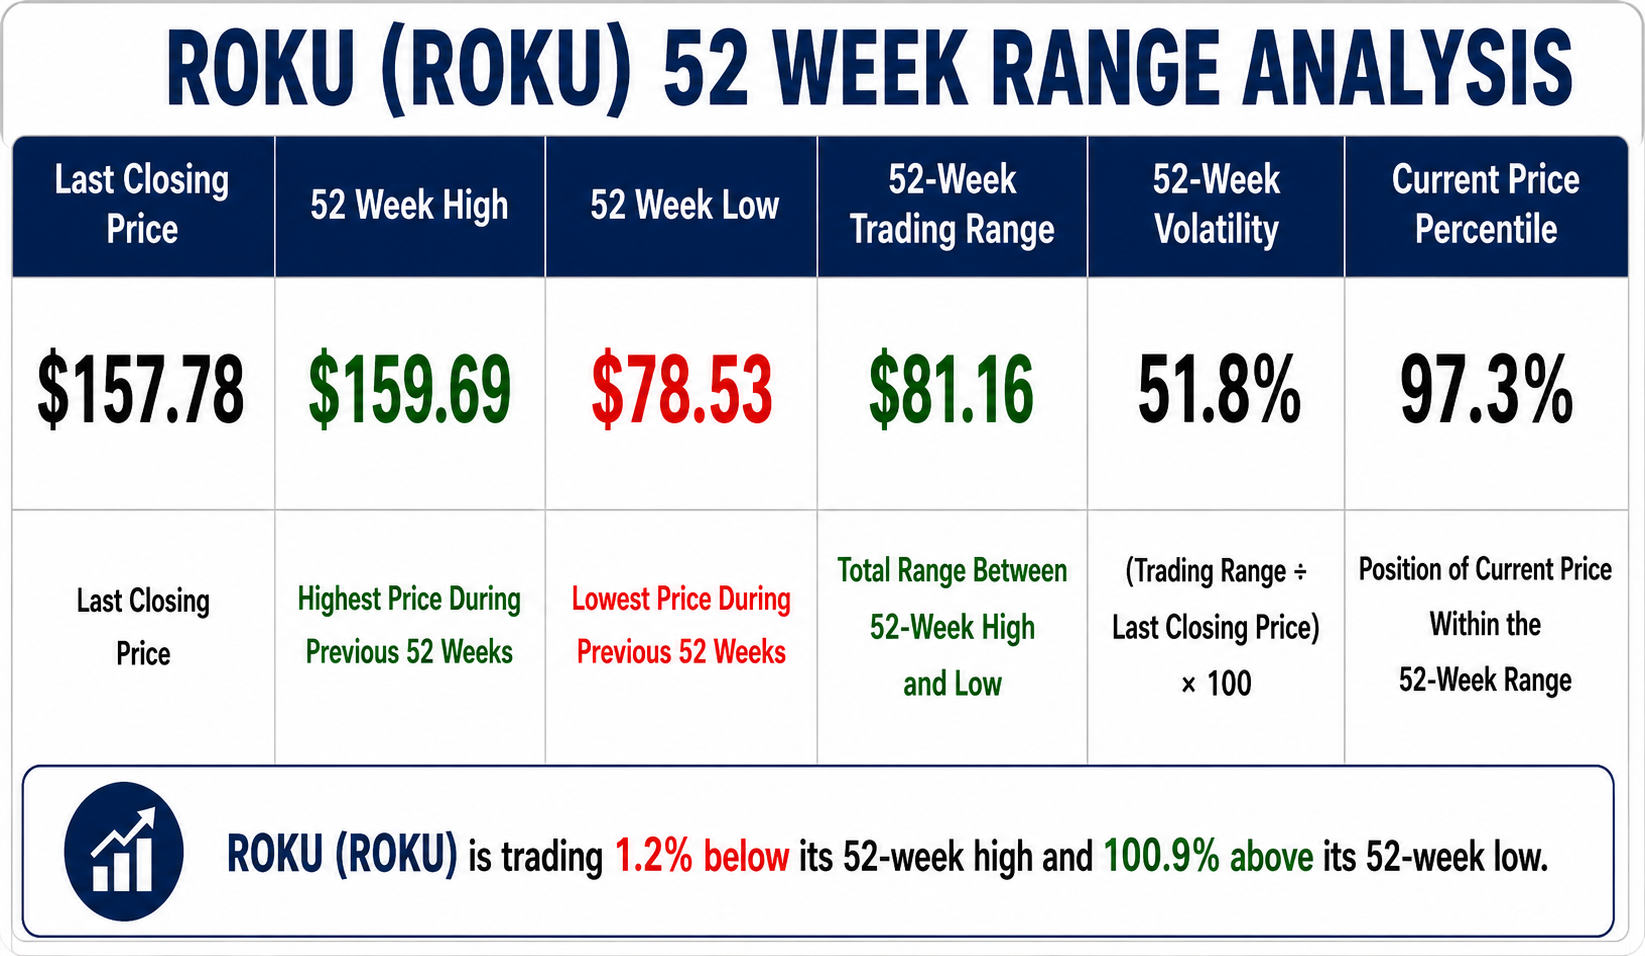 The 52-week chart of Roku tells a story traders should not ignore. The stock has traveled from a 52-week low of $78.53 to a high of $159.69, an enormous range of $81.16. At the $157.78 close shown in the analysis, Roku sits just 1.2% below its 52-week high and roughly 100.9% above its 52-week low.
That matters because the 52-week high and low are not just trivia for financial websites. They are boundaries that tell you where buyers and sellers have fought their biggest battles. The low shows where the market finally decided Roku was cheap enough. The high tells you where buyers have been willing to pay more than at almost any other time during the past year.
Now look at the chart. Roku spent much of late 2025 and early 2026 bouncing around between roughly $85 and $115. There was plenty of motion, but very little progress. Then something changed. Beginning in the spring, the stock started producing a clear sequence of higher highs and higher lows. Roku moved through $100, $120, $140 and eventually approached $160. That’s demand.
Roku’s position inside its annual range makes that message difficult to miss. At $157.78, the stock sits in approximately the 97th percentile of its 52-week range. In plain English, Roku has climbed through almost its entire annual trading range and is now knocking on the ceiling.
The important question is what happens at $159.69.
If Roku can decisively move through that boundary and hold above it, the old 52-week high can change from resistance into potential support. More important, there is no longer any overhead resistance from traders who bought Roku at higher prices during the previous 52 weeks. The stock enters price-discovery territory, where the market has to decide how much buyers are willing to pay next.
But don’t confuse strength with safety. Roku’s 52-week trading range represents approximately 51.8% of its closing price. This is a volatile stock. It can move quickly in both directions, and a failed breakout near $159.69 would deserve attention. A move above the high followed by an immediate retreat back inside the range would suggest buyers could not maintain control.
So keep this simple.
$159.69 is the line in the sand.
Above it, Roku is making new 52-week highs and confirming that buyers remain in command. Below it, particularly if price begins producing lower highs and breaking important predictive support levels, the character of the move begins to change.
Don’t argue with a stock because it looks expensive.
Watch the boundaries. Watch how price behaves when it reaches them. And make the market prove that the trend has changed before betting against strength.
Best-Case/Worst-Case Scenario Analysis
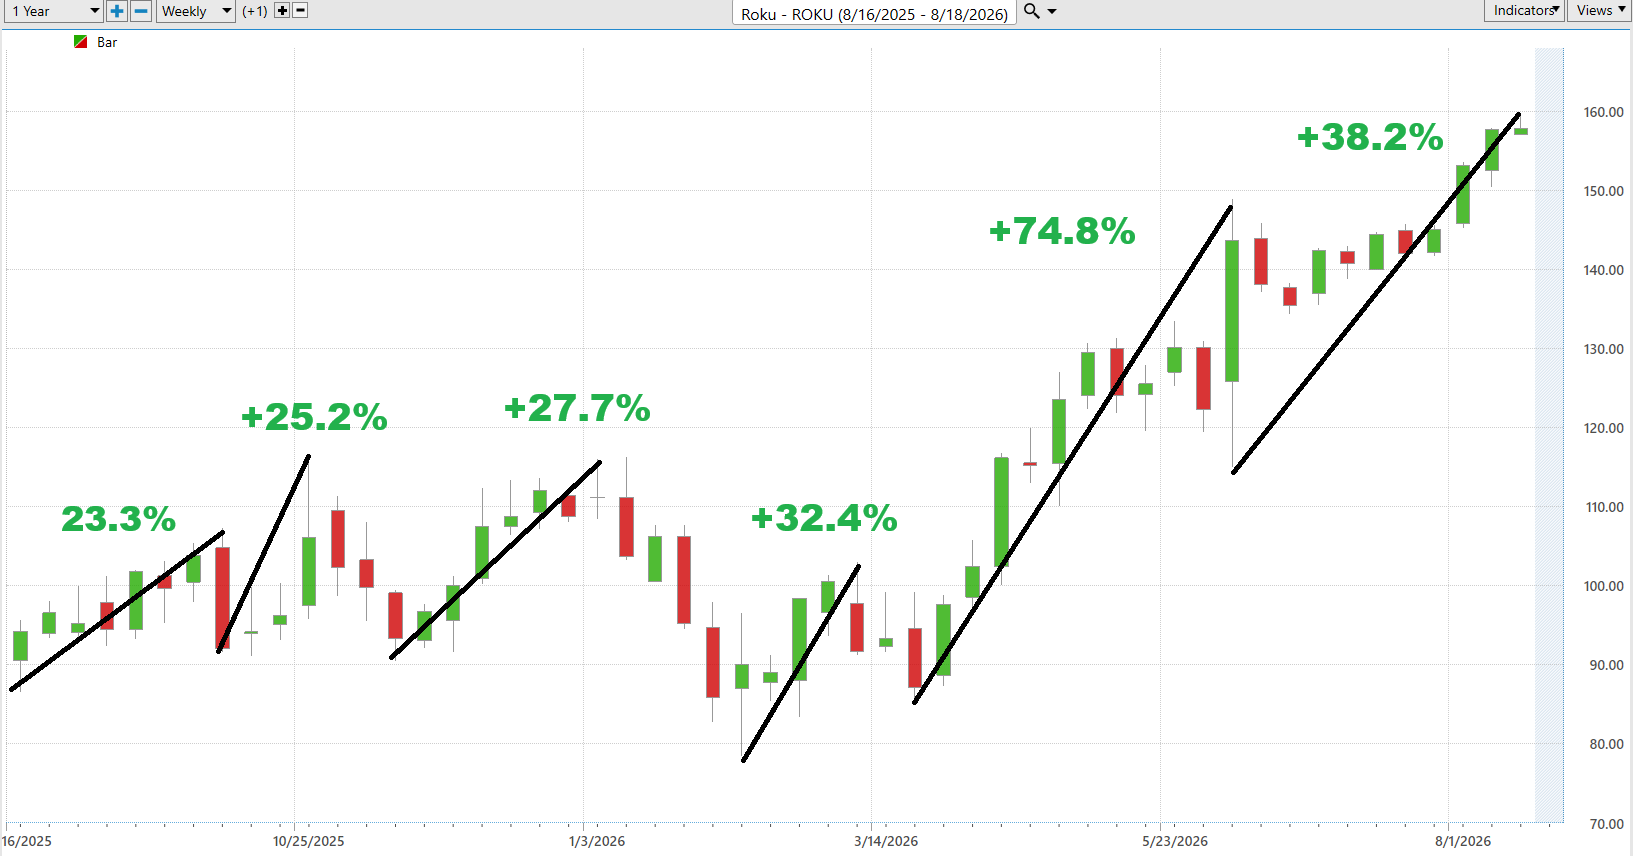
Volatility is very poorly understood by traders. It is not theoretical. It is what a stock has actually demonstrated it can do with real money in the real market. One of the fastest ways to understand Roku’s real-world risk and opportunity is to measure its largest uninterrupted rallies and declines over the past 52 weeks. On the upside, Roku’s significant rallies have ranged from approximately +23% to +75%, with the largest advance reaching +74.8%. That tells us immediately that when momentum takes hold, Roku is capable of producing exceptionally large upside moves.
Now look at the other side of the equation. Roku’s significant uninterrupted declines have ranged from approximately -12.5% to -32.1%, with the largest drawdown wiping out nearly one-third of the stock’s value. That’s the price traders have historically paid for Roku’s upside potential. A stock capable of producing 30%, 40% and even 75% advances does not hand out those returns without considerable volatility along the way. Roku’s history says that a trader pursuing its upside must also be prepared for double-digit corrections when momentum turns.
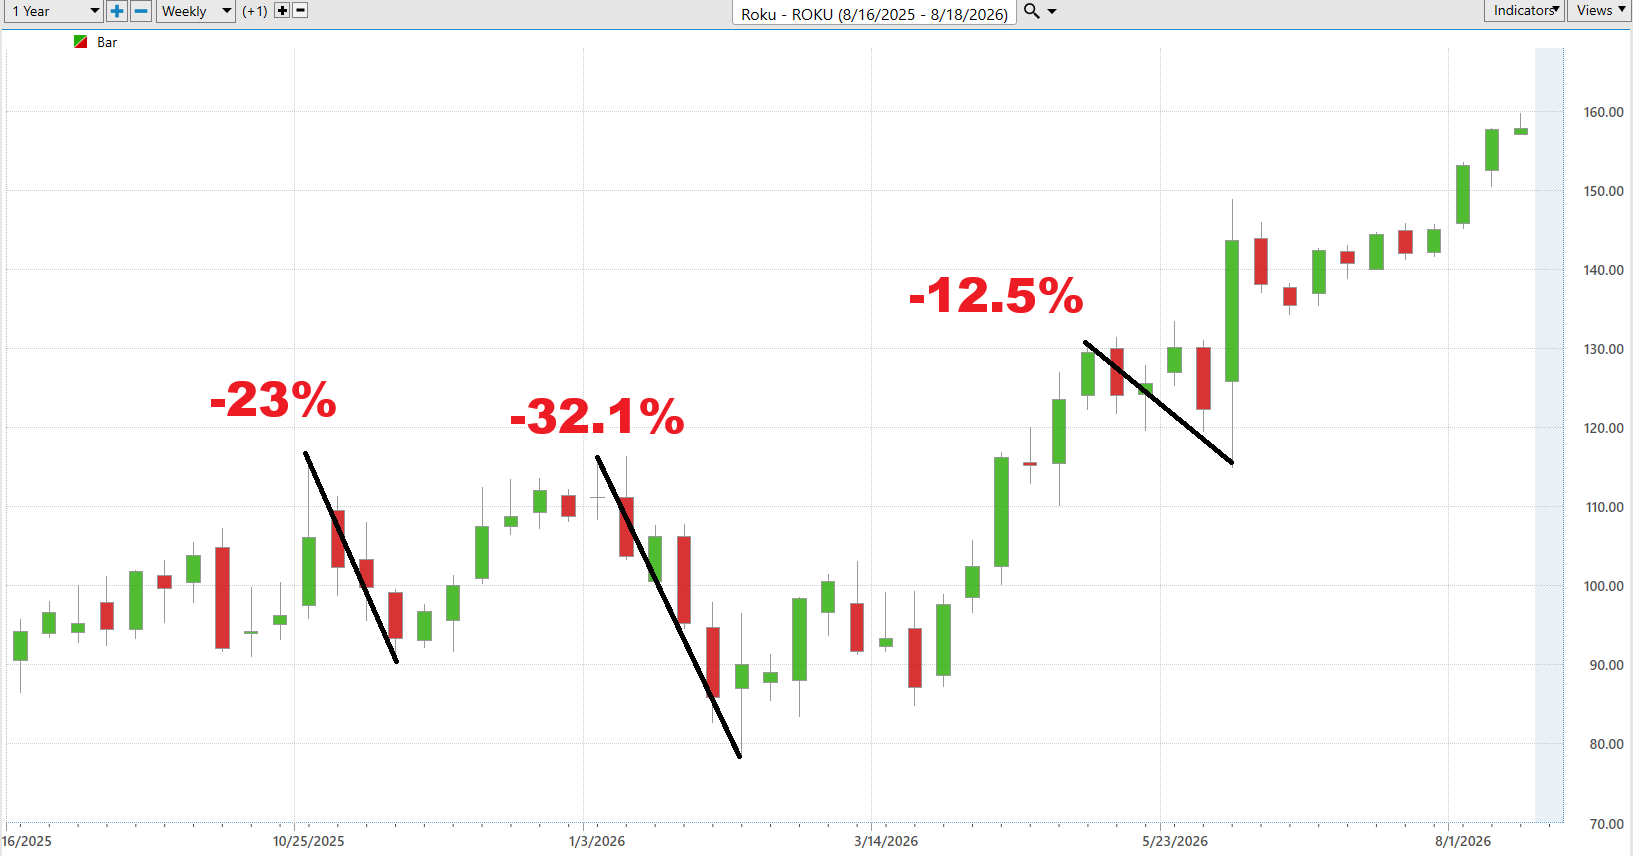
This is where the exercise becomes useful. Roku’s historical upside has been considerably larger than its downside, creating an attractive historical risk/reward profile, but only for traders who size positions appropriately and respect the volatility. The objective is not to predict another 75% rally or 32% decline. It is to understand the range of outcomes Roku has already demonstrated, establish realistic expectations, and watch whether the current trend continues to confirm strength or begins showing evidence that sellers are taking control. If you cannot handle the worst-case scenario, you have no business chasing the best-case outcome.
Next we compare the performance of $ROKU to the broader stock market averages.
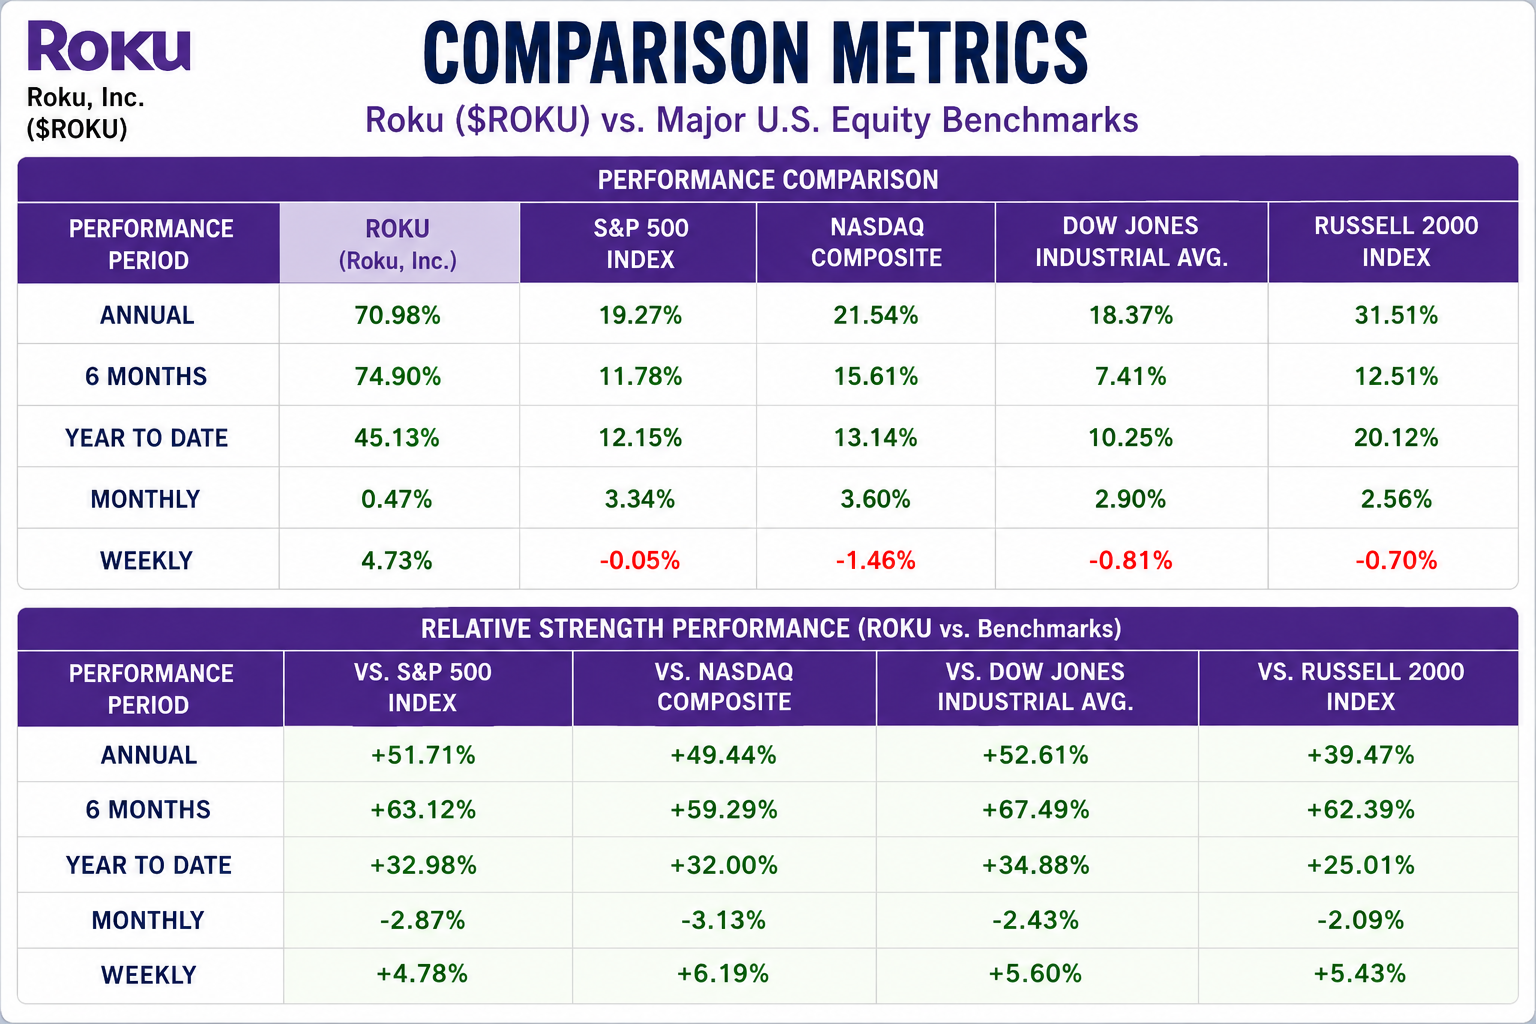
Roku’s longer-term relative strength is difficult to ignore. Over the past year, the stock gained 70.98%, compared with 19.27% for the S&P 500, 21.54% for the Nasdaq Composite, 18.37% for the Dow, and 31.51% for the Russell 2000. That translates into outperformance of 51.71 percentage points versus the S&P 500 and 49.44 points versus the Nasdaq. Even against the stronger Russell 2000, Roku leads by 39.47 points. This is not simply a rising stock benefiting from a rising market. Roku has been a clear market leader.
The six-month numbers are even more impressive. Roku advanced 74.90%, while the S&P 500 gained only 11.78% and the Nasdaq 15.61%. That gives Roku relative-strength advantages of 63.12 percentage points versus the S&P 500 and 59.29 points versus the Nasdaq. Year to date, Roku is up 45.13%, compared with 12.15% for the S&P 500, an advantage of 32.98 percentage points. When a stock beats every major benchmark by this magnitude across multiple long-term time frames, traders should pay attention. Leadership this broad is rarely an accident.
There is, however, one important wrinkle in the numbers. Over the past month, Roku gained only 0.47%, trailing the S&P 500’s 3.34%, the Nasdaq’s 3.60%, the Dow’s 2.90%, and the Russell 2000’s 2.56%. Roku’s monthly relative strength therefore turned negative across every benchmark. After such an extraordinary six-month advance, that could simply represent consolidation, but it is the one area of the scoreboard that deserves watching. The long-term trend remains powerful, but the stock temporarily surrendered leadership during the past month.
Then look at the most recent week. Roku gained 4.73% while every major benchmark declined. It outperformed the S&P 500 by 4.78 percentage points, the Nasdaq by 6.19 points, the Dow by 5.60 points, and the Russell 2000 by 5.43 points. That rebound in relative strength is significant because Roku didn’t merely rise with the market. It advanced while the broader market moved in the opposite direction.
The message from the comparison metrics is therefore straightforward. Roku remains an exceptional longer-term outperformer, experienced a noticeable loss of relative strength during the past month, and then reasserted leadership sharply during the latest week. For traders, the question is whether that weekly strength marks the beginning of another sustained period of outperformance. If the monthly relative-strength numbers turn positive again while the longer-term leadership remains intact, that would provide powerful confirmation that Roku’s leadership trend is continuing rather than fading.
VantagePoint AI Predictive Blue Line
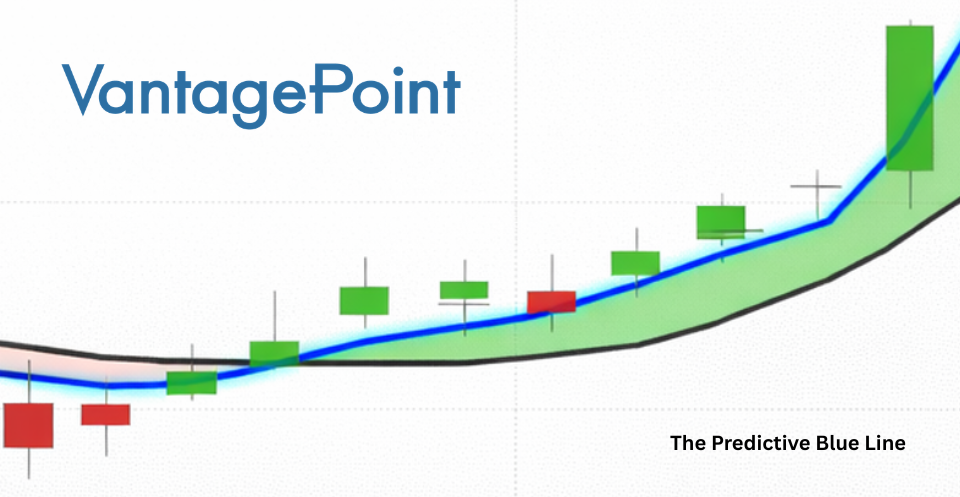
The Predictive Blue Line on Roku is sending a strongly bullish message. Since mid-June, the blue line has remained predominantly above the black actual moving average, while its slope has steadily moved higher. That combination tells us that VantagePoint’s artificial intelligence is forecasting higher average prices ahead. The most important feature is not simply that the line is blue. It is the direction of the slope and its relationship to the actual moving average that defines the trend.
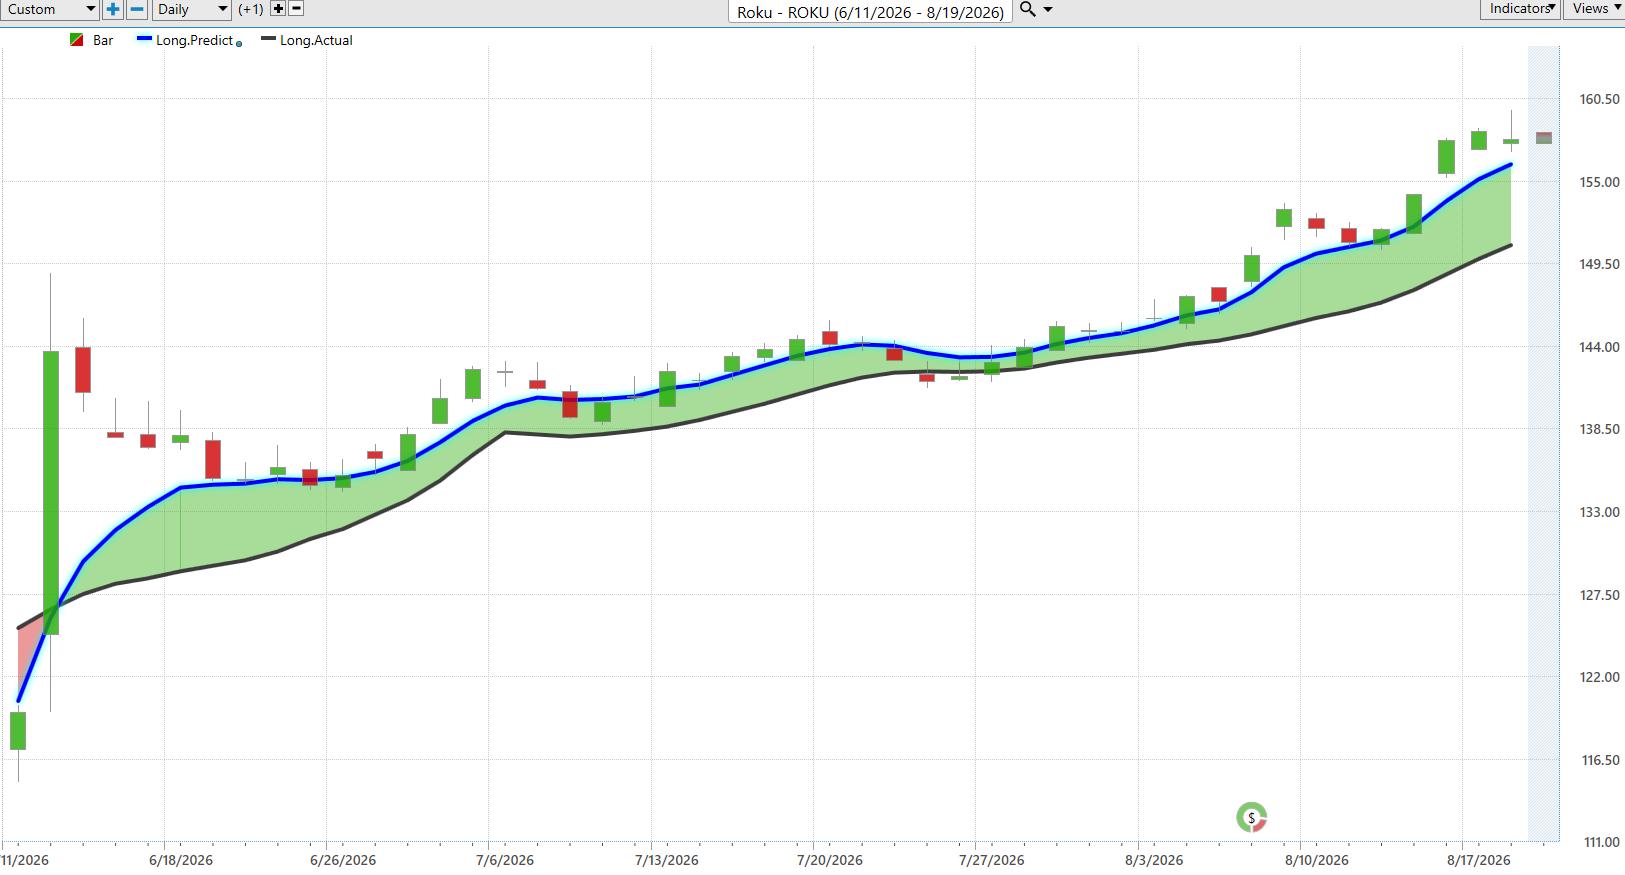
The chart also shows why the Predictive Blue Line can function as a value zone for traders. During Roku’s advance, price repeatedly pulled back toward the blue line before resuming higher. Instead of chasing green candles after a sharp rally, traders can watch for retracements toward the Predictive Blue Line while its slope remains positive. Those pullbacks can identify areas where the risk/reward becomes more attractive within an established uptrend.
What stands out now is the acceleration in the Predictive Blue Line during August. Roku pushed from the mid-$140s toward the upper $150s, and rather than flattening, the blue line steepened higher while maintaining separation above the black line. That is confirmation of trend strength. The green shaded area between the predictive and actual averages also remains intact, showing that the predictive trend continues to lead the slower historical trend.
For traders, the message is straightforward: the primary trend remains bullish until the indicators say otherwise. We want the Predictive Blue Line rising, price generally trading above it, and the blue line remaining above the actual moving average. A flattening blue line would be the first reason to become more cautious. A decisive rollover followed by the Predictive Blue Line crossing beneath the actual moving average would represent a much more meaningful warning that Roku’s trend is changing.
The Predictive Blue Line does not tell us how high Roku must go. It tells us which side of the market currently has the advantage. Right now, based on the attached chart, that advantage remains with the buyers.
VantagePoint AI Neural Index (Machine Learning)
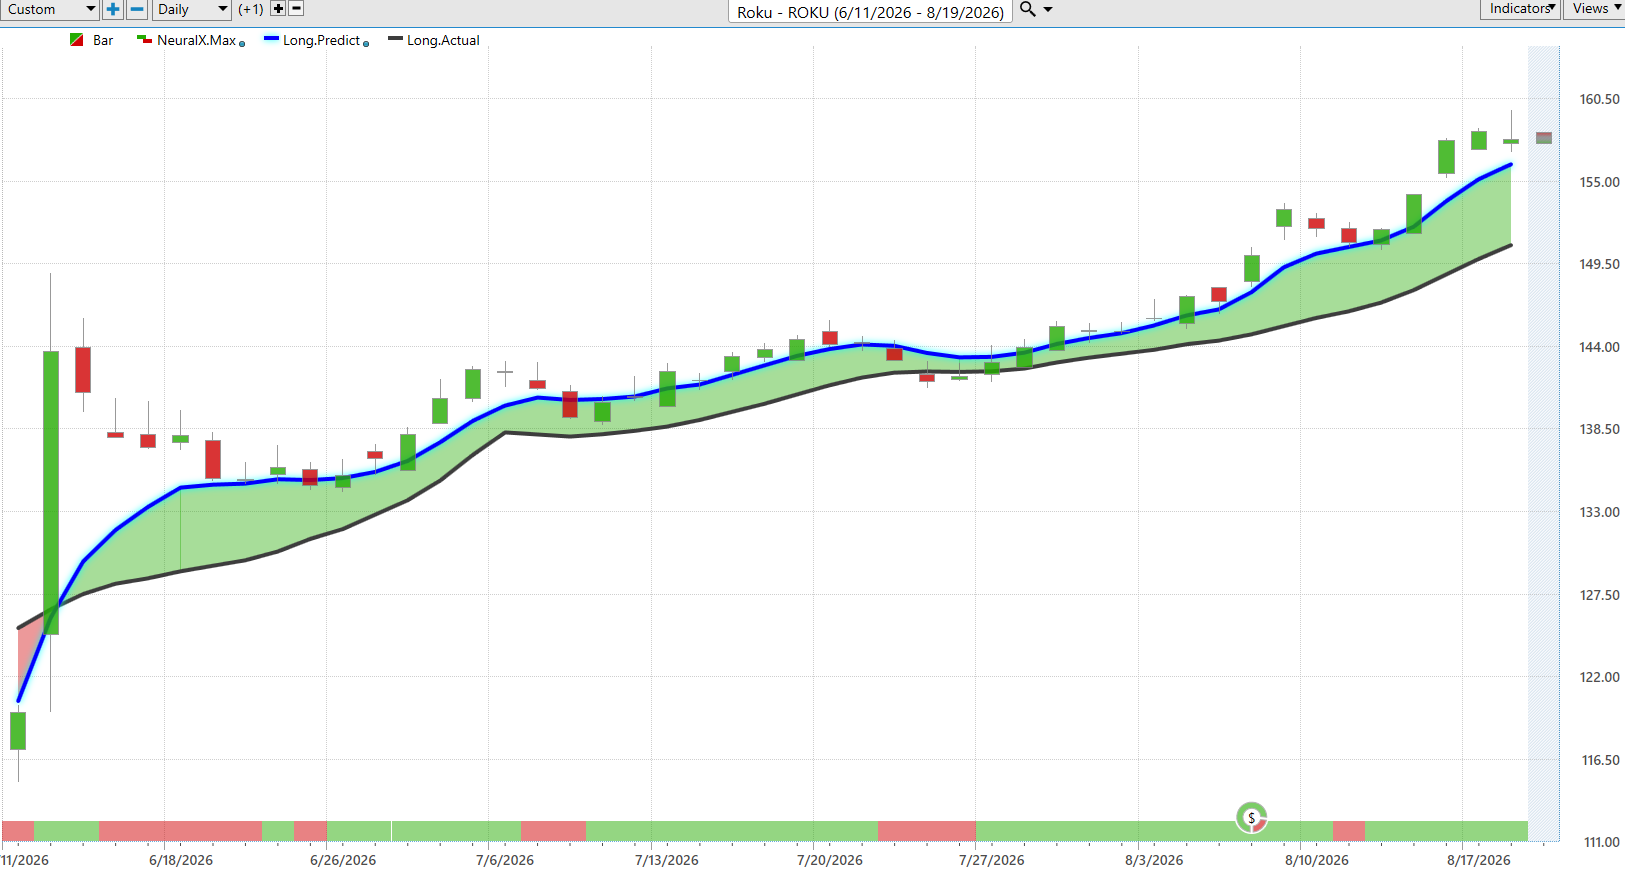
The Neural Index is the short-term confirmation tool in the VantagePoint forecast. It looks ahead roughly 48 to 72 hours and forecasts whether short-term market strength or weakness is expected. Green indicates expected strength. Red indicates expected weakness. The key is not to use it by itself, but to combine it with the direction of the Predictive Blue Line.
Look closely at Roku. The Neural Index has spent the majority of this chart green, particularly during the strongest portions of the advance. There have been brief red periods, including late June, early July, late July and again around mid-August. But those bearish readings were generally short-lived. They warned of temporary weakness without overturning the larger bullish trend.
This is where double confirmation becomes important. The Predictive Blue Line is above the black actual predictive moving average and is rising strongly. At the far right of the chart, the Neural Index is also green. When the longer-term predictive trend says up and the short-term Neural Index says strength, the two forecasts are confirming one another.
The red periods are equally useful. When the Neural Index turns red while the Predictive Blue Line remains bullish, we do not automatically assume the trend has reversed. Instead, it warns us that short-term weakness may be developing inside the larger uptrend. Those periods can help traders avoid chasing price and instead wait for the Neural Index to return to green before looking for renewed strength.
Right now, the message from Roku is straightforward. The Predictive Blue Line remains bullish and the Neural Index is green. That is double confirmation. The warning would come if the Neural Index begins producing sustained red readings while the Predictive Blue Line simultaneously flattens or turns lower. Until then, the artificial intelligence is continuing to forecast that buyers have the advantage.
VantagePoint AI Daily Range Forecast
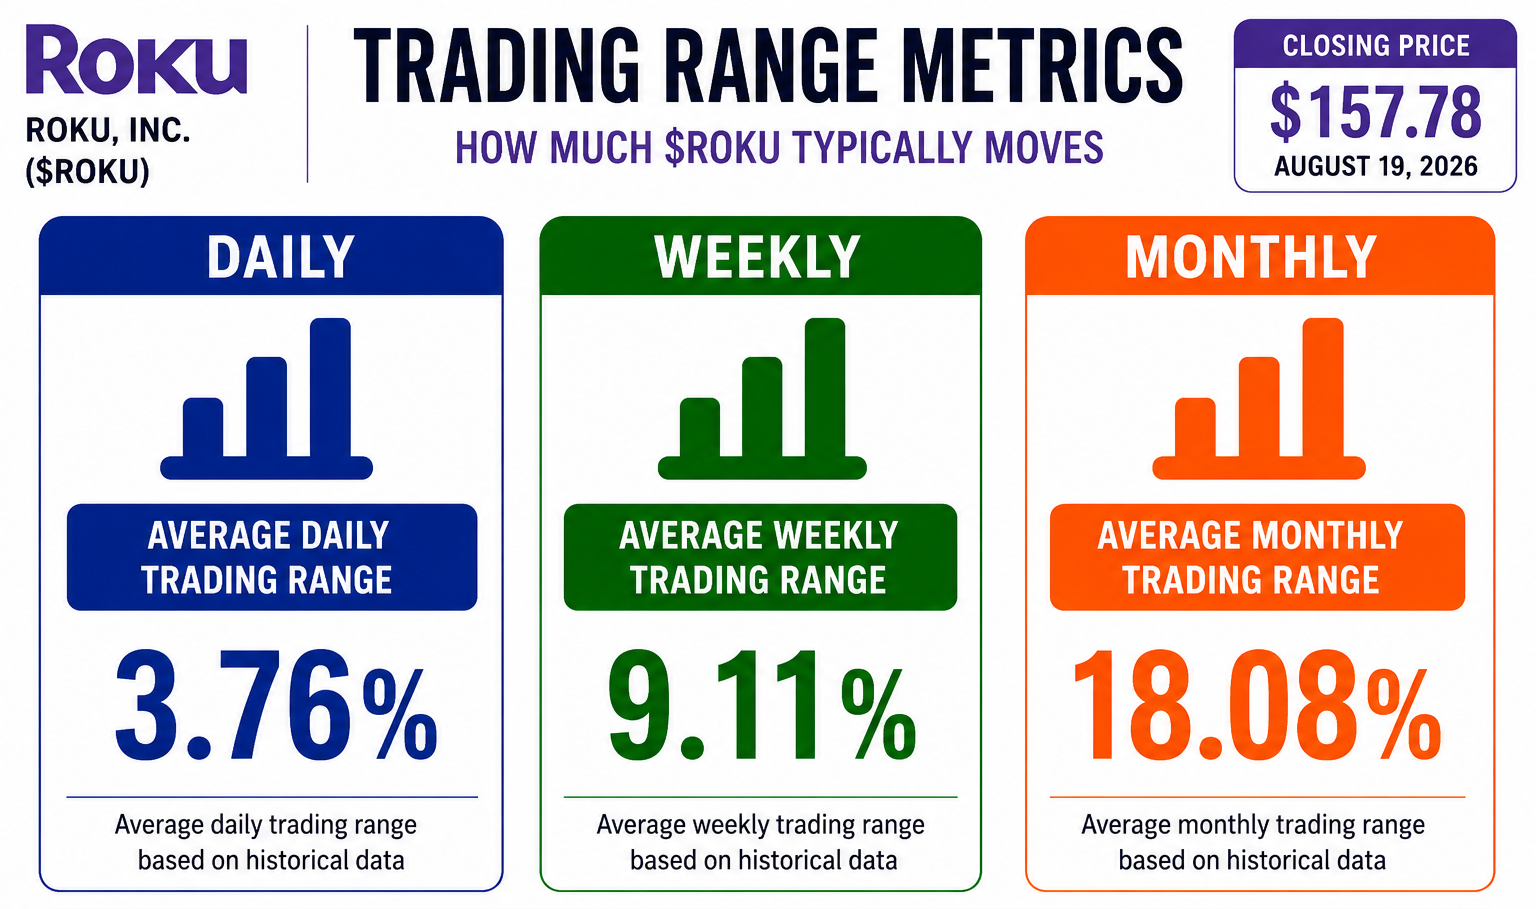
The Daily Range Forecast gives Roku traders something far more useful than another opinion about where the stock ought to go. It provides a forecast of the expected high and low trading boundaries for the next trading session. On the chart, the upper boundary tracks above price while the lower boundary tracks beneath it. Rather than predicting a single closing price, VantagePoint is identifying a probable trading zone where the next day’s battle between buyers and sellers may take place.
The chart shows those forecast boundaries rising steadily with Roku’s price, particularly since late July. That matters because the Daily Range Forecast is confirming what we are seeing in the Predictive Blue Line and Neural Index: the underlying trend remains bullish. Roku has advanced from roughly the low-$140s toward $158, while both forecast boundaries have continued moving higher. When tomorrow’s predicted range keeps being recalculated at progressively higher levels, the artificial intelligence is effectively saying that the market’s expected value zone is moving higher with the stock.
This becomes particularly valuable for entries. A bullish trader does not necessarily want to buy Roku after a sharp move toward the predicted high. That is where the day’s upside opportunity may already be partially exhausted. Instead, when the larger trend remains bullish, traders can use weakness toward the predicted low as a potential area to look for opportunity. The objective is simple: buy closer to the lower boundary of the forecast rather than chase price near the upper boundary.
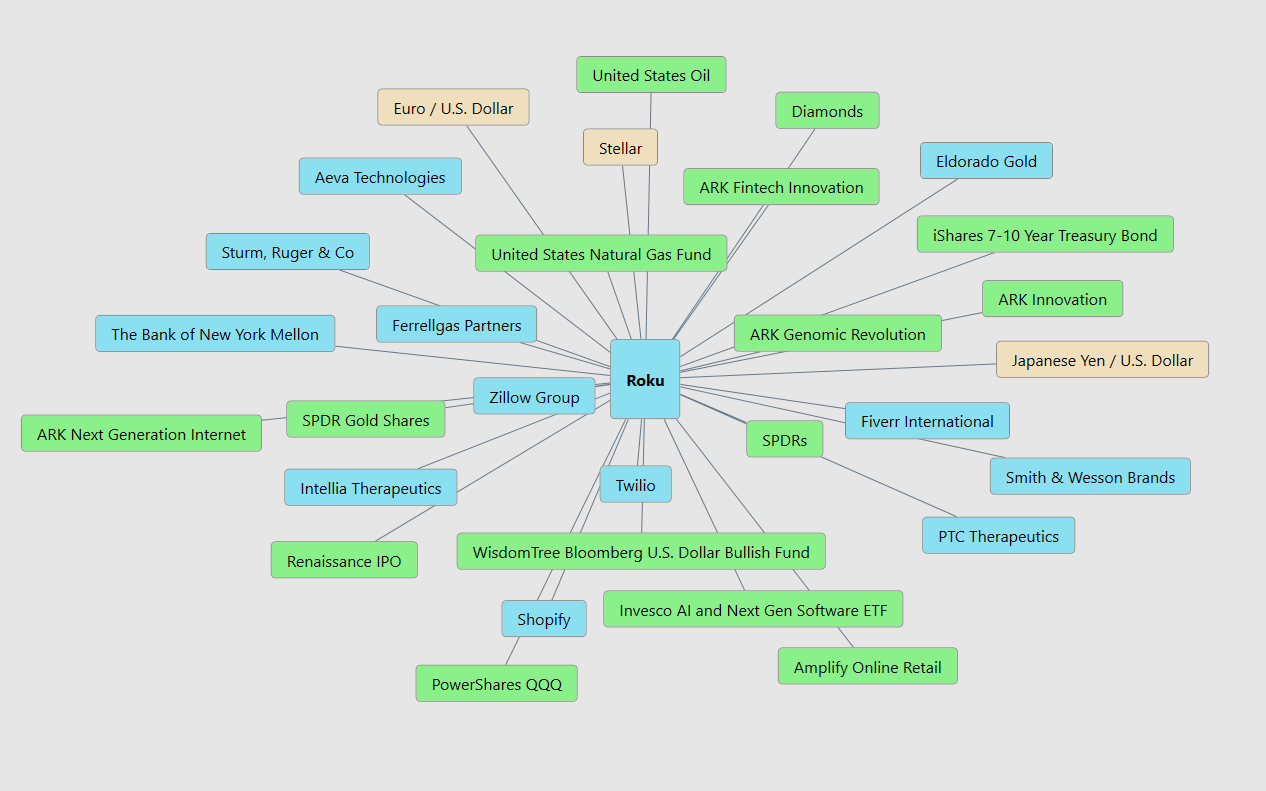
Roku has historically averaged approximately a 3.76% daily range, 9.11% weekly range, and 18.08% monthly range. Those figures remind us that Roku is capable of substantial movement. The Daily Range Forecast takes the analysis one step further by dynamically estimating where the next session’s high and low boundaries are expected to occur. The historical ranges tell us how much Roku tends to move. The Daily Range Forecast helps identify where that movement may occur next.
This is where the VantagePoint indicators work together. The Predictive Blue Line establishes trend direction, the Neural Index provides short-term confirmation, and the Daily Range Forecast helps refine entry and exit levels. With Roku’s predictive trend still bullish, the range forecast becomes especially useful for identifying pullbacks where traders may participate without blindly chasing strength.
The lesson is straightforward: direction tells you what side of the market to trade. The Daily Range Forecast helps determine where to trade it. For Roku, the trend remains higher, but a good trader still cares enormously about price. Buying near a predicted low and managing profits as price approaches a predicted high can dramatically improve the mathematics of the trade compared with simply buying because the chart looks bullish
VantagePoint AI Intermarket Analysis
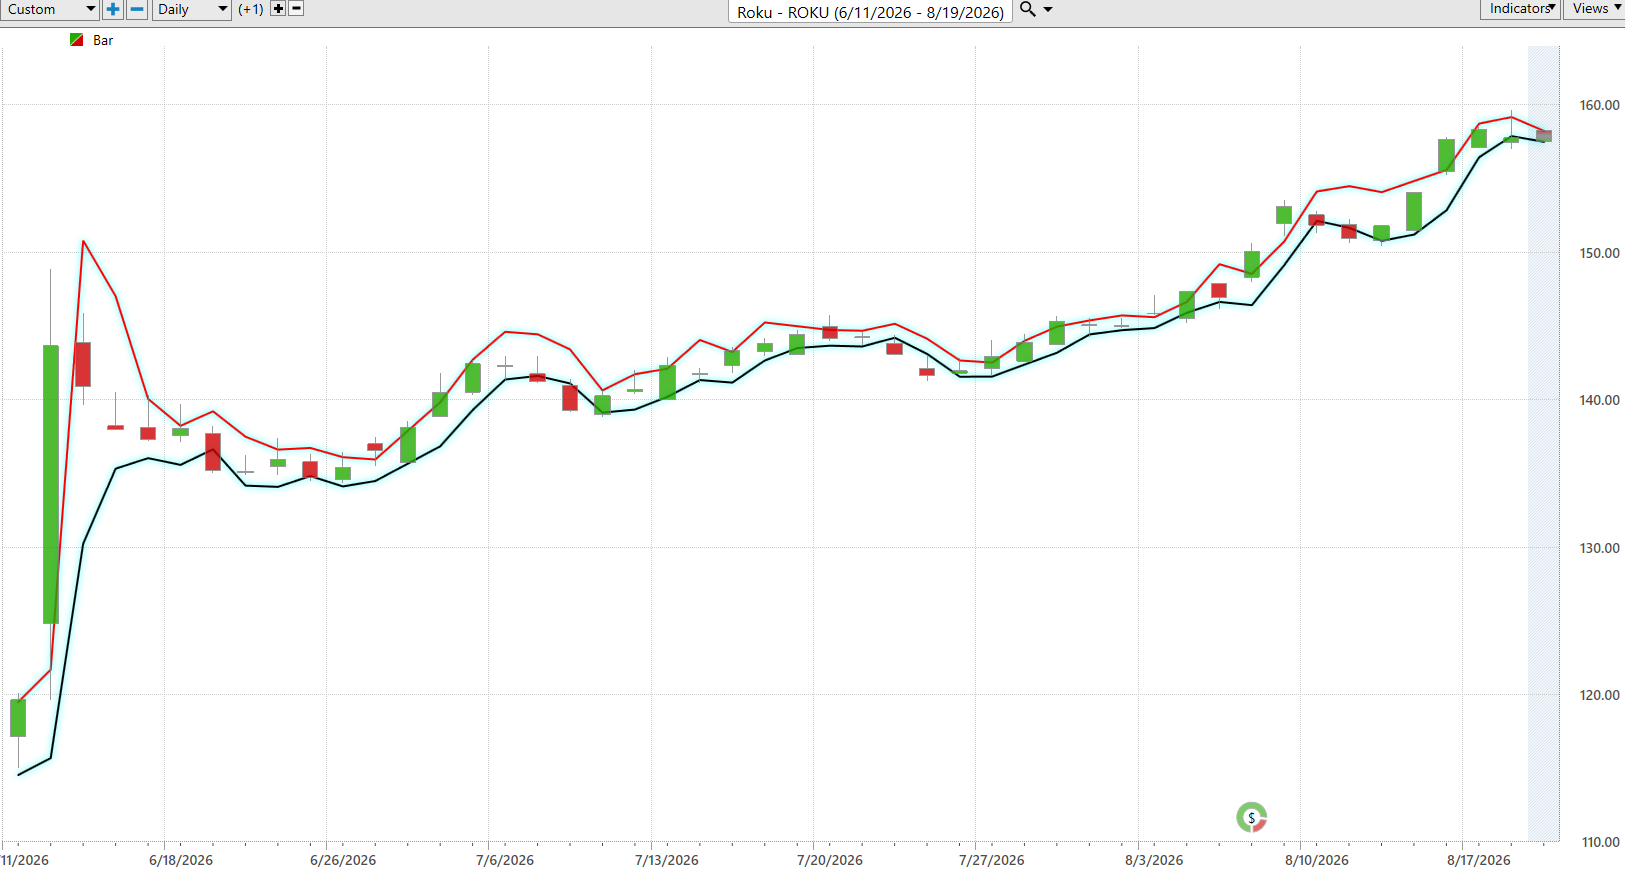
The intermarket map shows why looking at Roku by itself gives you only part of the story. A stock does not trade on an island. Roku is connected to currencies, interest rates, commodities, technology stocks, ETFs and other financial markets. VantagePoint’s intermarket analysis looks for relationships among these markets because movements somewhere else can contain useful information about what may happen to Roku. The important point is that a connection does not necessarily mean one market causes Roku to move.
Look at how broad the network is. The map connects Roku with technology-related names such as Shopify, Twilio and Fiverr, along with the QQQ and several ARK-related funds. That makes intuitive sense because changes in investor appetite for growth and technology can affect many of these markets together. But the analysis goes much further, identifying relationships with the U.S. dollar, Japanese yen, Treasury bonds, gold, oil and natural gas. These are markets a Roku trader might never think to watch.
Why would currencies and bonds matter? Think about interest rates as the price of money. When rates change, investors may change how much they are willing to pay for companies whose expected profits are farther into the future. Currency movements can also signal changes in global money flows and investor attitudes toward risk. Roku’s price can therefore be influenced by forces that have nothing to do with how many people watched television last night.
The unusual relationships are actually one of the most interesting parts of the graphic. Roku is connected with markets ranging from Sturm Ruger & Co. and Smith & Wesson Brands to gold-related investments and biotechnology companies. I would not conclude from this chart that these companies directly control Roku’s price. The graphic only tells us that VantagePoint has identified these markets as relevant intermarket relationships within its analysis. Without the underlying correlation or predictive-weight data, we cannot responsibly say how strong each relationship is or whether it is positive or negative.
Think of it like predicting tomorrow’s weather. Looking out your bedroom window gives you information, but a meteorologist also studies temperature, wind, pressure and weather systems hundreds of miles away. Intermarket analysis tries to do something similar with financial markets. Instead of asking only, “What is Roku doing?” it asks, “What are all the markets connected to Roku doing?”
That is the real advantage for a trader. Price tells you what is happening to Roku. Intermarket analysis tries to identify the financial forces surrounding that price movement. When Roku’s trend, its predictive indicators and important related markets are all pointing in the same direction, the evidence becomes stronger. When they begin disagreeing, that disagreement can serve as an early warning to pay closer attention.
Our Suggestion
Roku is no longer a conventional momentum trade. The proposed Fox acquisition has changed the mathematics. Fox agreed to acquire Roku for consideration initially valued at $160 per share, structured as $96 in cash plus 0.9693 shares of FOXA for each Roku share. That means Roku increasingly trades on FOXA’s price, the probability the transaction closes, and how long completion takes.
What makes the timing interesting is that Roku’s business appears to be strengthening just as Fox wants to buy it. Based on the figures in this study, second-quarter revenue increased approximately 22% to $1.35 billion, advertising revenue rose 25%, subscription revenue increased 26%, and Platform revenue advanced approximately 25%. Roku also generated roughly $164 million in quarterly net income, while trailing twelve-month free cash flow exceeded $700 million.
The longer-term financial improvement is equally important. Revenue increased from $1.78 billion in 2020 to $4.74 billion in 2025. Roku lost approximately $710 million in 2023 and $129 million in 2024, before returning to approximately $88 million of GAAP net income in 2025. The story is shifting from revenue growth at any cost toward actual earnings and cash generation.
The market recognized that improvement before Fox arrived. Roku gained 70.98% over the past year versus 19.27% for the S&P 500, and 74.90% over six months versus 11.78%. Year to date, Roku is ahead 45.13% versus 12.15%. The acquisition did not create Roku’s bullish trend. It arrived after the repricing was already underway.
Roku is near its 52-week high, and the Predictive Blue Line remains above the actual moving average with a positive slope. The Neural Index is also green, providing double confirmation that the trend remains constructive.
The biggest risk has changed. Advertising, competition and profitability still matter, but deal risk now sits above them. Regulatory problems, shareholder opposition, falling FOXA shares, delays or evidence that the transaction could fail could quickly change Roku’s valuation.
Our suggestion is therefore simple: Finding the opportunity matters. Keeping the money matters more.
Practice great money management on all of your trades.
Let’s be careful out there.
It’s not magic.
It’s machine learning.
Disclaimer: THERE IS A HIGH DEGREE OF RISK INVOLVED IN TRADING. IT IS NOT PRUDENT OR ADVISABLE TO MAKE TRADING DECISIONS THAT ARE BEYOND YOUR FINANCIAL MEANS OR INVOLVE TRADING CAPITAL THAT YOU ARE NOT WILLING AND CAPABLE OF LOSING.
VANTAGEPOINT’S MARKETING CAMPAIGNS, OF ANY KIND, DO NOT CONSTITUTE TRADING ADVICE OR AN ENDORSEMENT OR RECOMMENDATION BY VANTAGEPOINT AI OR ANY ASSOCIATED AFFILIATES OF ANY TRADING METHODS, PROGRAMS, SYSTEMS OR ROUTINES. VANTAGEPOINT’S PERSONNEL ARE NOT LICENSED BROKERS OR ADVISORS AND DO NOT OFFER TRADING ADVICE.