| This week’s stock analysis is Boston Beer ($SAM). |
During the Colonial Revolution at the founding of the United States, Samuel Adams served as President of the Massachusetts Senate, and from 1789 to 1793 he served as Lieutenant Governor under Governor John Hancock. Adams had a keen intellect but a quavering voice. His colleagues respected his ideas, so he often penned speeches that others delivered promoting freedom and liberty. Boston Beer named their leading beer after Samuel Adams because Adams was a man of the people who fought for their rights. Adams attended Harvard College and later became a brewer. He was an outspoken critic of British policies in the colonies, and he helped organize resistance. Adams’s legacy as a beer-sampler is celebrated every year on his birthday, September 27th, 1722, with “Samuel Adams Beer Day.” Beer drinkers across the country toast to his memory and enjoy a pint (or two) of America’s favorite beverage.
Boston Beer Company was founded in 1984 by Jim Koch and Rhonda Kallman. The company’s flagship brand is Samuel Adams Boston Lager, which is now distributed nationwide. Other popular brands include Angry Orchard Hard Cider, Twisted Tea, and Truly Spiked & Sparkling. Boston Beer Company employs over 2,500 people and has a market capitalization of over $4 billion. In 2021 they generated over $2 billion in revenue. The company’s products are distributed through a network of over 400 distributors in 46 states. Boston Beer Company is the largest craft brewery in the United States and the sixth-largest overall brewery in the country. In recent years, Boston Beer has experienced incredible growth, due in part to the increasing popularity of craft beer. Today, the company is one of the most well-known and respected brewers in the industry.
Earnings for $SAM are expected to grow by 23% per year. This is above the industry norm and has some analysts extremely excited about the future prospects for the company. The stock has been beaten up badly over the past year, so we need to look at that optimistic outlook in context to the bearish path the stock has recently traveled.
In this weekly stock study, we will look at and analyze the following indicators and metrics which are our guidelines which dictate our behavior in deciding whether to look for opportunities to buy, sell, or stand aside on a particular stock.
- Wall Street Analysts’ Estimates
- 52-week high and low boundaries
- Vantagepoint A.I. Forecast (Predictive Blue Line)
- The Best Case – Worst Case Scenarios
- Neural Network Forecast
- Daily Range Forecast
- Intermarket Analysis
- Our trading suggestion
We don’t base trading decisions on things like earnings or fundamental cash flow valuations. However, we do look at them to better understand the financial landscape that a company is operating under.
Wall Street Analysts’ Estimates
Based on 11 Wall Street analysts offering 12-month price targets for Boston Beer in the last 3 months. The average price target is $316.10 with a high forecast of $385.00 and a low forecast of $250.00. The average price target represents a -13.28% change from the last price of $364.51.
Wall Street is telling us that the smartest minds who track $SAM 24/7 think that $SAM is currently overvalued.
52-Week High and Low Boundaries
Looking at the Long-Term chart of $SAM provides us with the 52-week high and low boundaries.
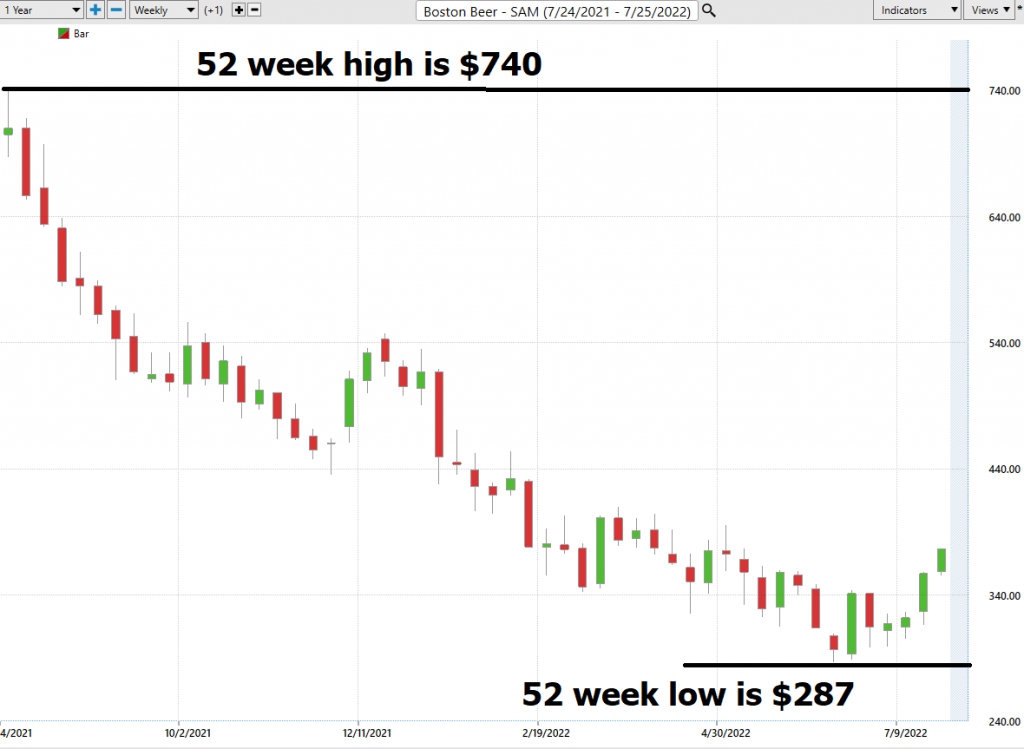
Over the past year we have seen $SAM trade as low as $287 and as high as $740. This tells us that the average weekly trading range for $SAM is $8.71. This represents an annualized volatility of 123.6% which is exceedingly high. We calculate this base measurement of volatility by dividing the annual trading range by the most recent close. Whenever you see that the annual trading range is greater than 100% of the value of the current close you immediately know that you are dealing with a very volatile asset.
The 52-week chart does not look promising at the present.
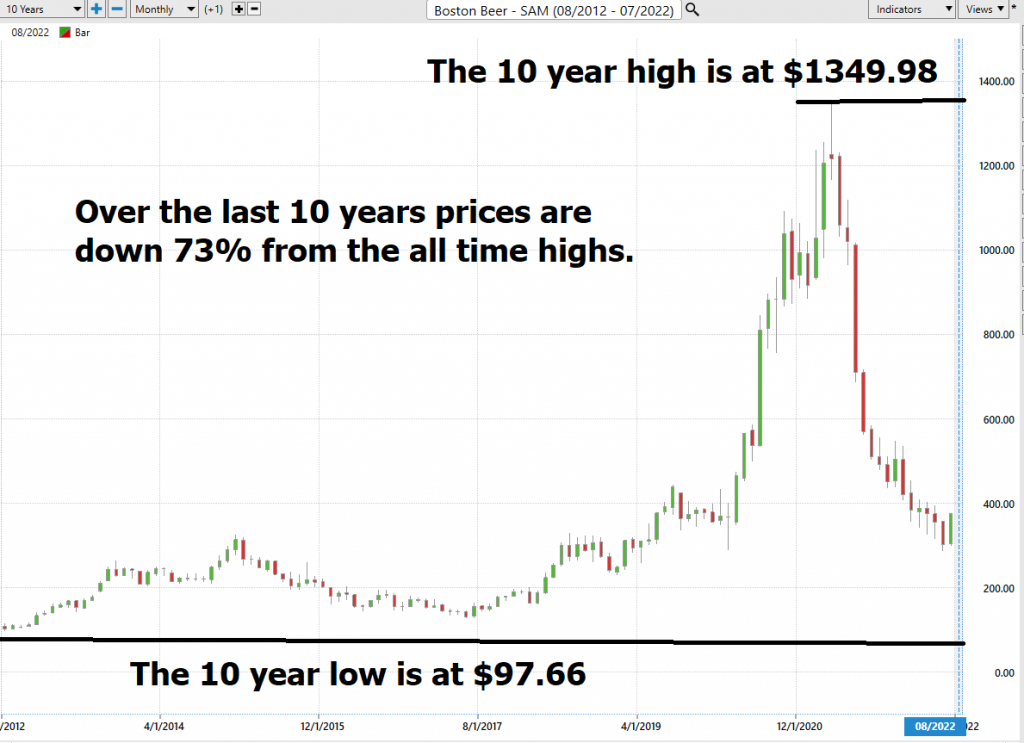
If we zoom out to see how the company has performed over the last 10-year period, we see a tremendous boom followed by the current downtrend which has resulted in $SAM currently trading 73% lower than its all-time high.
We like to study the 52-week chart before doing anything else just so that we can get a feel for how the company has performed over the past year and compare that to other opportunities and the broader market indexes.
Place these boundaries on your radar and pay attention.
Best Case – Worst Case Scenario $SAM
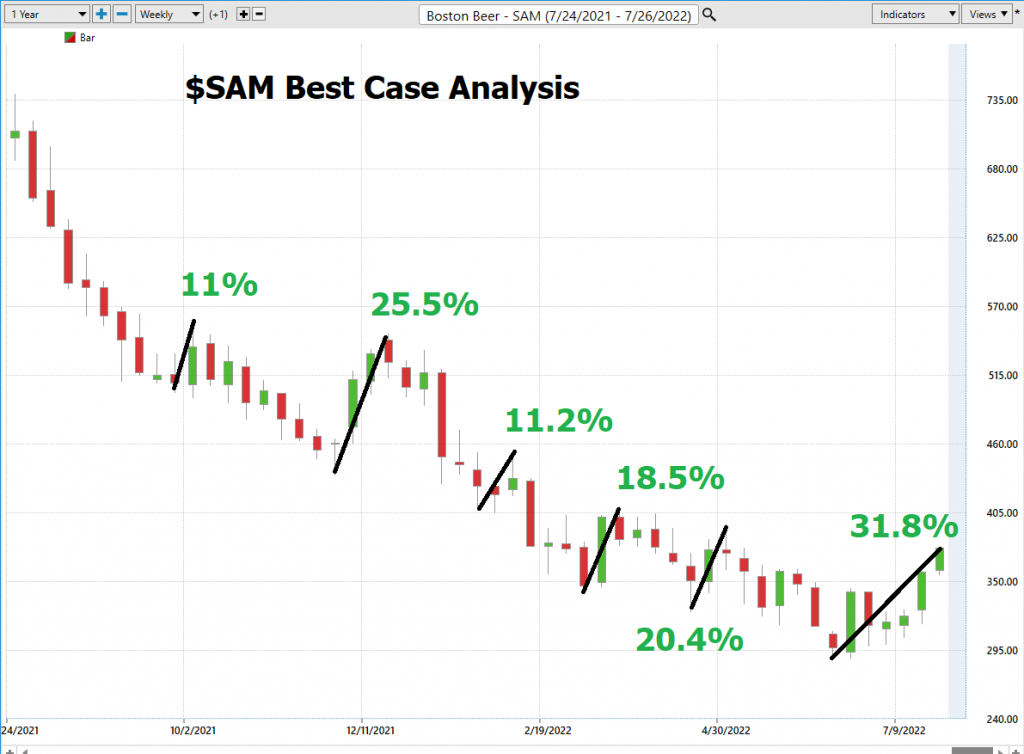
The charts below show the numerous sharp declines and rallies that $SAM had over the past year.
Earlier we mentioned that the annualized volatility in $SAM is 126%. You can quickly see that rallies were significantly smaller than the declines.
This is a hit and run stock. Whether you are long or short the profits and losses will present themselves very quickly.
This is extremely high volatility and we would advise traders who are unfamiliar with volatile markets to steer clear. However, Power Traders will use these sudden sharp declines and monitor the a.i. and forecasted daily trading ranges for short term swing trading opportunities.
The declines ranged from 20% and as much as 36%. The stock falls much faster than it rises.
Market rallies ranged from 11% to 31%
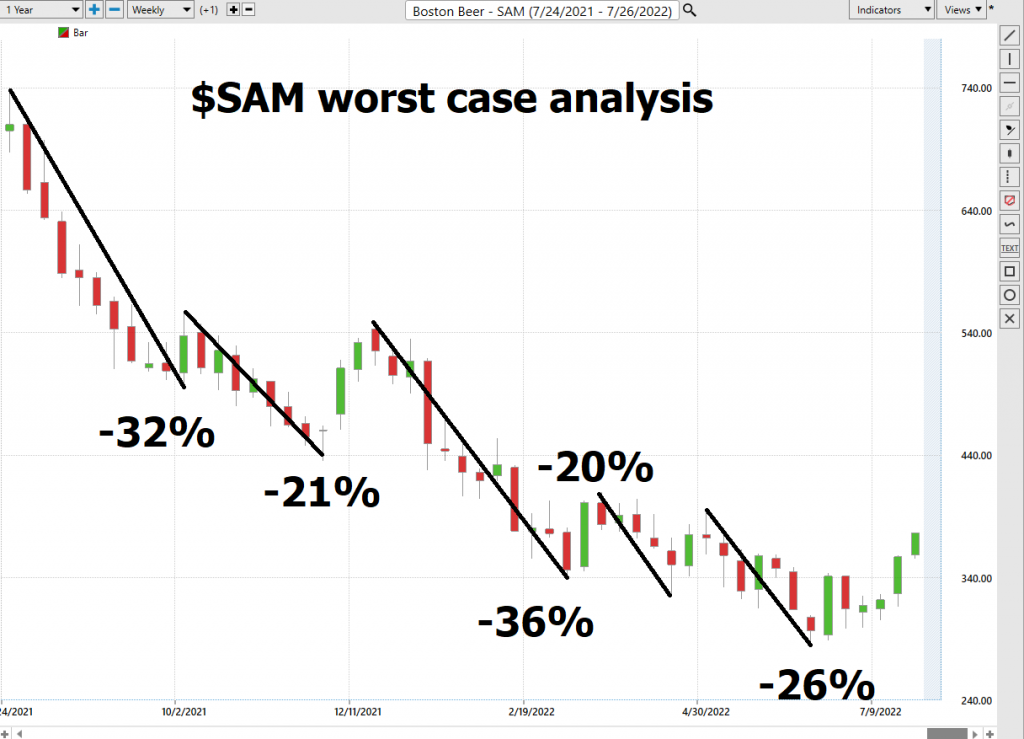
What we can learn from this basic worst-case analysis is that $SAM could EASILY fall 20% to 36% in a period of weeks.
This price volatility is ideal for SWING traders who can exploit the trend.
Next, we compare $SAM to the performance of the broader stock market indexes.
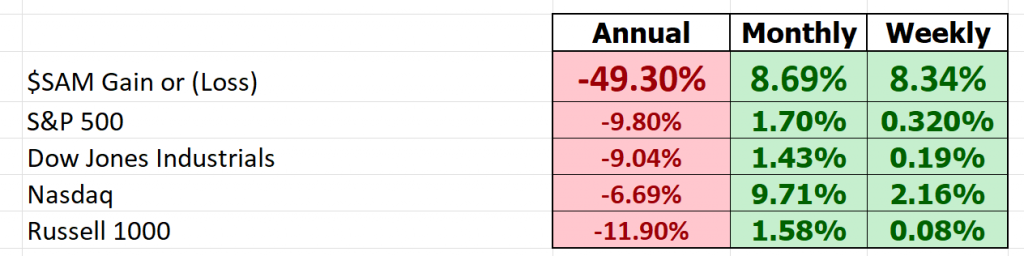
In doing this analysis we can see that $SAM has been much more volatile than the broader market. It has outperformed the broader on the front end, (weekly and monthly, but it has performed 5 times worse than the broader market on an annual basis.
Lastly, we perform a comparative analysis of $SAM versus other beer manufacturers.
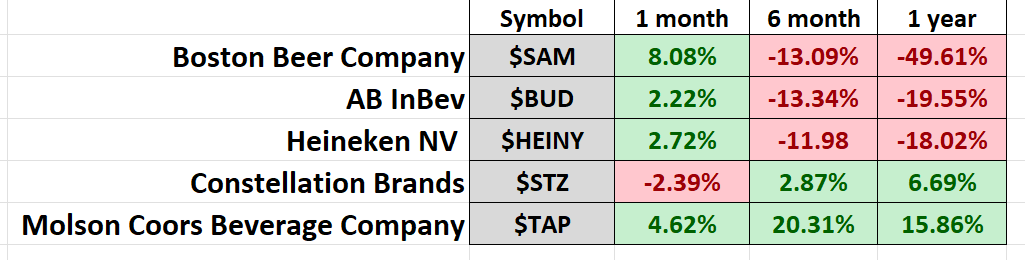
Once again you see that $SAM has outperformed its industry competitors on the weekly and the monthly time frames, but it has by far been the worst performer on an annualized basis.
Vantagepoint A.I. Forecast (Predictive Blue Line)
On the following chart you will see the power of the VantagePoint Predictive blue line which determines the medium-term trend price forecast.
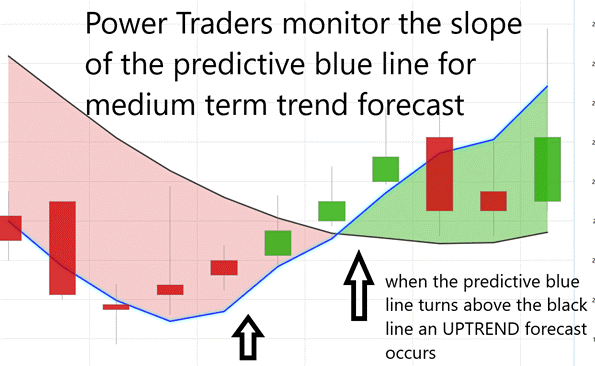
The guidelines we abide by are as follows:
- The slope of the predictive blue line determines the trend and general direction of $SAM
- Ideally, the VALUE ZONE is determined to try and buy the asset at or below the predictive blue line.
Here is a snapshot of the opportunities that the a.i. has focused on in the past month for Power Traders.
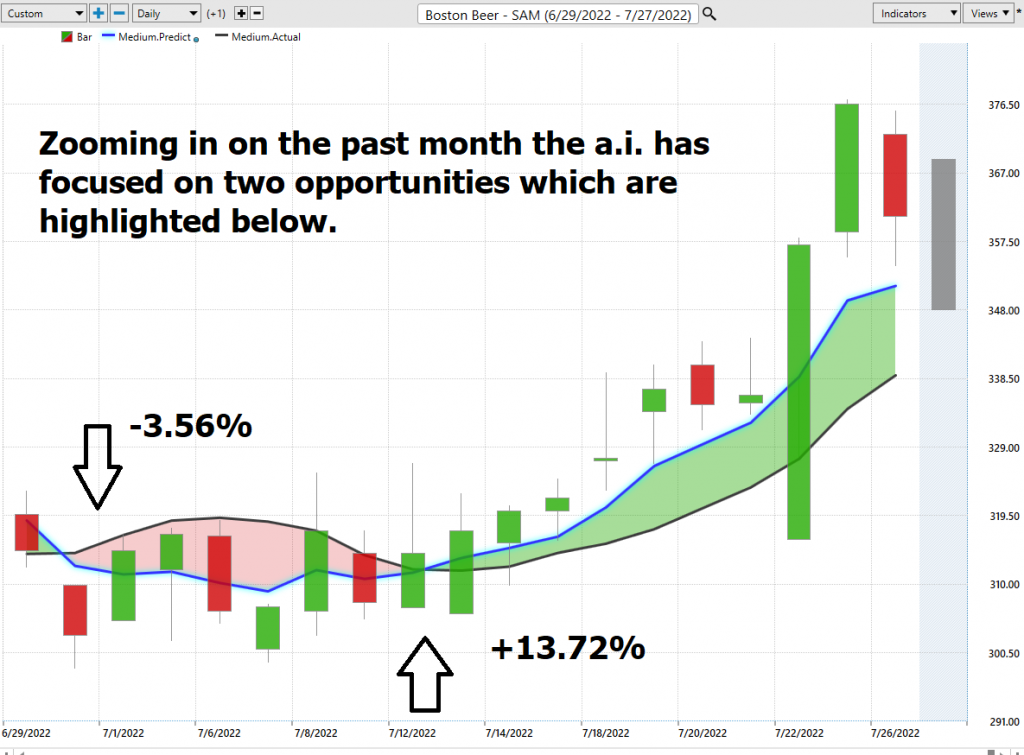
Trade #1 was a loser resulting in a loss of -3.56%
Trade #2 is currently OPEN and a winner resulting in open gains of 13.72%.
Neural Network Indicator (Machine Learning)
At the bottom of the chart is the Neural Network Indicator which predicts future short-term strength and/or weakness in the market. When the Neural Net Indicator is green it communicates strength. When the Neural Net is red it is forecasting short term weakness in the market.
A Neural Net is a computational learning system that uses a network of functions to understand and translate massive amounts of data into a desired output, consistently monitoring itself and improving its performance.
Whenever Power Traders are looking for statistically valid trading setups, they look for a DOUBLE confirmation signal. This signal occurs whenever the blue predictive line and the Neural Net at the bottom of the chart suggest the same future expected outcome.
We advocate that Power Traders cross reference the chart with the predictive blue line and neural network indicator to create optimal entry and exit points.
Traders look for confirmation on the Neural Net to position themselves LONG or SHORT in the market. In other words, when the A.I. forecast is green, and The Neural Net is green, that presents a buying opportunity.
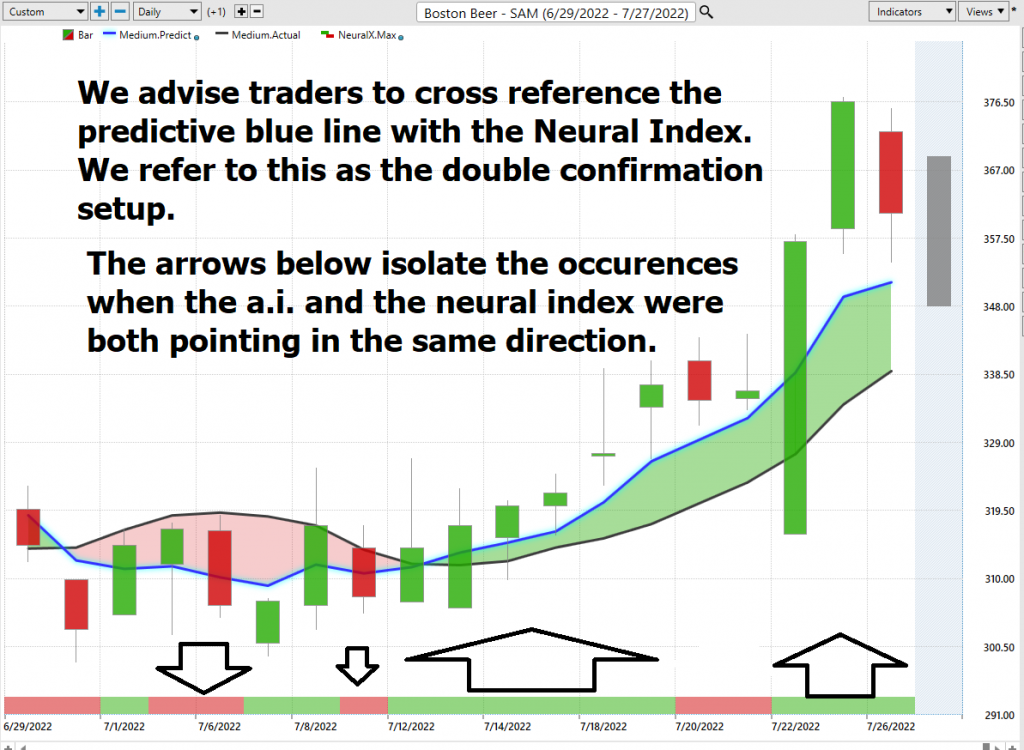
The inverse is also true, when the A.I. forecast is red and the Neural Net is red, that is a SELLING opportunity. The arrows on the chart below highlight the trading zones where Power Traders would’ve been using double confirmation to find a BUYING opportunity in cross referencing the A.I. forecast with the Neural Net.
Power Traders are always looking to apply both the Neural Network and A.I. to the markets to find statistically sound trading opportunities.
VantagePoint Software Daily Price Range Prediction
One of the powerful features in the VantagePoint Software which Power Traders use daily is the Price Range prediction forecast.
This forecast is what permits Power Traders to truly fine tune their entries and exits into the market.
Every day traders are faced with the anxiety and frustration of wondering where they should be looking to buy and sell the market. VantagePoint’s A.I. makes this decision super easy with the Daily Price Range Forecast.
For short term traders the important question that they have to confront every day is where should I buy? Where should I place my stop? Where should I sell? The VantagePoint Daily Price Range forecast can help them answer this question.
Here is the price chart of $SAM during the past month with the Vantagepoint A.I. Daily Price Range forecast indicator.
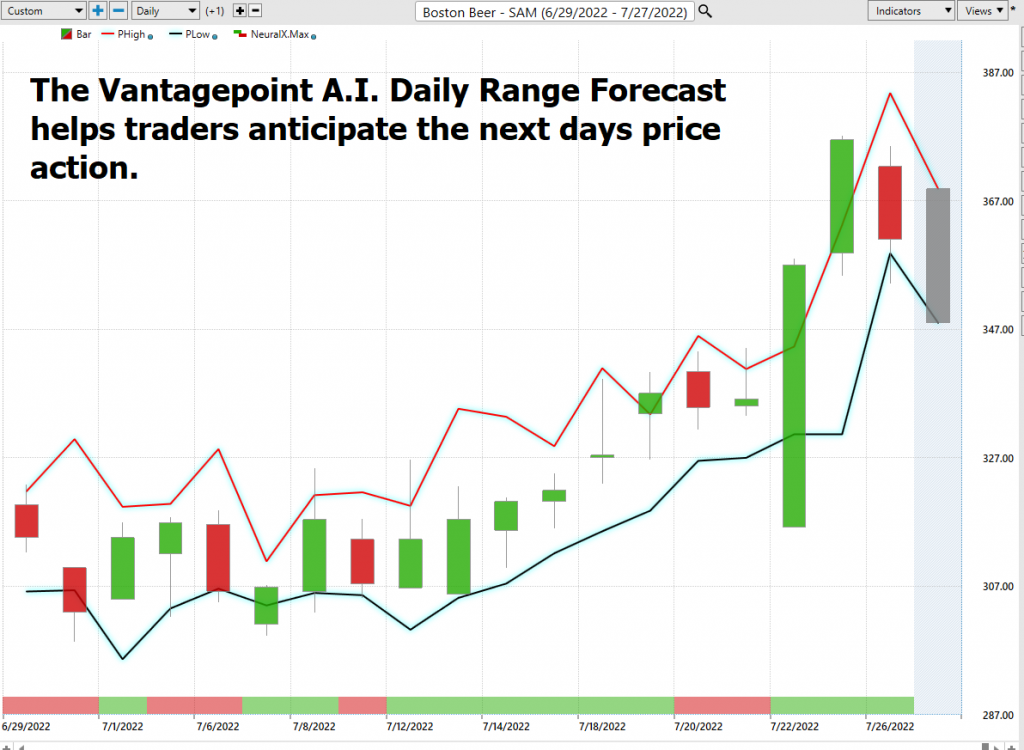
Observe how the channel is very clearly delineated and it is very easy to observe where anticipated support and resistance over the short term is. Traders look to buy near the bottom of the channel and sell at or above the top of the channel.
See how the upper and lower bands of the price range forecast form a noticeably clear channel of trading activity as well. Swing traders are always looking for opportunities to buy towards the bottom of the predicted channel and selling opportunities above the top band.
Intermarket Analysis
Power lies in the way we respond to the truth we understand.
Management has made the company more financially flexible by restructuring its debt obligations.
One of the supremely important questions in trading is what is driving the price? Headlines often create interesting narratives. But these “stories” only capture the imagination. Traders want and need to understand the cause and effect of price movement.
The only way to get an answer to this important question is through intermarket analysis which looks at statistical price correlations of assets.
We live in a global marketplace.
Everything is interconnected.
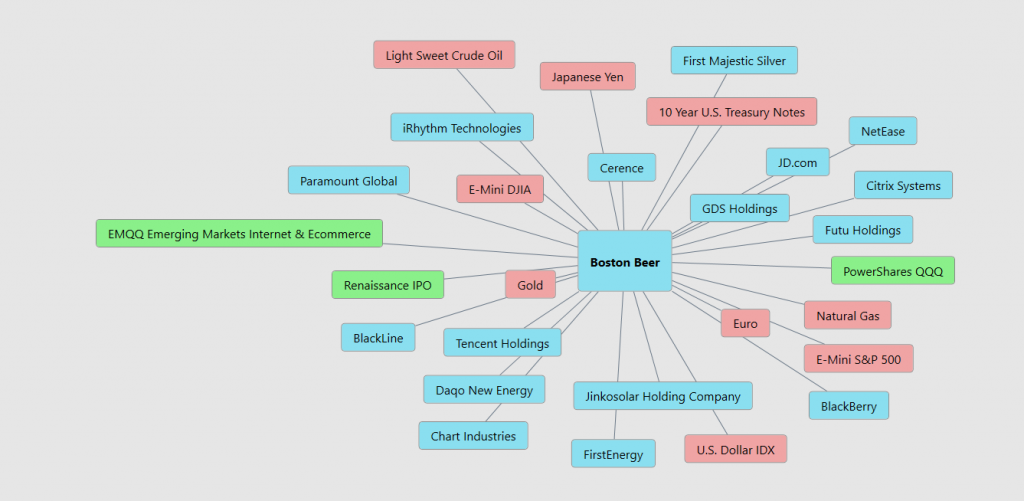
Intermarket analysis is a trading analysis technique that looks at the correlation between different asset classes in order to make better-informed trading decisions. By considering the relationships between different markets, intermarket analysis can give traders a more complete picture of the overall market environment. For example, by analyzing the relationship between $SAM and other markets, traders can get a better sense of whether the market is bullish or bearish. By understanding how different markets are correlated, traders can better assess risk and identify opportunities. While intermarket analysis can be used by any type of trader, it is particularly popular among hedge funds and quants. These traders often use sophisticated statistical models to find trading signals across different asset classes.
Interest rates, Crude Oil Prices, and the volatility of the Dollar amongst thousands of other variables affect the decisions companies must make to flourish and prosper in these incredibly challenging times. Trying to determine what these factors are is one of the huge problems facing investors and traders.
You always have a choice. You can tune in to the talking heads in the media who spin talking points which promote fear. Or you can rely on facts to base your decision making on.
There is immense value to be had in studying and understanding the key drivers of $SAM’s price action. This graphic provides a microcosmic view of what factors have been driving $SAM’s price higher.
Our Suggestion
Currently, 3 out of 4 stocks are trading below their 200 day moving averages. Clearly this environment is a treacherous one even for the most experienced of swing traders.
The current 200 day moving average of $SAM is at $411.85 so even the current rally which the A.i. forecast must be viewed in the context of the broader downtrend. $SAM is trading at $365.
One of the obvious outcomes of a very steep decline in a stock are overly optimistic forecasts. There is an abundance of optimism surrounding the future prospects of $SAM. But we prefer to be realists. In trading the only thing that matters is price. It is a change in price which will either make you poorer or richer. Everything else is just noise.
We expect $SAM to revert back 15% to 20% and will re-evaluate as time passes. There has been a lot of price damage done in the recent downtrend and before it can be repaired $SAM will have to consolidate and demonstrate that it is genuinely undervalued.
Our recommendation is to follow the A.I. trend analysis as outlined in this stock study and practice good money management on all trades. Preserve your capital. Practice good money management.
We will re-evaluate based upon:
- New Wall Street Analysts’ Estimates
- New 52-week high and low boundaries
- Vantagepoint A.I. Forecast (Predictive Blue Line)
- Neural Network Forecast
- Daily Range Forecast
Let’s Be Careful Out There!
Remember, It’s Not Magic.
It’s Machine Learning.
Disclaimer: THERE IS A HIGH DEGREE OF RISK INVOLVED IN TRADING. IT IS NOT PRUDENT OR ADVISABLE TO MAKE TRADING DECISIONS THAT ARE BEYOND YOUR FINANCIAL MEANS OR INVOLVE TRADING CAPITAL THAT YOU ARE NOT WILLING AND CAPABLE OF LOSING.
VANTAGEPOINT’S MARKETING CAMPAIGNS, OF ANY KIND, DO NOT CONSTITUTE TRADING ADVICE OR AN ENDORSEMENT OR RECOMMENDATION BY VANTAGEPOINT AI OR ANY ASSOCIATED AFFILIATES OF ANY TRADING METHODS, PROGRAMS, SYSTEMS OR ROUTINES. VANTAGEPOINT’S PERSONNEL ARE NOT LICENSED BROKERS OR ADVISORS AND DO NOT OFFER TRADING ADVICE.