


| This week’s stock analysis is Uranium Energy ($UEC) |
Let’s talk uranium, folks! This heavy, silvery-white metal is not just radioactive; it’s also electrifying the markets. Why? Because it’s the fuel that powers nuclear reactors, providing a huge chunk of the world’s electricity. And don’t forget, it’s also a key component in nuclear weapons. So, whether it’s keeping your lights on or national security, uranium is a big deal.
Uranium Energy Corp ($UEC), along with its subsidiaries, is engaged in the exploration, pre-extraction, extraction, and processing of uranium and titanium concentrates. They operate in the United States, Canada, and Paraguay. They have interests in various projects including the Palangana mine, Goliad, Burke Hollow, Longhorn, Salvo in Texas, Anderson, Workman Creek, Los Cuatros in Arizona, Slick Rock in Colorado, Reno Creek in Wyoming, Dalton Pass, C de Baca in New Mexico, Diabase in Canada, and Yuty, Oviedo, and Alto Parana titanium projects in Paraguay. The company was formerly known as Carlin Gold Inc. It changed its name to Uranium Energy Corp in January 2005. Uranium Energy Corp was incorporated in 2003. They are headquartered in Corpus Christi, Texas and currently have 63 employees.
Uranium Energy Corp operates in the basic materials sector and faces competition from several companies. Some of the main competitors of Uranium Energy include:
Denison Mines (DNN): A company that, like UEC, operates in the basic materials sector and engages in uranium mining and exploration.
Nexgen Energy (NXE): Another player in the basic materials sector.
Ingevity (NGVT): A company with a market cap of $1.81 billion and revenue of $1.67 billion.
EVRAZ (EVRZF): A company with a market cap of $1.78 billion and revenue of $1.349 billion.
Minerals Technologies (MTX): This company has a market cap of $1.77 billion and revenue of $2.13 billion.
Alumina (AWCMY): A company with a market cap of $1.90 billion.
The above companies are all part of the basic materials sector and pose competitive challenges to Uranium Energy Corp. Now, here’s the kicker. As the world is slowly waking up to the reality that nuclear energy is emerging as a clean alternative to fossil fuels like coal and gas. No carbon emissions, and it can generate a ton of electricity. So, uranium is not just important; it’s indispensable. But hold on, there’s a catch. A shortage in uranium could send energy costs through the roof, and countries dependent on nuclear energy would be hit hard. On the other side, nations sitting on uranium reserves could become geopolitical powerhouses.
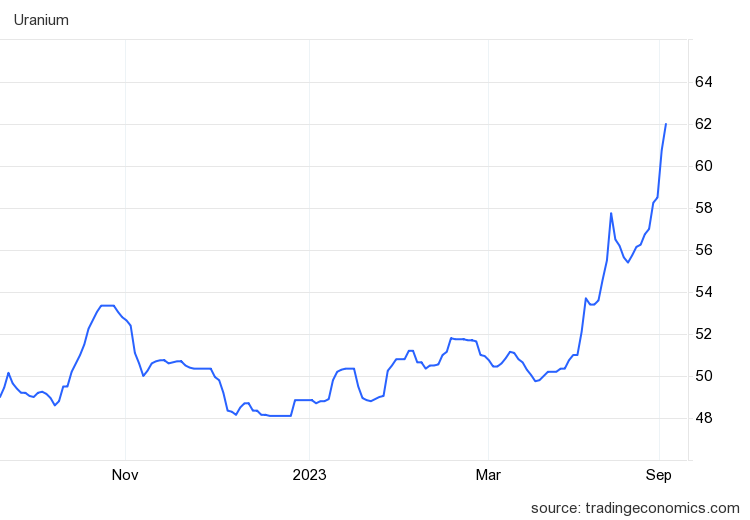
Let’s get into the numbers because this is where it gets really interesting. Preliminary data for 2024 shows a supply of 160 million pounds but a demand of 210 million pounds. Do the math; that’s a deficit of 50 million pounds! And here’s something you won’t hear often: the uranium market is not like your typical commodity market. It’s more private, less liquid, which means when prices move, they really swing wildly, overshooting all estimates. These fundamentals have sent raw uranium prices flying higher. Uranium prices recently touched $62 per pound.
And let’s not forget geopolitics. Russia-Ukraine tensions and recent upheavals in Niger are making countries rethink their energy strategies. Add to that the potential U.S. sanctions on Russian uranium, and you’ve got a perfect storm brewing. So, if you’re looking at uranium stocks, keep your eyes peeled. Companies like Uranium Energy are making strategic moves, buying up assets to ramp up production. This is a story that’s far from over; it’s just getting started! Uranium is not just a metal; it’s a market mover, a geopolitical tool, and perhaps the future of clean energy. Keep watching this space and keep your eyes on $UEC!
In this weekly stock study, we will look at and analyze the following indicators and metrics as are our guidelines which dictate our behavior in deciding whether to buy, sell, or stand aside on a particular stock.
- Wall Street Analysts’ Estimates
- 52-week high and low boundaries
- Best Case – Worst Case Analysis and Takeaways
- Vantagepoint A.I. Forecast (Predictive Blue Line)
- Neural Network Forecast
- Daily Range Forecast
- Intermarket Analysis
- Our trading suggestion
We don’t base our trading decisions on things like earnings or fundamental cash flow valuations. However, we do look at them to better understand the financial landscape that a company is operating under.
Wall Street Analysts’ Estimates
The 6 analysts offering 12-month price forecasts for Uranium Energy Corp have a median target of 6.70, with a high estimate of 8.00 and a low estimate of 6.00. The median estimate represents a +31.76% increase from the last price of 5.10.
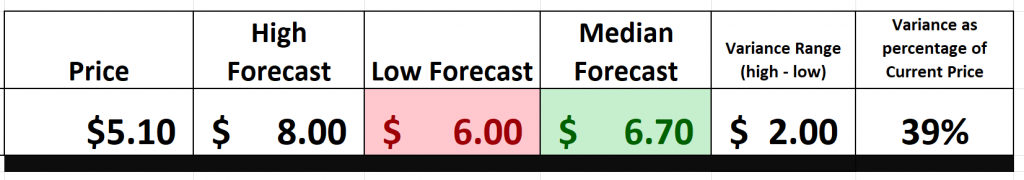
In all of the time that we have been studying stocks, I cannot remember an occurrence when even the most bearish analyst on a stock would result in an 18% uptrend from the current price.
$UEC is trading at $5.10.
The most pessimistic forecast is $6.00.
The most optimistic forecast is $8.00.
The median forecast is $6.70.
Surely these Wall Street analysts are studying the same supply and demand statistics which I have already cited. Be prepared for some serious volatility.
52-Week High and Low Boundaries
Let’s break down the significance of the 52-week high and low in the stock market. Think of the 52-week high as the pinnacle, the highest point a stock has reached in the past year. On the flip side, the 52-week low? That’s the bottom, the lowest ebb. When a stock hits that high, it’s riding a wave of success. But when it touches that low, it’s a sign of trouble.
Now, why should you care about these 52-week markers? Simple. They’re like beacons, drawing the attention of investors everywhere. Whether a stock’s hitting its high or its low, it’s making headlines, and traders are watching. These benchmarks? They’re not just numbers; they’re powerful tools in the hands of those who know how to use them. Let’s get into the nitty-gritty. When you’re evaluating a stock, you’ve got to dig deep. Look at those charts, see where the stock stands in relation to its 52-week highs and lows. This is where the rubber meets the road, folks. The best of the best? They’re consistently setting new 52-week highs. That’s a sign of strength, a testament to their potential. And the market? It’s betting on them.
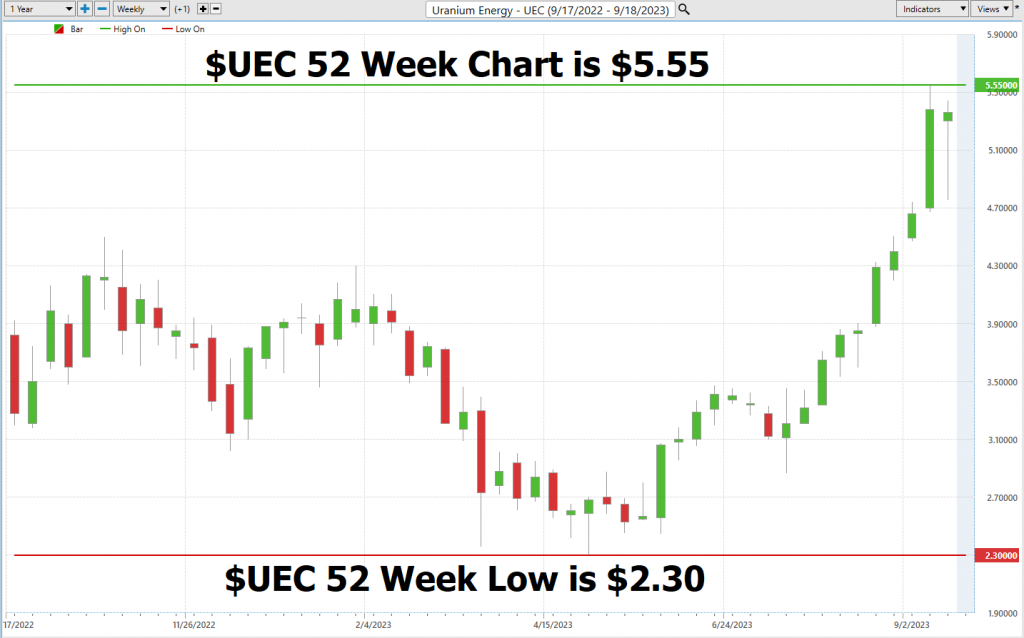
Now, for a real-world example: $UEC. Over the past year, it’s swung between $2.30 and $5.55. Right now, it’s sitting pretty at the 86th percentile of its 52-week range. And if you want to get a sense of its volatility, just divide its annual range by its current price. You’ll find it has a volatility of 63.7%. That’s a big number, telling us that $UEC could see some major moves in the coming year.
But here’s the kicker: that 52-week high? It’s not just a number; it’s a barrier. And when a stock breaks through, watch out! It can skyrocket. Stocks that keep smashing their 52-week highs? They’re on a roll, and they’ve got our attention. That 52-week mark can be a tough nut to crack, but when it does, the sky’s the limit. And trust me, we’re always watching, always analyzing, especially with the insights from our innovative AI forecasts. Stay sharp, folks, and keep those 52-week markers in your sights!
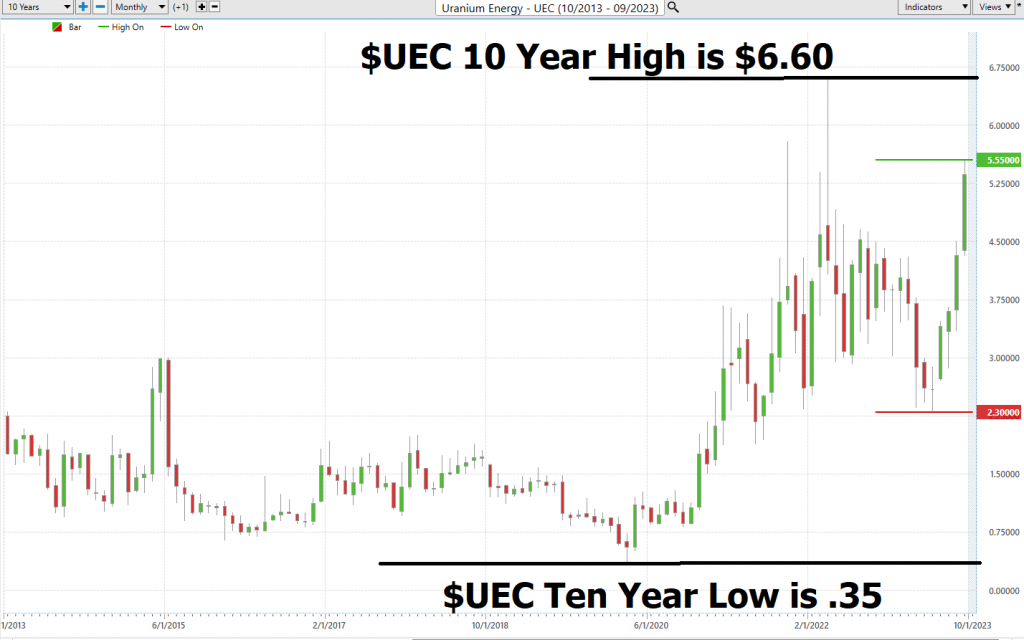
We also like to provide a longer-term contact by looking at how the stock has performed on the 10-year monthly chart.
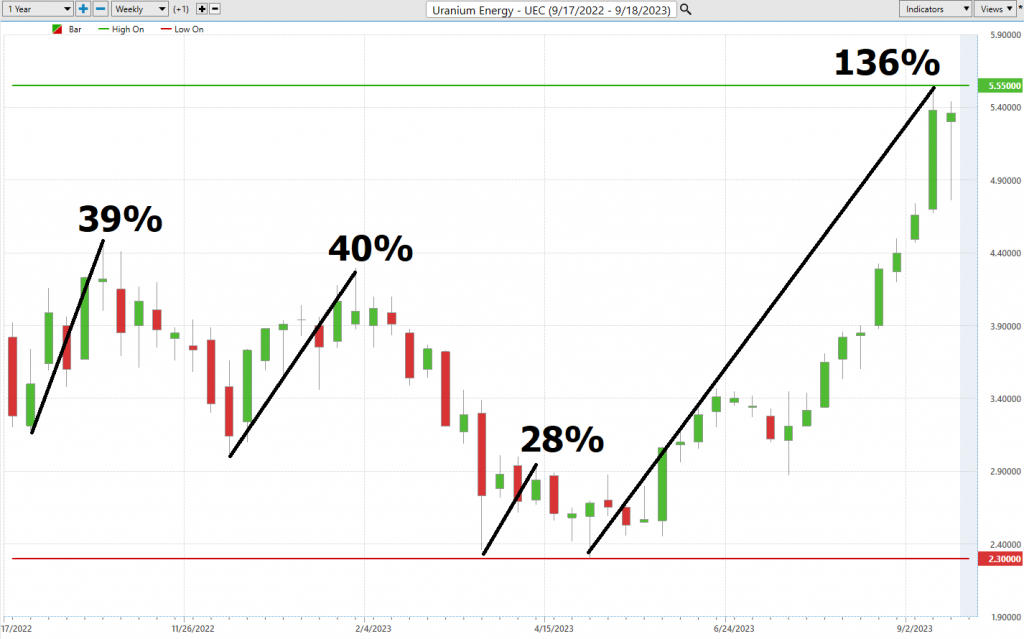
Best Case – Worst Case Scenario
Let’s cut through the noise and get to the point. Instead of getting lost in theories, let’s dive into what’s happening on the ground. Before you even think about making a move in the market, ask yourself: How have the highs and lows played out over the past year? Specifically, let’s zero in on $UEC.
Here’s a simple concept: Connect those high points to the low ones. Measure those upswings against the downturns. It’s a quick and dirty way to get a read on $UEC’s volatility. And trust me, understanding that volatility? It’s your key to gauging both risk and opportunity.
And one more thing—don’t just stop at $UEC. Compare its performance to the broader market indices. See where it stands. Knowledge is power, my friends. Equip yourself with it.
Here is the Best-Case Analysis:
Followed by the Worst-Case Analysis.
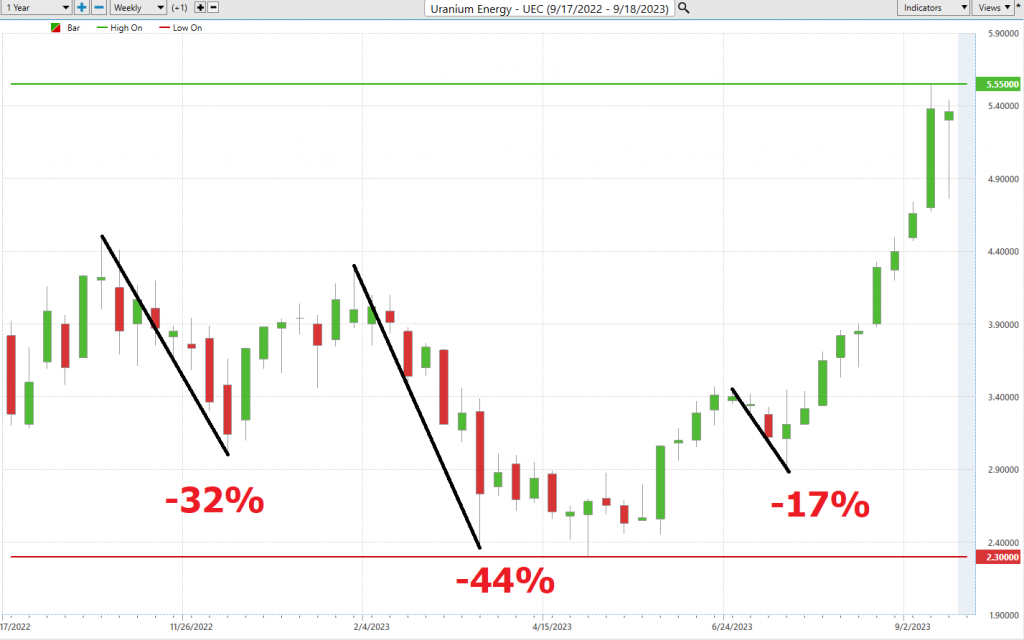
From this simple analysis, you can visualize and compare the rallies to the declines and see how quickly they occurred and whether the gains or losses were sustained.
Next, we want to compare the performance of $UEC to the major broad market indexes.
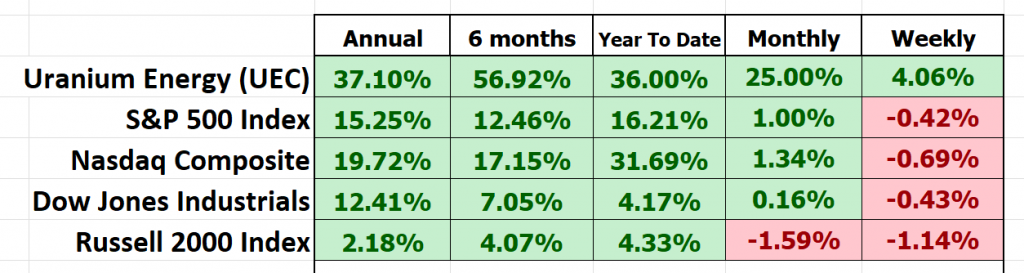
Now, let’s look at $UEC and compare volatility and performance to how it stacks up against the big boys in the market. What we’re talking about here is something traders call BETA. You see, beta (β) is like the Richter scale of the stock world. It tells you how much a stock shakes and rattles compared to the broader market, usually a big index like the S&P 500. In simpler terms, beta shows us how sensitive a stock is to the market’s ups and downs.
Let me break it down for you:
– Beta = 1: This means the stock’s price moves along with the market. So, if the market goes up by 5%, a stock with a beta of 1 should also go up by 5%.
– Beta > 1**: This is when the stock is more like a rollercoaster. A beta of 1.5, for instance, tells you that the stock is 50% wilder than the market. If the market goes up 5%, this stock might jump 7.5% (or drop the same way).
– Beta < 1**: Now, this is where things get steady. A beta of 0.5 suggests the stock is half as crazy as the market. If the market rises 5%, this stock might only go up by 2.5%.
So, what’s the story with $UEC? Well, its beta stands at 1.75, and we’re looking at data over a 5-year period. Remember, though, beta is all about the past, and what’s gone by isn’t always what’s coming next. High beta doesn’t mean guaranteed high returns, folks. It just tells us this stock’s got more ups and downs, which traditionally means more volatility.
Investors use beta to gauge how volatile a stock is compared to the overall market. It’s like a risk-o-meter to help them build portfolios that match their own appetite for risk and what they’re aiming to achieve in the market.
So, in $UEC we have an asset that you can quickly see is much more volatile than the broader stock market indexes. As we have already mentioned huge volatility is baked in to $UEC which spells either huge opportunity or risk.
Vantagepoint A.I. Forecast (Predictive Blue Line)
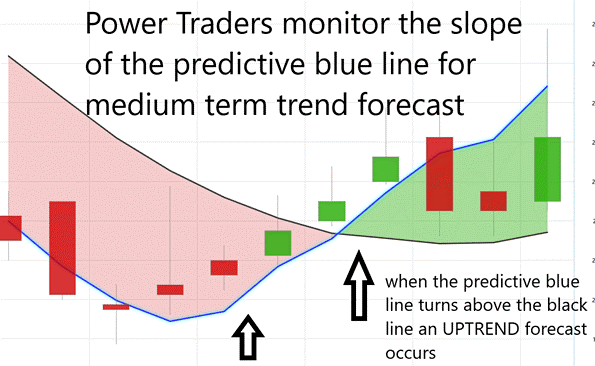
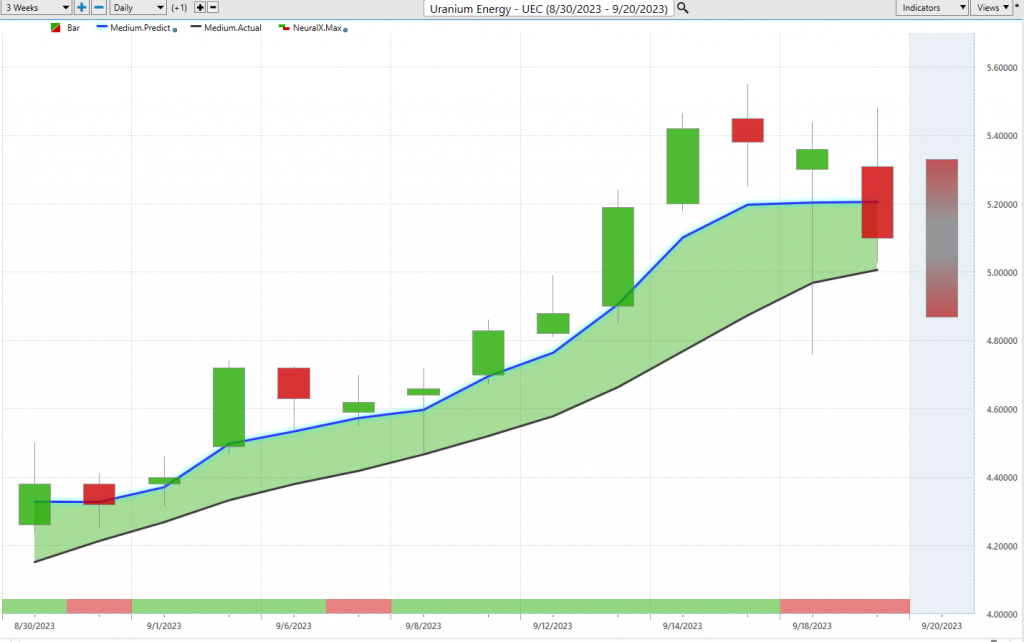
On the following chart you will see the power of the VantagePoint Predictive blue line which determines the medium term trend price forecast.
All right, folks, let’s dive into the heart of the matter. I want to draw your attention to this next chart, showcasing the prowess of the VantagePoint Predictive blue line. This isn’t just any line; it’s your compass to the medium-term trend forecast for $UEC.
Here’s the playbook:
1. The direction and angle of that blue line? It’s telling you the trend and the general momentum of $UEC.
2. Now, for those of you looking for the sweet spot or the ‘VALUE ZONE’, aim to buy the asset when it’s at or below this predictive blue line.
Peel your eyes and focus on that blue line’s trajectory. It’s not just a line; it’s a treasure trove of insights, thanks to Vantagepoint’s cutting-edge Neural Network and Intermarket Analysis. This line, powered by artificial intelligence, is your window into the future price trends of $UEC.
But let’s not stop there. Let’s harness the might of AI and deep dive into $UEC’s recent price movements. That blue line’s slope. It’s your key to unlocking the asset’s price direction.
Here’s the deal: Traders who swear by VantagePoint Software are always on the lookout for shifts in that blue line. While the black line gives you a snapshot of the past, the blue line is your guide to the future. It’s your value zone, pointing you to the best buy points.
Now, the dance between the black and blue lines? That’s where the magic happens. The blue line’s position, crafted by VantagePoint’s state-of-the-art tech, is a culmination of intricate price drivers and data correlations.
When the blue line climbs above the black? That’s your green light for an upward trend. But if it dips below? Brace for a potential downturn. It’s that simple, giving traders a clear roadmap without the second-guessing.
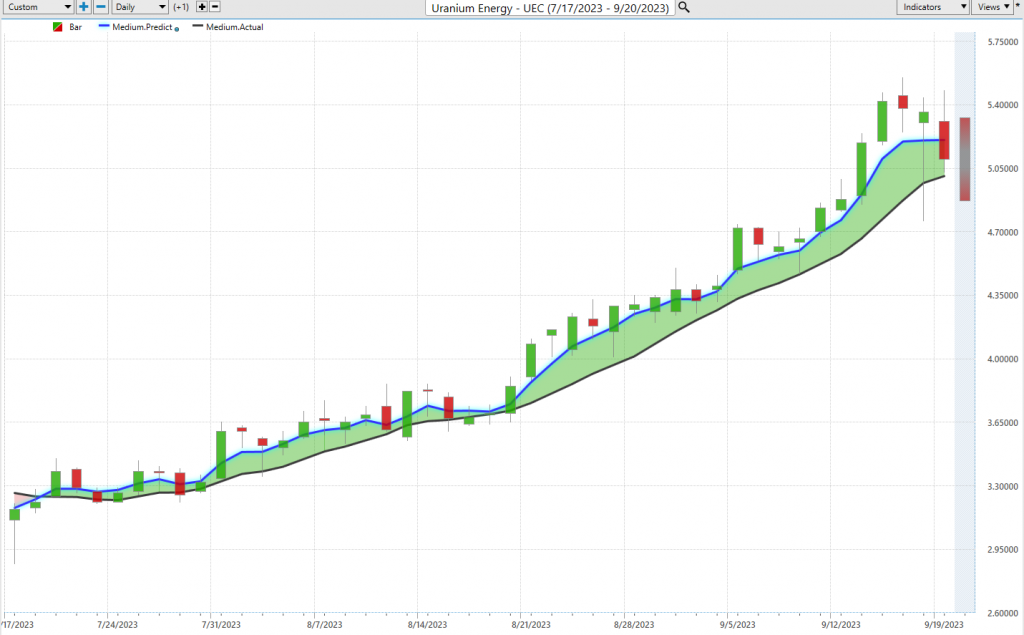
Veteran traders know the drill. They watch for two back-to-back closes above that blue line, signaling a bullish trend. And when that blue line starts to steepen? It’s a harbinger of a potential price shift. A strong trend is in play when the closes consistently hover above that predictive blue line, as you can see right here on the chart.
To wrap it up, that blue line’s slope is your North Star for navigating $UEC’s trends. With this tool in your arsenal, you’re equipped to time your trades just right, cutting through the market noise.
Neural Network Indicator (Machine Learning)
Let’s dive into one of the most potent tools in the trading arsenal: the Neural Network Indicator. Positioned right at the chart’s foundation, it’s akin to having a meteorologist for the market right at your fingertips.
A neural network is a computational model inspired by the structure and functional aspects of biological neural networks in the human brain. It consists of interconnected nodes or “neurons” that process information in layers. Each neuron receives input, processes it, and sends the output to the next layer. The strength of connections (weights) between these neurons is adjusted during training based on the data it’s exposed to.
For traders, neural networks are constructed to predict financial market movements. The process involves:
Gathering historical market data, including prices, volumes, and other relevant indicators. Cleaning and normalizing the data to make it suitable for the neural network.
Exposing the neural network to this data, allowing it to adjust its weights based on the patterns it identifies. Testing the neural network’s predictions on unseen data to ensure its accuracy. Using the trained neural network in real-time trading scenarios to predict market movements.
For the traders out there, this is your forecasting ninja. These neural networks dive deep, spotting patterns that might just slip under the radar. They’re blending past data, current market vibes, and some serious math magic to give you a glimpse of what’s coming. Bottom line? They’re the ace up a trader’s sleeve, giving them the edge in a market that’s always full of surprises.
When you see that indicator light up green, think of it as a clear, sunny day on Wall Street, signaling bullish momentum. But a shift to red? Well, that’s your storm warning, hinting at potential market turbulence on the horizon. And if it’s flashing yellow, brace yourself for some market meandering, neither bullish nor bearish.
Now, let’s peel back the curtain on this marvel. Imagine a Neural Network as a digital brain, tirelessly working to give you the edge in trading. It’s a data-devouring machine, constantly evolving and refining its insights, mirroring the relentless pursuit of excellence we should all embody in trading.
These A.I.-fueled Neural Networks are the Wall Street detectives of the trading world. They delve deep, sifting through a myriad of market data, from intricate technical indicators to global happenings, and even corporate forecasts. And their speed? Absolutely unmatched. They can draw connections between disparate market variables at a pace that leaves even the sharpest human minds in the dust. Spotting correlations, say between a sudden jolt in oil prices and a ripple effect in a regional stock index, becomes second nature to them, offering traders invaluable foresight.
Here’s the golden rule: always seek confirmation. The seasoned Power Traders out there know the magic happens when the predictive blue line and the neural network indicator sing the same tune. When they synchronize up, that’s your cue. Dual green lights? Time to buy. Seeing red on both? Maybe pump the brakes.
In the ever-evolving world of trading, Neural Networks stand tall as the vanguard, unearthing insights and patterns that traditional methods can’t even fathom. It’s no wonder Power Traders are perpetually on the hunt for these high-caliber forecasts, grounded in historical data.
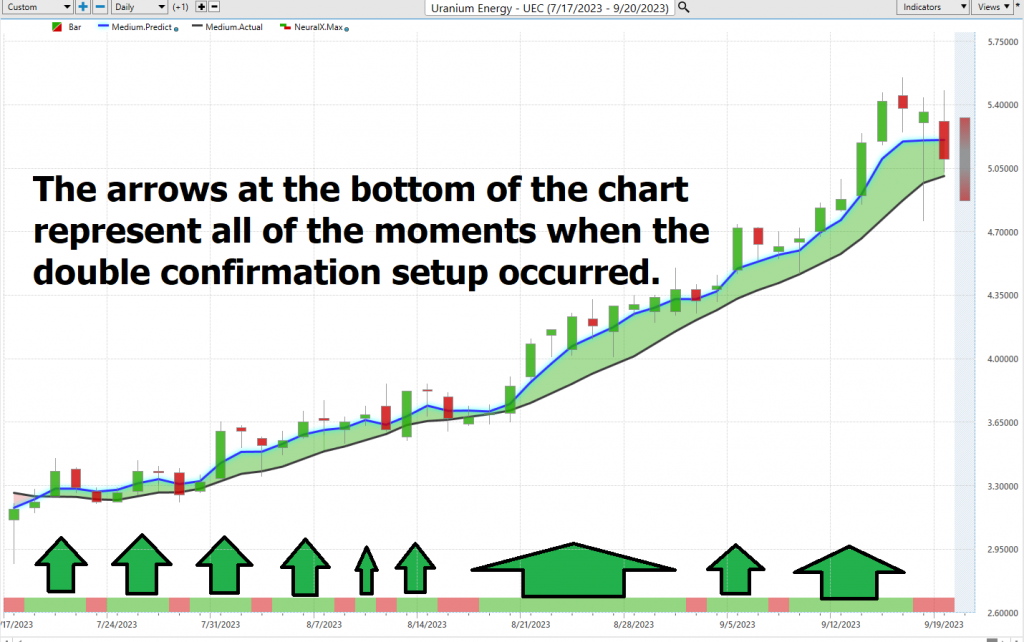
As a Power Trader, you’re not just relying on one tool, but two: the Neural Network and the A.I. forecast. Think of them as your trading world’s Batman and Robin. When both are flashing green, it’s as if the market’s giving you a nod to buy. But when they both turn red? Well, that’s your cue to perhaps step back and sell. So, for all you Power Traders out there, remember it’s that double confirmation that truly sets the stage.
VantagePoint Software Daily Price Range Prediction
Let’s dive into a powerful tool in the trading world, something Power Traders rely on heavily – the Daily Price Range prediction forecast from VantagePoint Software. This tool helps Power Traders pinpoint their market entry and exit points like seasoned pros.
Traders face a daily battle, a real struggle, to figure out when to jump into the market and when to step back. It’s a decision that can keep you up at night. But here’s where VantagePoint’s A.I. comes in, making it a whole lot easier. It dishes out predicted high and low points, painting a clear picture of the opportunity and trend. No more guessing, folks.
Here are the average trading range metrics for $UEC over the past year for the daily, weekly, and monthly time frames.
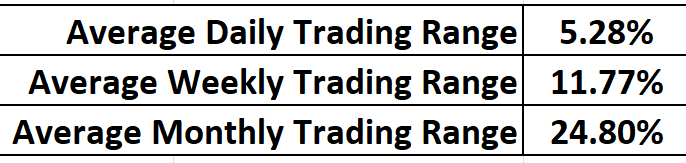
The KEY to successful trading is all about knowing the perfect moment to get in and out of the market. VantagePoint doesn’t just help you find that moment; it does it with remarkable precision. The Daily Range forecast is updated daily, giving you insights into where prices might be headed. Think of it like having a wise old mentor whispering market wisdom in your ear.
Now, check out that chart. It’s not just pretty lines; it’s a guide for placing your stops and managing risk. Notice how prices rarely break below the dark line? That tell you the ideal place to place buy stops is in that specific vicinity. It keeps the risk in check.
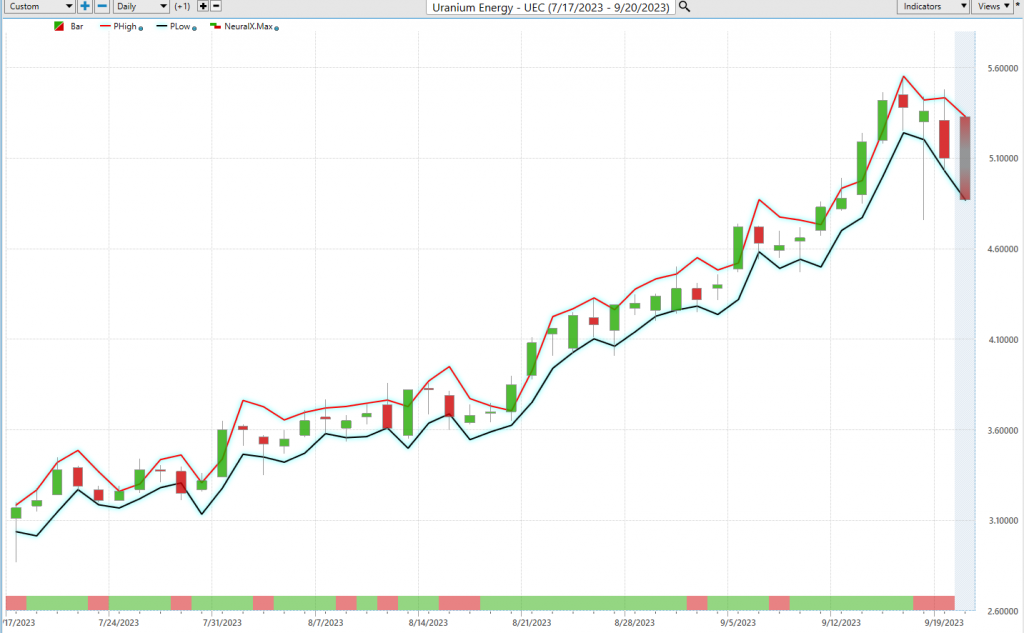
The upper and lower bands of that price range forecast create a clear channel of trading activity. Swing traders, those sharp folks, look for buying opportunities near the bottom of that channel and selling chances near the top. It’s a cautious approach, but it’s loaded with potential for success.
And here’s the kicker. When Power Traders combine this daily range forecast with the double confirmation setup, it’s like having a precision instrument for spotting swing trading opportunities. Look at the chart, and you’ll see the daily range forecast in action, making those moves with surgical precision. That, my friends, is the power of VantagePoint.
Intermarket Analysis
In the world of trading, it’s not just the information you amass, but how you astutely apply it. Traders, much like the detectives of Wall Street, sift through the clamor, zeroing in on the real catalysts behind stock movements. While headlines might grab the spotlight, it’s the traders who delve deep, seeking the truth.
Enter the world of Intermarket analysis. It’s your backstage pass to the financial symphony, revealing the synchronized dance of stocks, bonds, commodities, and currencies. When one asset shines, another might take a step back.
Vantagepoint Software stands out with its mastery in Intermarket analysis, identifying the interconnected assets influencing $UEC.
Charts, with their highs and lows, provide a snapshot of market dynamics. But in this global marketplace, everything’s interconnected. The challenge for traders? Pinpointing the key drivers of their asset’s price.
Pioneers like Jacob Frenkel, Alfred Chandler, and Robert Shiller recognized the ripple effect markets have on the broader economy. Vantagepoint A.I.’s Lou Mendelsohn took this concept and revolutionized it for trading.
In the global financial tapestry, a shift in one market can resonate across others. Recognizing these connections is vital for traders to forecast market movements and refine their strategies. Intermarket analysis, once the purview of the elite, is now accessible to all, revealing the intricate relationships between assets.
Take Uranium Energy ($UEC) as an example. While some might give it a cursory glance, the astute are analyzing the key factors driving its price.
Intermarket analysis is about understanding the global market nexus. A spike in oil prices impacts more than just your gas bill; it can signal rising costs for companies, affecting their stock value. A shift in bond yields can reshape investment flows and currency values.
For newcomers, John J. Murphy’s “Intermarket Technical Analysis” is a guiding light, offering insights into market interplay.
To the traders out there, when assessing a stock’s path, always consider the broader Intermarket landscape. That’s where the true insights lie.
Our Suggestion
Uranium Energy Corp. has posted an impressive average annual earnings growth of 36.7%, outpacing the broader Oil and Gas sector, which has seen its earnings expand at 28.2% annually. Additionally, the company’s revenues have surged at a robust rate of 94.6% each year. Based upon the supply/demand imbalance its performance over the past year has been stellar.
The frequency of annual uranium deficits can vary based on several factors, including weather conditions, geopolitical events, supply chain disruptions, and changes in demand. When these deficits occur, it results in exponential increases in the price of the raw commodity.
While Uranium as a raw staple is plentiful. Uranium is relatively common in the Earth’s crust. It is approximately 40 times more common than silver and 500 times more common than gold. On average, uranium occurs at a concentration of about 2.8 parts per million (ppm) in the Earth’s crust. However, it’s worth noting that not all of this uranium is economically recoverable due to the costs associated with mining and processing. Uranium must be mined, milled, converted, and enriched before it can be used as fuel for Nuclear Reactors. This process takes anywhere from 6 months to several years. It’s essential to understand that the entire process, from mining to fuel fabrication, involves strict regulatory oversight to ensure safety, environmental protection, and non-proliferation of nuclear materials. Because of these oversight measures additional time will be required to bring the supply and demand fundamentals back into equilibrium.
With the current deficits on this basic strategic commodity and energy staple the market is set up to move substantially higher because of the structural supply imbalance.
Currently, the trend is UP.
Momentum is UP.
Based upon the trading range possibilities we will continue to look for trading opportunities based upon the Predictive Blue Line and the Neural Index.
We will continue to explore the long side of the market for short-term swing trading opportunities.
Our recommendation is to follow the A.I. trend analysis as outlined in this stock study and practice good money management on all trades.
We will re-evaluate daily based upon:
- New Wall Street Analysts’ Estimates
- New 52-week high and low boundaries
- Vantagepoint A.I. Forecast (Predictive Blue Line)
- Neural Network Forecast
- Daily Range Forecast
Let’s Be Careful Out There!
It’s Not Magic.
It’s Machine Learning.
Disclaimer: THERE IS A HIGH DEGREE OF RISK INVOLVED IN TRADING. IT IS NOT PRUDENT OR ADVISABLE TO MAKE TRADING DECISIONS THAT ARE BEYOND YOUR FINANCIAL MEANS OR INVOLVE TRADING CAPITAL THAT YOU ARE NOT WILLING AND CAPABLE OF LOSING.
VANTAGEPOINT’S MARKETING CAMPAIGNS, OF ANY KIND, DO NOT CONSTITUTE TRADING ADVICE OR AN ENDORSEMENT OR RECOMMENDATION BY VANTAGEPOINT AI OR ANY ASSOCIATED AFFILIATES OF ANY TRADING METHODS, PROGRAMS, SYSTEMS OR ROUTINES. VANTAGEPOINT’S PERSONNEL ARE NOT LICENSED BROKERS OR ADVISORS AND DO NOT OFFER TRADING ADVICE.


