


This week’s A.I. stock spotlight is VeriSign ($VRSN)
Alright, buckle up — because I’m about to introduce you to a company so dull on the surface, you’d swear it was dead. But just beneath that bland corporate exterior? A fortress of cash, monopoly-like control, and some digital plumbing that makes the modern internet tick. The name’s VeriSign ($VRSN) — and if you’ve ever typed .com or .net into your browser, you’ve already used their services. These guys don’t sell widgets. They don’t care about influencers. And they couldn’t give a rip if the latest app trends are hot or not. What they do care about? Charging rent on the digital land every website lives on.
Here’s the deal: VeriSign is the exclusive registry operator for .com and .net domains. That means every time someone registers or renews a .com domain — whether it’s a mom-and-pop blog or a Fortune 500 juggernaut — it goes through VeriSign. And they don’t host your site. They just manage the name in the internet’s phone book. For this invisible task, they collect $10 per year per domain. Multiply that by over 174 million domain names under their control (most of them .com), and you start to see how VeriSign makes its money: through reliable, almost ritualistic renewal fees. Pure recurring revenue. It’s like owning a tollbooth on the only bridge into Manhattan.
But here’s the kicker… They don’t advertise. They don’t compete. They don’t need to. Why? Because the U.S. government and ICANN (the internet’s global naming authority) awarded them the rights to operate these top-level domains in what is effectively a renewable monopoly. And although this contract gets reviewed periodically, VeriSign has so much infrastructure, historical control, and global integration that replacing them would be like swapping the engine of a jet mid-flight. Oh, and speaking of government deals: most investors don’t realize that VeriSign used to run the root DNS servers for the U.S. government’s cyber infrastructure. They even had a defense division… until they sold it off in 2010 to focus exclusively on domain registry services. Why? Because the margins were too good to ignore.
Now here’s something fun for your next cocktail party: VeriSign’s servers handle over 100 billion DNS queries per day. That’s billion with a B, folks. And these servers are designed to withstand everything from cyberattacks to natural disasters. How secure? Try this: during one of the largest DDoS attacks in history, VeriSign’s infrastructure didn’t blink. They’re essentially the secret bodyguards of the internet, and yet — most traders couldn’t pick their ticker out of a lineup.
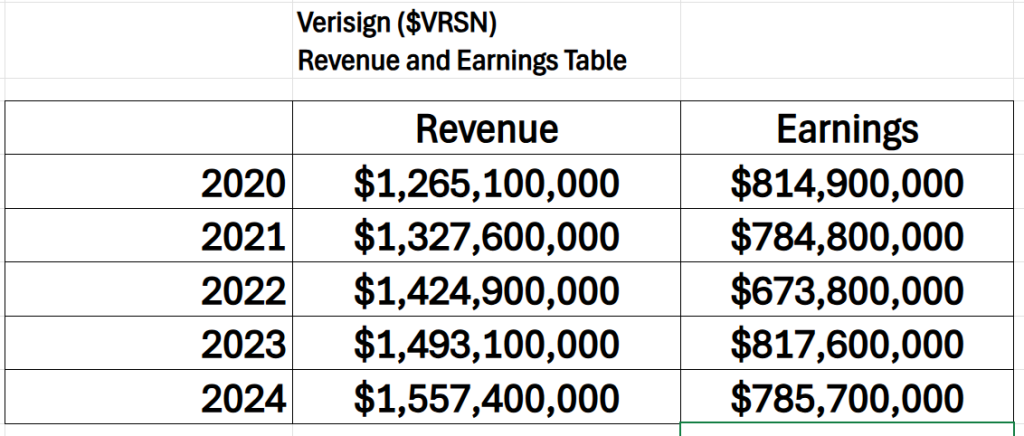
Let’s talk price action. Over the past 12 months, $VRSN is up more than 50%, even while the S&P has limped through volatility. Why? Because Wall Street is finally waking up to a simple fact: cash flow. And VeriSign’s free cash flow margin regularly dances above 60%. That’s right — Six. Zero. Percent. They’ve also been aggressively buying back shares, reducing the float, and padding EPS without adding risk. This is Buffett-style wealth generation… disguised as a tech stock with zero headlines. If A.I. runs the brain of modern commerce, VeriSign runs its nervous system.
In a world full of flashy IPOs, debt-soaked unicorns, and CEOs desperate for attention, VeriSign is the monk in the corner — quiet, focused, and getting rich off everyone else’s chaos. They don’t look sexy. But they don’t need to. They’re not betting on trends. They are the infrastructure the trends are built on. If you’re looking for a stock that’s immune to social media noise, political drama, and the next Fed rate hike — $VRSN should be on your radar. VeriSign’s trend has been quietly compounding for two decades — and its earnings and revenue growth tell a very compelling story.
Let’s peel back a few more layers of this quiet juggernaut, because what VeriSign doesn’t say out loud is just as revealing as what it does. First — location, location, location. VeriSign is headquartered in Reston, Virginia, just a stone’s throw from Washington, D.C., and that’s not accidental. Their proximity to the federal government and cybersecurity stakeholders gave them a strategic seat at the table when the modern internet was being architected. In fact, VeriSign played a pivotal role in operating “A-Root,” one of the 13 root name servers that keep the internet’s entire domain name system humming along globally. So, when someone tells you they’re invested in infrastructure, ask them if it’s real infrastructure — because VeriSign’s is digital bedrock.
How else do they stay relevant? Simple: by doing almost nothing flashy — and doing it flawlessly. Their employees? Fewer than 1,000 people. That’s right. A company with a $20+ billion market cap runs the backbone of global web navigation with a team smaller than your local school district. No bloated org chart. No wild R&D spend. Just lean, focused engineering and brutal operational efficiency. They even keep their profit margins in the 60%+ range — something most cloud companies would sell their souls for.
Here’s another little-known gem: VeriSign doesn’t just rely on current domain registrations — they own the pricing. They’ve negotiated with ICANN the right to raise .com prices by 7% per year, in four out of every six years, through 2029. Read that again. They get to jack up prices on something they already have a monopoly over… and you legally can’t take your .com business elsewhere.
Now, let’s talk risk — because no castle is without its siege ladders. The biggest threat VeriSign faces isn’t competition, it’s regulatory risk. If governments decide to get cute and break up the .com monopoly, or if ICANN revises the contract terms, the moat might spring a leak. But here’s the kicker: this concern gets talked about every few years, and every time, VeriSign renews its agreements without a hitch. Why? Because even regulators realize the internet can’t afford a botched domain registry handoff. It’s just too dangerous. VeriSign is essentially the digital version of “too big to fail” — but with better margins and no toxic balance sheet.
In short, $VRSN is one of the only tech stocks that functions like a royalty. No need to invent the next iPhone. No need to go viral. They just collect a cut every time someone wants to name something online. And when the next billion users come online — guess what? They’re all going to need addresses. And VeriSign will be there, clipboard in hand, quietly raking in the cash.
Here are their revenue and earnings for the past 5 years which clearly show the fortress of financial stability that $VRSN is.
If this kind of stealth wealth-building gets your gears turning, don’t just watch from the sidelines. Learn how to trade with A.I. and spot these unsung titans before they hit the headlines. Because as Jesse Livermore once said: “It was never my thinking that made the big money. It was always my sitting.” VeriSign’s been sitting pretty for years — and the seat just keeps getting more valuable.
Look at the following chart which compares $VRSN with the S&P 500 Index.
In this stock study, we will look at an analysis of the following indicators and metrics which are our guidelines, and which dictate our behavior in deciding whether to buy, sell or stand aside on a particular stock.
- Wall Street Analysts Ratings and Forecasts
- 52 Week High and Low Boundaries
- Best-Case/Worst-Case Analysis
- Vantagepoint A.I. Triple Cross Indicator
- Neural Network Forecast (Machine Learning)
- VantagePoint A.I. Daily Range Forecast
- Intermarket Analysis
- Our Suggestion
While we make all our decisions based upon the artificial intelligence forecasts, we do look at the fundamentals briefly, just to understand the financial landscape that $VRSN is operating in.
Wall Street Analysts Forecasts
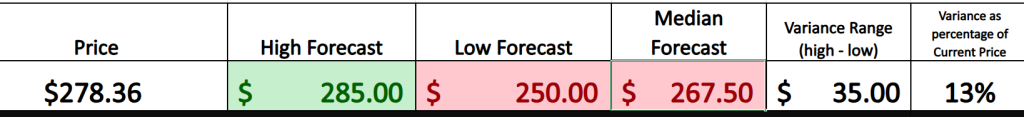
Most folks on Wall Street are quietly bullish on VeriSign (VRSN) — and when the suits start nodding in agreement, you know something’s up. The average analyst pegs the stock at $267.50, not far from its current price of $278.36. That’s close enough to call it a stall… but don’t be fooled. Some heavy hitters are already calling for a “Strong Buy,” with targets as high as $285. The low end? $250. Bottom line? This isn’t a stock that’s swinging for the fences — it’s a rock-solid cash machine hiding in plain sight, and the pros are circling for a reason.
We suggest traders pay attention to the variance between the most bullish and most bearish forecasts. This variance is the expected volatility moving forward. Currently this is 13% of the current price or $35 which is much lower than the broader market.
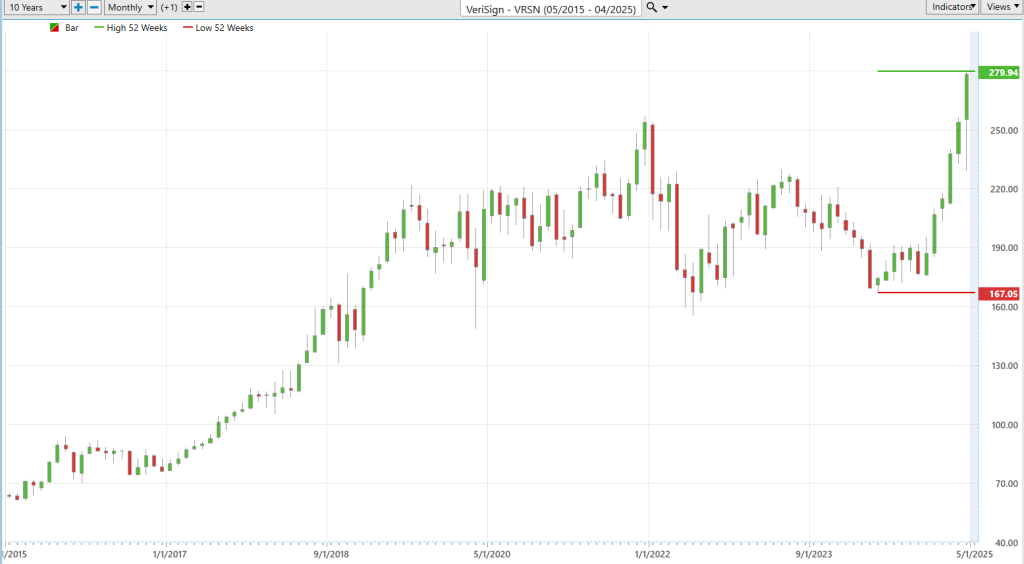
52 Week High and Low Boundaries
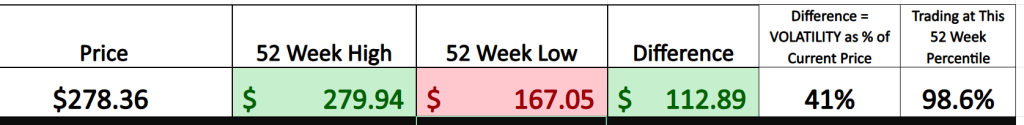
Smart traders don’t chase noise — they watch the tape. And one of the most telling clues? That 52-week high and low. It’s not just some nerdy number buried in a spreadsheet. It’s the battle zone of bulls and bears. Take $VRSN, for example. This stealth wealth machine swung from a low of $167.05 to a high of $279.94 over the past year. That’s a jaw-dropping $112.89 range — roughly 41% of its recent close. Translation? Under the surface of this quiet operator is a beast with real teeth. Historical Volatility like that isn’t chaos — it’s opportunity for traders who know how to ride the wave instead of drowning in it.
If you’re not eyeballing the 52-week range on every stock you trade, you’re flying blind in a storm. That high-low spread? It ain’t just historical trivia — it’s your volatility cheat sheet. You take the top, subtract the bottom, and boom — you’ve got a raw number that tells you how wild the ride’s been. And when a stock breaks through its 52-week high? That’s not just a number on a screen — that’s ignition. That’s where real traders start leaning in, because something’s happening under the hood. And those lows? They’re either bear traps or buried treasure. Either way, this range is your compass, your GPS, your street-smart guide through the market’s back alleys.
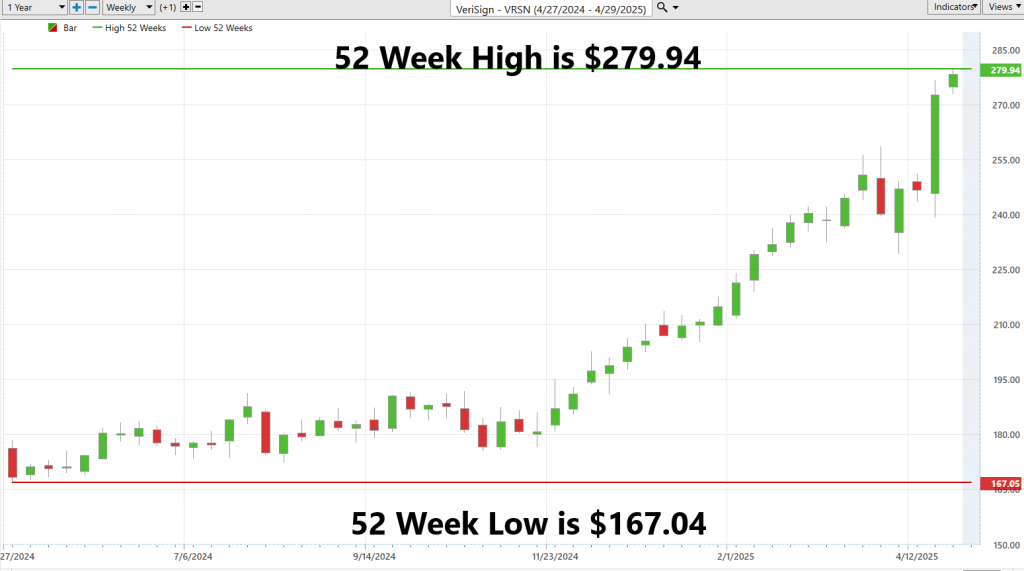
That’s not momentum. That’s a freight train. And right now, $VRSN is doing exactly that. It’s breaking out like a beast, and you better believe the big money’s taking notice. This is where institutions load up, trends explode, and traders who know what to look for make their move.
When we take a broader lens and examine the 10-year chart, an even more compelling narrative emerges. A stock simultaneously reaching new 52-week and 10-year highs is more than just a technical anomaly — it’s a signal, and a powerful one. It often reflects sustained strength underpinned by long-term institutional conviction. This rare alignment suggests that the stock is not merely outperforming in the short term but rather breaking through historical resistance levels that have defined its trajectory for years. In many cases, such a move is a precursor to a significant revaluation — the kind of inflection point that reshapes investor expectations and institutional positioning.
Best-Case/Worst-Case Analysis
I’m about to hand you a lesson that 99% of traders will never get — and that’s exactly why they keep losing their shirts while the real pros rake in the cash like Vegas pit bosses on a hot streak.
Here’s the truth: if you want to win at this game — and I mean win big — you’ve got to stop treating charts like wallpaper and start treating them like treasure maps. Every spike, every crash… those are not random. They’re signals. They’re the greasy fingerprints of the big money syndicates who nudge this game. And if you know how to read those signs? You get to eat at the winners’ table.
You see, the past price action of a stock isn’t just boring history. It’s a battlefield. A crime scene. A confession. And inside that mess is everything you need to predict the next move. Why? Because markets are creatures of habit. They lie, they fake, they twist — but they also repeat. And if you’ve got half a brain and a sharp eye, you can ride the next wave before the suckers even see the swell.
So forget the guesswork. Forget the talking heads. It’s time to look at the most ruthless, most beautiful price surges a stock has ever made — the clean kind that rip through resistance like a hot knife through butter. This is how the big trades get made — the ones that make your broker raise an eyebrow.
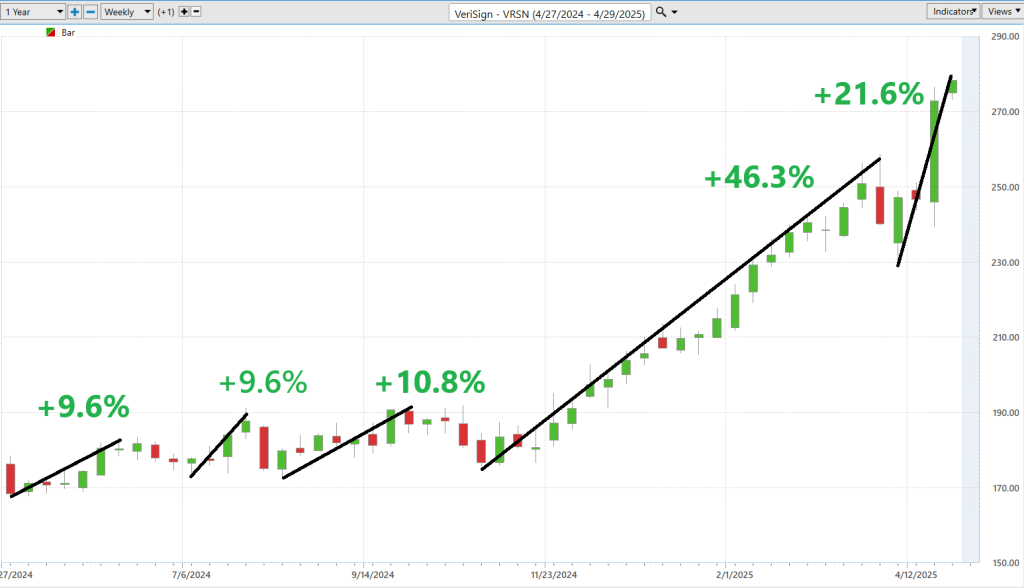
First, we measure the magnitude of the uninterrupted rallies:
Next, we measure the magnitude of the largest uninterrupted declines:
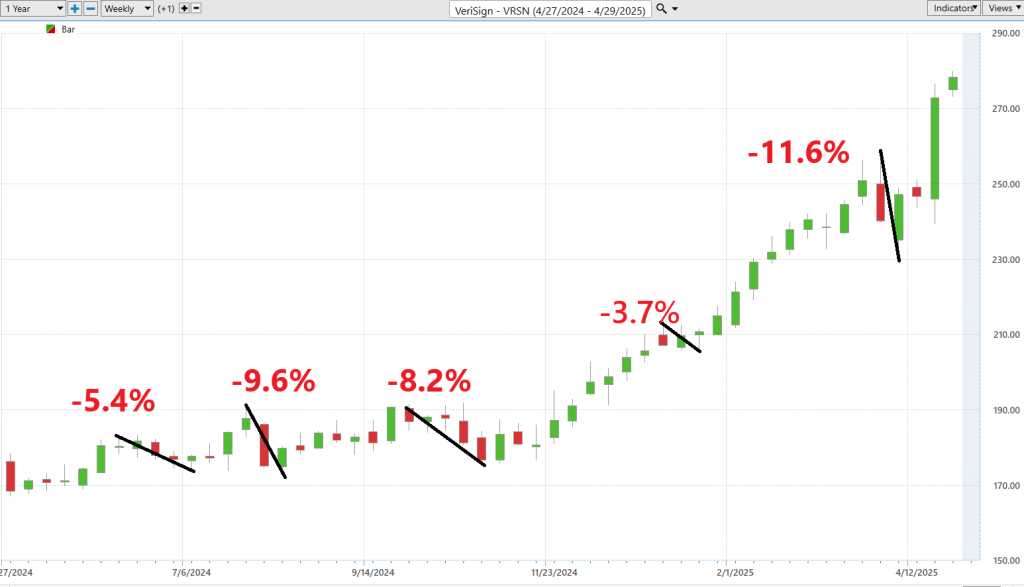
From these two charts we get a pretty solid idea of risk and reward in trading $VRSN. The bulls are in control and the declines have been mild in comparison to the rallies.
Forget the Wall Street fluff and CNBC soundbites — this is where the rubber meets the road. Real risk. Real reward. No sugarcoating. You want to know where the smart money’s sniffing around? This is your launchpad. Right here, you’ll see the biggest, baddest surges and beatdowns in the market — the kind that separates amateurs from assassins. One glance and you’ll know exactly where the action is… and where it’s about to be. More importantly you will know historically how bad the drawdowns have been over the past 52 weeks.
Let’s bring $VRSN into sharper focus and assess its performance within the broader market context. It’s not enough to simply understand how a stock is moving in isolation. The real question is whether $VRSN is leading the market, merely keeping pace, or holding its ground as others falter. That distinction is critical — and it’s precisely the kind of insight that often separates experienced investors from casual spectators.
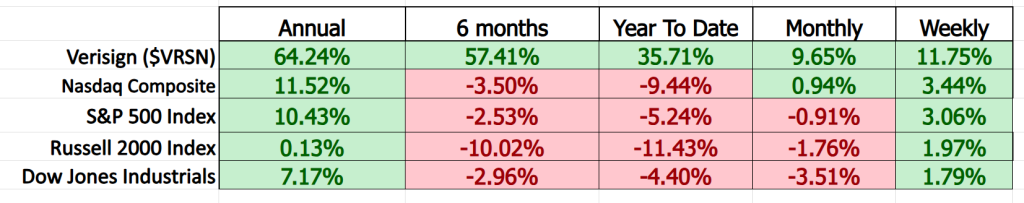
By benchmarking $VRSN against the major indices, we gain a clearer picture of its relative strength, underlying momentum, and strategic direction. In today’s fast-paced environment, where sentiment shifts quickly and volatility can obscure fundamentals, this comparative lens is essential. It’s how savvy investors move beyond noise and identify sustainable performance in a crowded field.
VeriSign ($VRSN) has a beta of 0.87, which tells us something important in plain English — it’s a calmer stock in a chaotic market. While the broader market swings like a wrecking ball, $VRSN moves with measured, deliberate steps. That means it’s less volatile, less risky, and more appealing to long-term investors who don’t want their portfolios doing somersaults every time Jerome Powell clears his throat. In a tech sector filled with hype, hope, and heartbreak, VeriSign stands out as a steady operator with real earnings, real cash flow, and now we know — real stability. That’s the kind of company grown-ups invest in.
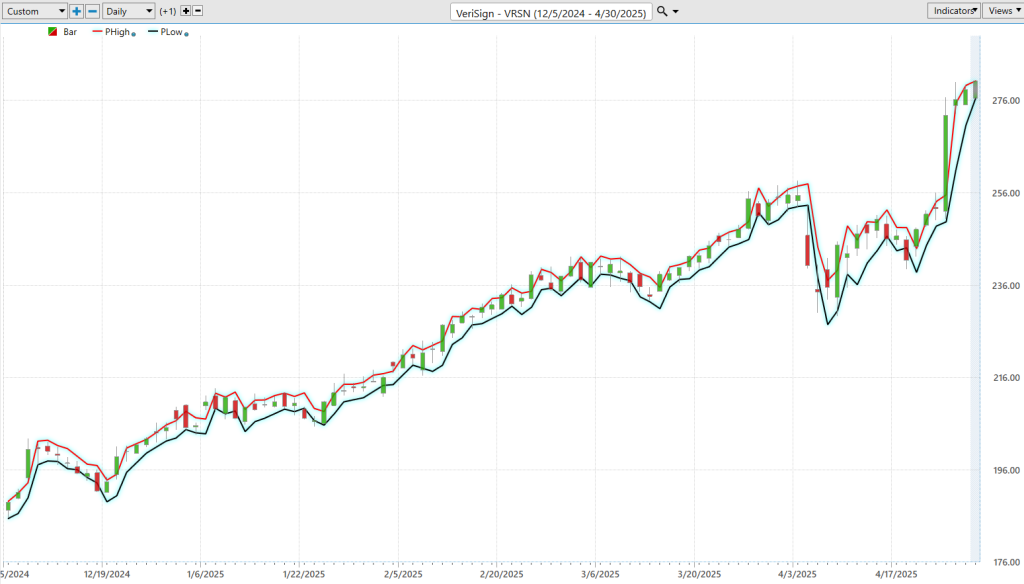
Vantagepoint A.I. Triple Cross Indicator
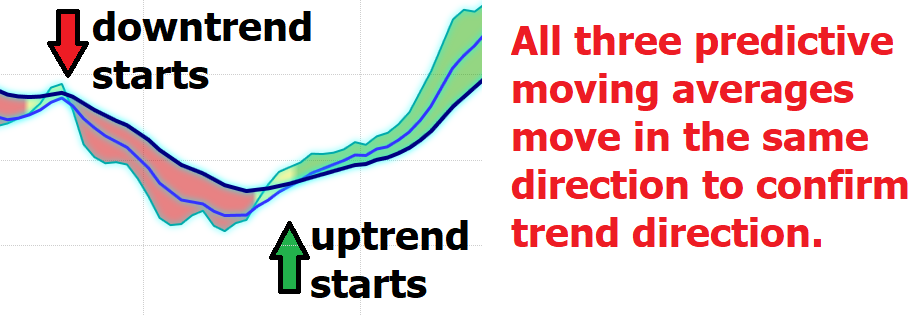
Let’s break this down the way it deserves to be — straightforward, smart, and designed for winners. In today’s fast-paced market, spotting real trends — not just noise — is everything. And that’s where the Triple Cross Strategy from Vantagepoint’s A.I. comes in clutch, especially for steady movers like VeriSign ($VRSN). This isn’t some guesswork voodoo — it’s a smart, data-driven system using three predictive moving averages: 3-day, 8-day, and 18-day. That’s short-term speed, mid-term confirmation, and long-term conviction — working together to call the next big move before the crowd sees it.
What makes this so powerful is that it waits. It doesn’t jump on every head fake or get baited by false signals. It’s disciplined, letting all three signals align before it acts — cutting through the static and delivering high-probability trade setups. That’s how smart traders avoid costly mistakes and stay on the right side of the trade. You don’t have to guess. You don’t have to chase. With tools like this, you can lead the move instead of reacting to it. That’s how wealth gets built — by being early, informed, and confident.
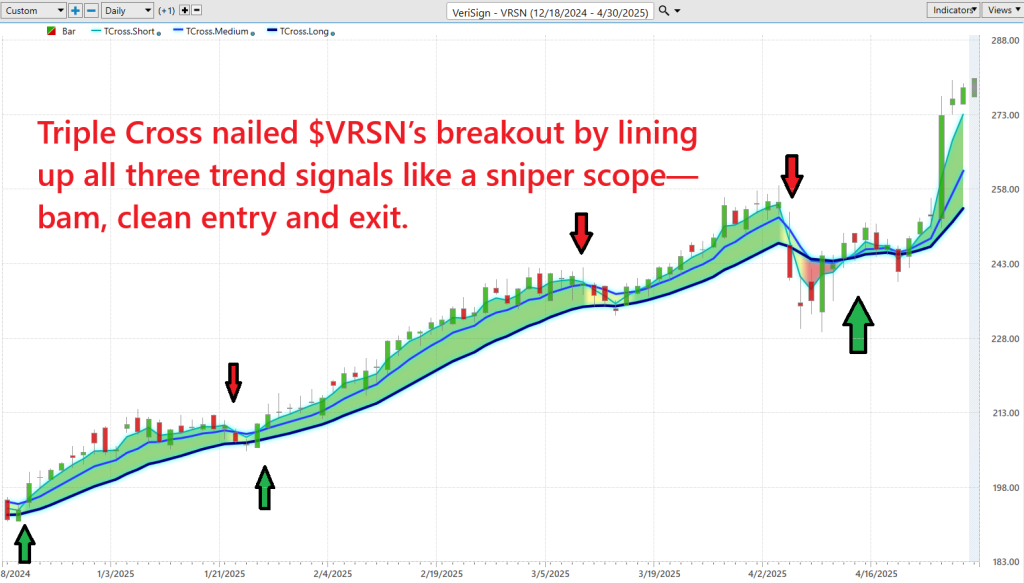
The Triple Cross isn’t just some flashy new indicator — it’s a strategic sentinel for serious traders. In a market flooded with noise, gimmicks, and knee-jerk reactions, this tool stands tall. It doesn’t jump the gun. It confirms each move not once, not twice, but three times — across short, medium, and long-term signals — before giving the green light. That kind of discipline? It’s exactly what separates the winners from the wishful thinkers.
This is about precision, patience, and power. The Triple Cross demands alignment across all three timeframes before it acts — filtering out the nonsense and giving traders only the highest-quality setups. No guessing. No gambling. Just cold, hard confirmation in a world driven by uncertainty. In short, this isn’t just another tool — it’s a trusted ally in a market that doesn’t hand out second chances.
Neural Network Forecast (Machine Learning)
Think of a neural network like a street-smart pit boss for your trading game — it watches every card on the table, tracks every player’s twitch, and figures out who’s bluffing before they even blink. It’s artificial intelligence on steroids, wired to crunch a mountain of market data and spit out predictions that make gut-feel traders look like amateurs. This isn’t magic — it’s machine learning with muscle.
Neural networks are digital brainpower built to outthink, out-analyze, and out-trade the Average Joe. These things are modeled after the human brain, only they don’t get tired, emotional, or distracted by headlines. They chew through market data — tons of it — and start spotting patterns and price movements the rest of us wouldn’t catch if it smacked us in the face. Each “neuron” in the network processes a piece of the puzzle, and over time, they get smarter, sharper, and way more accurate. It’s like teaching a bloodhound to sniff out trades instead of bombs.
Here’s how it works in the trenches: traders feed these networks everything from price history to technical indicators — the works. The network doesn’t guess. It learns. It rewires itself over and over until it can predict trends like it’s reading tomorrow’s headlines today. It’s not perfect (nothing is), but it sure beats winging it.
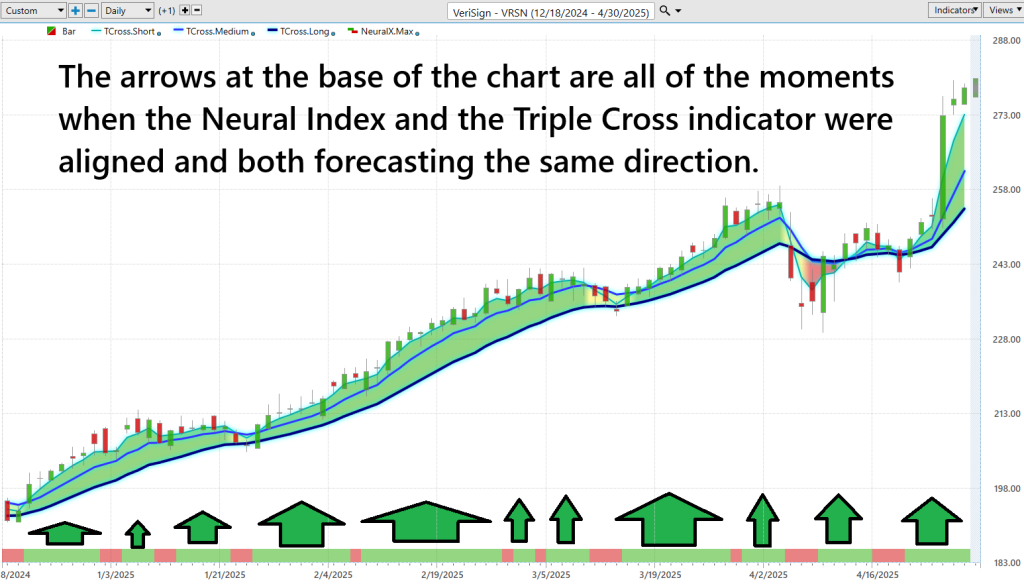
And when it comes time to actually pull the trigger? That’s where tools like the Neural Index Indicator come in. Think of it like a traffic light: green means momentum’s building, red means pump the brakes. Pair that with the Triple Cross Indicator, and you’re not just throwing darts, you’re laser-targeting setups with surgical precision. This isn’t trading fast. It’s trading right. You don’t need to be first — you just need to be accurate. And this A.I.-powered duo stacks the odds in your favor, while the rest of the herd is still guessing.
VantagePoint A.I. Daily Range Prediction
Alright folks let’s stop pretending. The VantagePoint A.I. Daily Range Forecast isn’t just a tool… it’s their heat-seeking missile.
This beast doesn’t guess. It predicts. It gives you surgical strike zones — the exact levels where smart money is loading up or bailing out. No more chasing candles. Just cold, calculated, data-driven precision that tells you when to move… and when to stand down like a sniper waiting for the shot.
You want to know what separates the winners from the washouts? It ain’t hustle. It’s timing. And this A.I. forecast gives you timing that cuts through the chaos like a scalpel through soft butter. One tick too early, and you’re a casualty. One tick too late, and you’re chasing ghosts. But hit that sweet spot? Boom. Game over. You’re banking while the herd is still reading headlines.
Bottom line? If you’re not using this kind of pinpoint accuracy in your trades, you’re showing up to a gunfight with a butter knife.
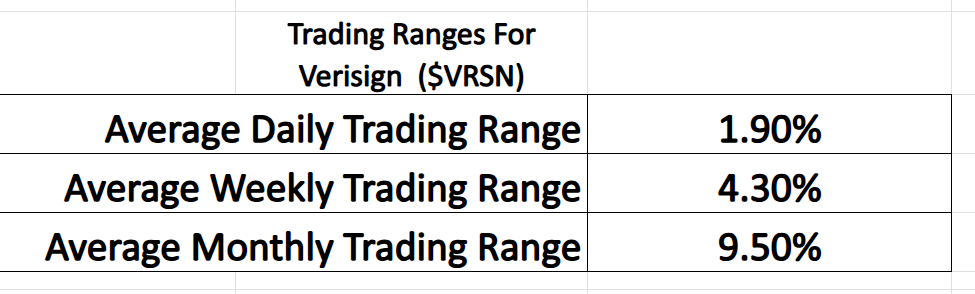
First off, let’s look at the average trading ranges for $VRSN over the past year.
In trading — as in life — timing is everything. And those who consistently win aren’t just lucky… they’re precise. They know exactly when to act. Because in the market’s swirling sea of uncertainty, fortune doesn’t favor the bold — it favors the prepared.
That’s where the Daily Range Forecast becomes your most trusted ally. Think of it as your personal GPS for short-term trades, guiding you with surgical accuracy through the chaos. No guesswork. No hunches. Just a clear, confident path — showing you where the day’s trading range is likely to unfold and in which direction the trend is heading.
This is the kind of tool that quietly gives you an edge… the invisible advantage that turns average traders into seasoned pros. And in a game where one mistimed move can cost you a fortune, having this kind of clarity isn’t just helpful, it’s essential.
Study the VantagePoint A.I. Daily Range forecast in the chart below and you will begin to recognize its utility and effectiveness.
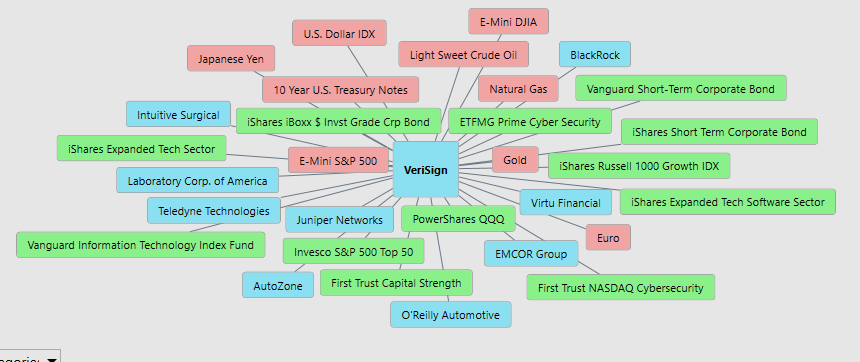
Intermarket Analysis
Intermarket analysis is the study of how different asset classes — like stocks, bonds, commodities, and currencies — interact and influence one another across global markets. It helps traders anticipate moves by revealing correlations and divergences that often signal shifts in momentum, sentiment, or macroeconomic conditions before they show up in price charts.
If you’re wondering why VeriSign ($VRSN) has been holding its ground while much of the market’s been tossing and turning, look no further than the backbone of this economy: technology, cybersecurity, and strong balance sheets. VeriSign isn’t your typical flashy tech name — it’s the quiet powerhouse managing internet infrastructure and domain names with a near-monopoly grip. In times of economic uncertainty, that’s exactly the kind of business Wall Street clings to. The technology sector, particularly those companies tied to software and digital security, remains a key driver here. As businesses and governments pour more money into protecting digital assets, a steady performer like VeriSign — positioned at the crossroads of internet infrastructure and security — stands to benefit.
Now let’s talk about the bond market and interest rates, because they’re influencing everything. With yields on investment-grade bonds falling and short-term corporate debt becoming more attractive, capital is moving away from speculative bets and toward dependable, cash-generating machines like VRSN. Investors are rotating into names that can weather the storm. And make no mistake, this isn’t just about flight to safety. This is about intelligent capital choosing steady income over speculative growth. That’s why assets linked to short-term corporate bonds, conservative growth strategies, and high-quality tech are playing a major role in VeriSign’s price action.
And finally, consider the currency and commodity backdrops. A weaker U.S. dollar, stronger global currencies, and volatile energy prices all add to the uncertainty investors are trying to hedge. You want a company that doesn’t rely on overseas operations or commodity inputs? VeriSign checks both boxes. It’s not swinging with oil prices or tied to eurozone demand, it’s rooted in digital real estate that people pay to rent, year in and year out. In this kind of environment, where the big questions are about inflation, interest rates, and geopolitical risk, investors want businesses that feel more like utilities than unicorns. And VeriSign, with its deep roots in the infrastructure of the internet, is looking more like a utility stock with tech multiples — and that’s why the smart money keeps coming back.
Here are the 31 key drivers of $VRSN price action:
Our Suggestion
In the first quarter of 2025, VeriSign reported revenue of $402 million, a 4.7% increase year-over-year, and earnings per share (EPS) of $2.10. The company added 777,000 domain names, bringing the total to 169.8 million, and improved renewal rates to 75.3%. VeriSign also introduced a quarterly dividend of $0.77 per share and repurchased $230 million in stock. Despite these positives, challenges persist, including a declining domain base, particularly in the U.S. and China, and increased operating expenses.
VeriSign’s next earnings report is scheduled for July 24, 2025, with analysts expecting an EPS of $2.20. Key catalysts moving forward include the company’s ability to stabilize domain name registrations, particularly in international markets, and manage operating expenses effectively. Investors will also be watching for updates on the .web domain litigation and the impact of macroeconomic factors on domain demand.
Why $VRSN Behaves Like a Blue-Chip Stock in This Market
In today’s macroeconomic storm — marked by high interest rates, inflation concerns, and geopolitical unrest — VeriSign ($VRSN) is behaving like a classic blue-chip stock because it delivers what the market craves: stability, profitability, and predictability. With a business model built on recurring domain registration revenues, limited exposure to supply chains or commodities, and near-monopolistic control over .com and .net domains, $VRSN offers cash flow consistency that’s increasingly rare. Investors are hungry for defensive tech plays with strong margins and low volatility — and VeriSign checks every box. Throw in its ongoing share repurchase program, introduction of a dividend, and the fact that it doesn’t need to chase growth to remain profitable, and you’ve got a stock acting more like a royalty blue chip asset.
If you’re serious about stacking wins in this twitchy, headline-driven market — then stick this on your trading radar right now: $VRSN. Watch the news. Study the earnings updates. Use VantagePoint. $VRSN can be a cash cow that has become increasingly attractive in an economy riddled by uncertainty.
This stock could be a disciplined trader’s dream. Predictable trend moves. Crystal-clear A.I.-powered daily forecasts. And enough stability to let you trade without white-knuckling your mouse.
Use the tools. Follow the forecast. And manage your risk like a pro.
$VRSN is the name to watch.
It’s not magic.
It’s machine learning.
Disclaimer: THERE IS A HIGH DEGREE OF RISK INVOLVED IN TRADING. IT IS NOT PRUDENT OR ADVISABLE TO MAKE TRADING DECISIONS THAT ARE BEYOND YOUR FINANCIAL MEANS OR INVOLVE TRADING CAPITAL THAT YOU ARE NOT WILLING AND CAPABLE OF LOSING.
VANTAGEPOINT’S MARKETING CAMPAIGNS, OF ANY KIND, DO NOT CONSTITUTE TRADING ADVICE OR AN ENDORSEMENT OR RECOMMENDATION BY VANTAGEPOINT AI OR ANY ASSOCIATED AFFILIATES OF ANY TRADING METHODS, PROGRAMS, SYSTEMS OR ROUTINES. VANTAGEPOINT’S PERSONNEL ARE NOT LICENSED BROKERS OR ADVISORS AND DO NOT OFFER TRADING ADVICE.


