


This week’s ai stock spotlight is Western Digital Corporation ($WDC)
Western Digital is one of those underappreciated American companies that sits at the center of the digital universe and yet gets almost none of the credit it deserves. Founded in 1970 in California, $WDC has evolved from a simple chip company into a global data infrastructure heavyweight. While the tech media obsesses over A.I. chips and smartphone wars, Western Digital has quietly laid the groundwork for everything from cloud storage to enterprise computing to high-performance gaming systems.
Today, Western Digital maintains a commanding position in the global data storage market. The company generates revenue through three main segments: hard disk drives (HDD), solid-state drives (SSD), and flash-based storage solutions that power everything from hyperscale data centers to personal laptops. Their manufacturing and R&D footprint spans North America, Asia, and beyond. With a market cap in the ballpark of $20 billion, the company may not be a headline-grabber like Nvidia or Apple — but it’s indispensable to the backbone of modern digital life.
Western Digital’s stock has underperformed relative to its flashier tech peers in the S&P 500 and Nasdaq over the last few years — but that divergence may represent opportunity, not weakness. Over the past 12 months, WDC has been quietly making a turnaround as memory prices rebound and flash storage demand picks up with the rise of A.I., cloud workloads, and high-resolution media storage.
What makes Western Digital particularly compelling now is its positioning in a world where data is the new oil, and data security and sovereignty are the new battlegrounds. As nations scramble to build their own tech supply chains, American-made storage infrastructure is suddenly front and center. Western Digital’s vertically integrated business model and joint venture with Japan’s Kioxia give it a strategic edge — especially as U.S. regulators scrutinize Chinese tech involvement in critical systems.
Now, no business is without risk. WDC faces fierce global competition — from Seagate, Samsung, Micron, and rising Asian manufacturers. Pricing in the NAND and DRAM markets is cyclical and often brutal. And while the company is executing well today, it’s not immune to margin pressure or supply chain disruption. That said, the company’s management has been aggressively restructuring its operations, cutting costs, and optimizing its product mix toward higher-margin, enterprise-grade solutions. That’s the kind of American pragmatism that investors should applaud.
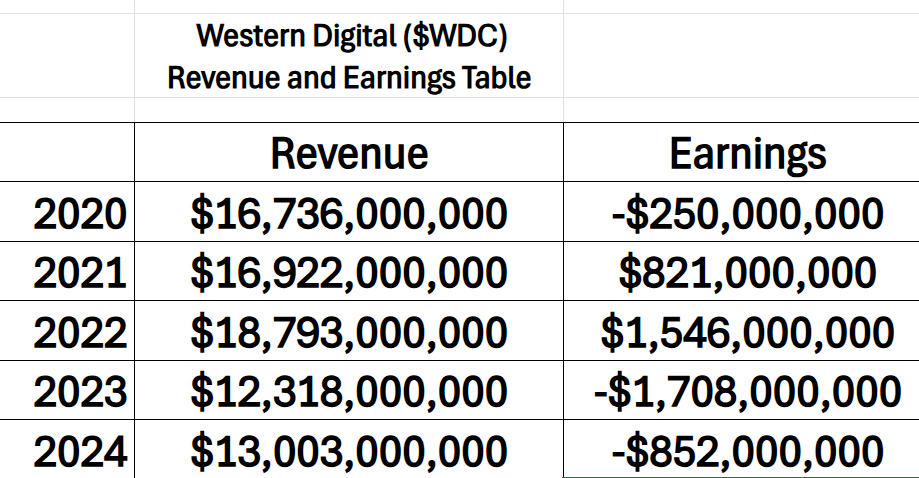
Western Digital ($WDC) has taken investors on a whiplash-inducing ride over the last five years — and the numbers don’t lie. Revenue hovered steadily around $16–18 billion through 2022, but by 2023, it collapsed by over 34% to just over $12 billion. Earnings? Even more dramatic. The company posted losses in three of the last five years, including a brutal $1.7 billion loss in 2023. What changed? The memory and storage markets — sectors where WDC is deeply entrenched — got hit by massive cyclical price declines, inventory gluts, and a sharp post-COVID demand reset.
Combine that with tough competition from Micron and Samsung, soft enterprise spending, and inflation-driven cost pressures, and it’s clear why WDC’s profitability took a nosedive. This isn’t a story of mismanagement — it’s a classic case of being caught in the crosshairs of a volatile industry cycle. That said, the company has responded with operational restructuring, supply discipline, and forward-looking investments in enterprise-grade storage and A.I.-aligned infrastructure. The fundamentals are pivoting — but make no mistake: WDC has been through a war zone, and only now is the dust beginning to settle.
Wall Street currently has a wide range of price targets on the stock. Some analysts see it heading toward the mid-$70s, while others remain cautious, citing macroeconomic headwinds and inventory concerns. But when you analyze that forecast spread relative to the current price, what you’re really seeing is a proxy for forward volatility — a reflection of the high stakes and high variability of the industry. In fact, when you compare that to Western Digital’s 52-week trading range, which spans nearly 50% of the current share price — you realize that the market is already pricing in serious moves, both up and down.
Western Digital’s last two earnings calls struck a confident and forward-leaning tone, signaling that management has transitioned from recovery to assertive execution. They emphasized strong structural demand for cloud and data-center storage, pointing to long-term agreements with hyperscalers and innovative product introductions — like next-gen HAMR platforms and high-capacity HDDs—as evidence they’ve rebuilt momentum.
Rather than timidly managing a comeback, the leadership repeatedly highlighted operational discipline, supply‑chain resiliency, and strategic capital deployment — underscoring that they trust their model and are ready to scale it. In short, the calls felt less like damage control and more like a drumbeat: “We’ve done the hard work, we’ve executed, and now we’re hitting our stride.”
But here’s the kicker — when this stock breaks through resistance and hits new 52-week highs, it doesn’t just move — it rips. Institutional money flows in fast. The algorithms kick in. And traders, sensing momentum, follow the flow. These moments of technical breakout matter — not just to speculators but to long-term investors who understand that breakout behavior is often a symptom of a deeper fundamental shift.
Western Digital’s recent earnings calls have shown a company that is regaining its footing. The tone has shifted from defensive to confident. Management has spoken candidly about ongoing headwinds but has also outlined a forward-looking strategy focused on profitability, product innovation, and strategic partnerships. They’re not just trying to ride the storage wave — they’re positioning themselves to lead the next generation of high-performance, A.I.-ready storage solutions.
And here’s something most traders don’t realize: Western Digital has been quietly developing high-end SSD controllers and firmware that are being integrated across enterprise and hyperscale environments. These are not the kinds of announcements that make headlines, but they build long-term customer stickiness and pricing power. Add in the fact that the company has recently doubled down on cost synergies with Kioxia, and you’re looking at a leaner, more focused, more globally relevant WDC.
So, what’s the trader’s takeaway here?
Simple: $WDC is not a meme stock, it’s a mission-critical American technology company. It may not be glamorous, but it has scale, relevance, and upside. Technically, the stock is forming a solid base near long-term support, with rising accumulation volume — classic signs of institutional buying. If momentum continues and Western Digital breaks out of its recent range, this could be a sleeper bull story in the broader tech sector.
As we look forward, in a world awash in data, geopolitical instability, and the realignment of global supply chains, Western Digital isn’t just another tech name — it’s a strategic asset. And for traders who care about growth with real substance, it may be one of the smartest places to look.
In this stock study, we’ll analyze the key indicators and metrics that guide our decisions on whether to buy, sell, or stand aside on a particular stock. These inputs serve as both our framework and behavioral compass, rooted in data and powered by predictive intelligence.
- Wall Street Analysts Ratings and Forecasts
- 52 Week High and Low Boundaries
- Best-Case / Worst-Case Scenario Analysis
- VantagePoint A.I. Predictive Blue Line
- Neural Network Forecast (Machine Learning)
- VantagePoint A.I. Daily Range Forecast
- Intermarket Analysis
- Our Suggestion
While our decisions are ultimately anchored in artificial intelligence forecasts, we briefly review the company’s fundamentals to better understand the financial environment it operates in. For $WDC this context helps us assess the quality of the A.I. signal within a broader economic and industry backdrop.
Wall Street Analysts Forecasts
Wall Street analysts don’t just check in on $WDC once a quarter — they live and breathe this stock. These folks are watching every headline, every supply chain shift, every DRAM pricing signal — 24/7. And when you see a spread like this between the bulls and the bears, you better believe it matters.
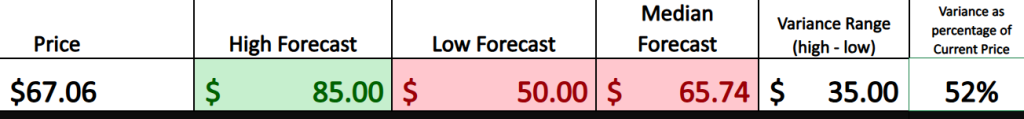
Right now, based on 20 analysts covering Western Digital over the past three months, the average 12-month price target is $67.32, just a touch below the current price of $68.74. But here’s where things get interesting: the most bullish target is $85.00, while the most bearish sits way down at $50.00 — that’s a $35 trading range, a wide spread that suggests real uncertainty and real opportunity. That $35 range, expressed against today’s price, is your 52% expected volatility for the year ahead. Traders should pay close attention here — when smart money disagrees this much, something big is brewing beneath the surface.
Wall Street analysts are telling us that the expected volatility is 52%. That is massive.
52 Week High and Low Boundaries
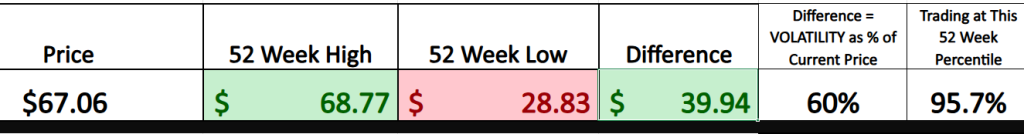
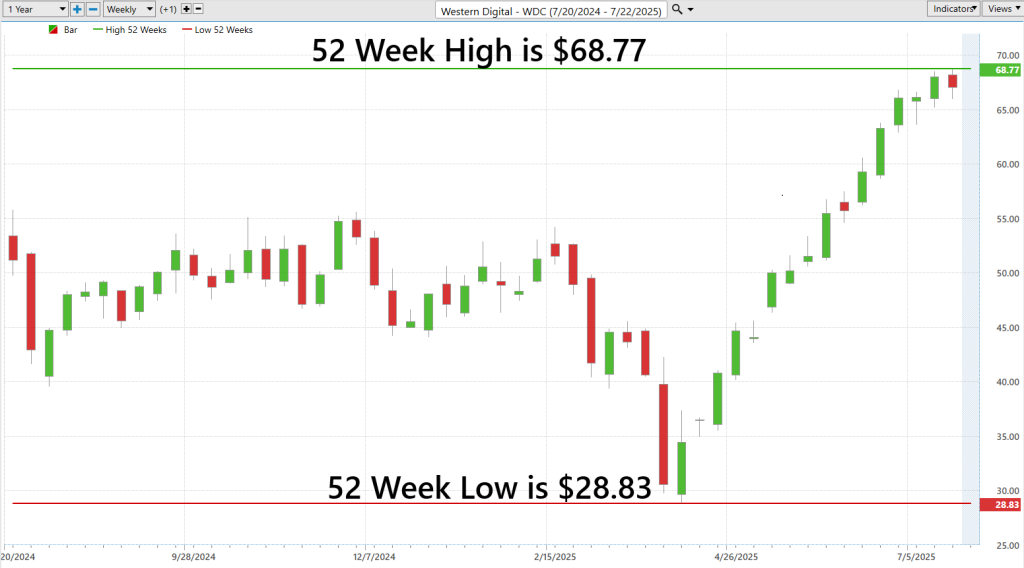
Let’s cut the polite small talk and get right to the meat — if you want to understand $WDC, you start by drawing your lines in the sand: the 52-week high of $68.77 and the 52-week low of $28.83. That’s your battlefield. That’s where every trader, fund manager, and algorithm has been pushing, pulling, and bleeding over the past year.
Now here’s the math that separates gamblers from pros: take that $39.94 range and compare it to today’s price of $67.06. You get a historic volatility of roughly 60%. That’s not a gentle stroll through the market — that’s a wild bronco bucking through tech cycles, flash memory pricing, and global economic headwinds. Stocks with this kind of historic volatility don’t move — they lurch, leap, and punish anyone who isn’t paying attention.
And this is exactly why real traders monitor those 52-week high and low boundaries like a hawk. The high tells you where the bulls won the last big fight. The low? That’s where the bears dragged it into the basement. But here ’s the kicker — the best-performing stocks? They keep breaking through those 52-week highs. That’s momentum. That’s strength. And when it happens, it’s a neon sign flashing “trend in motion.” Miss it, and you miss the trade.
If you’re serious about capturing moves, you don’t chase noise. You study the extremes — because that’s where opportunity lives.
The 52-week high/low range helps you ask the right questions:
Is the stock in accumulation or distribution? Is it sitting at the top, begging for a breakout? Or is it languishing at the bottom, waiting for a reversal? That’s the power of understanding these boundaries. They aren’t just lines — they’re market psychology in action.
Bottom line: the smart traders don’t ignore the 52-week range — they build their game plan around it. Because when a stock is pushing its upper limits like Oracle is now, the message is clear: this thing’s moving, and the market knows it.
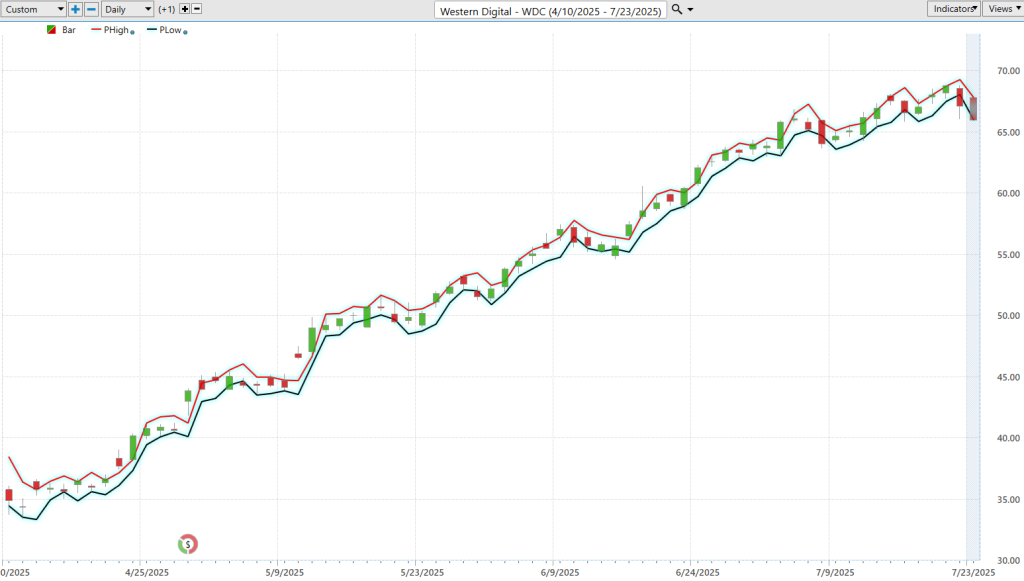
When we look at the 52-week chart we can see the trajectory which the stock has had over the past year. Observe when it made new 52-week highs and how the pattern continued.
Best-Case/Worst-Case Scenario Analysis
One of the enduring lessons for any trader operating in today’s financial markets is this: volatility isn’t noise, it’s signal. In a world that moves faster than ever before, understanding what volatility represents is more than a risk-management exercise. It’s foundational. Because while we all confront price swings daily, the implications of those movements — for position sizing, for conviction, for portfolio construction — are often poorly understood or dangerously oversimplified.
High-volatility assets are fundamentally different animals. They demand a level of precision that goes beyond enthusiasm or instinct. They require smaller position sizes, not because the opportunity is less compelling, but because the risk of being wrong is exponentially higher. A 10% swing in a mega-cap stock may be an event. In a high-beta name, it’s a Tuesday. Misjudging that scale introduces risk that no model can hedge.
This is precisely why the 52-week range, the absolute high and low over the past year, remains one of the most important metrics in a trader’s toolkit. Not because it predicts the future, but because it defines the emotional bandwidth the market has already priced into a name. Fear. Euphoria. Capitulation. Accumulation. All of it is embedded in those boundaries. It is sentiment made quantifiable.
And here’s the nuance that separates the amateur from the professional: when the fundamental narrative remains intact — strong cash flow, structural tailwinds, pricing power — the 52-week range shifts from being a warning label to a strategic lens. It helps contextualize present risk and frame future opportunity. In markets where perception can swing on a headline, knowing how far something has stretched, or how fast it can snap back, is not a theoretical luxury. It’s essential.
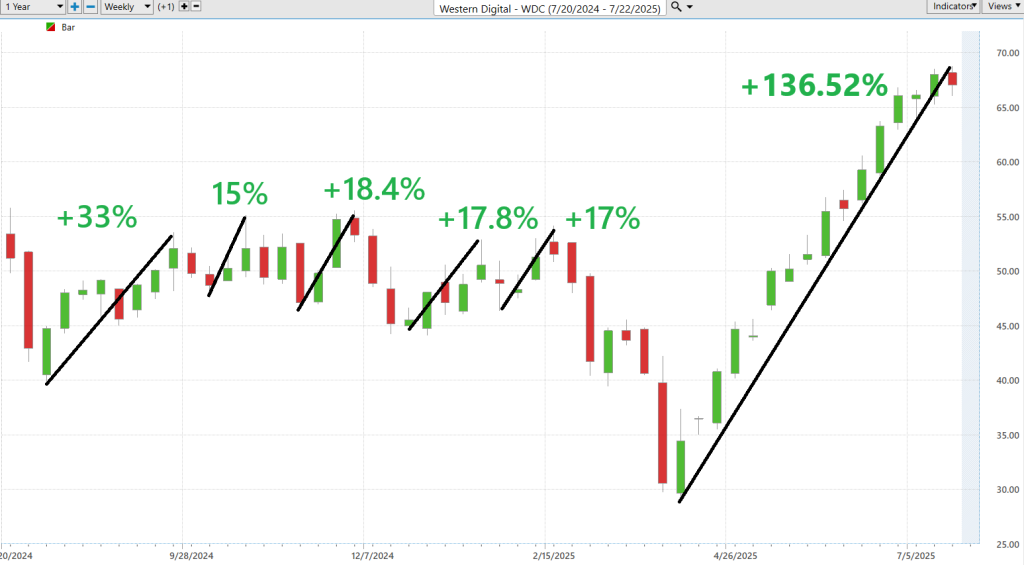
So, before you place capital, before you run your model or draft your thesis, start with the range. Look at the magnitude. Map the biggest, uninterrupted moves on the weekly chart. Because in a world where narratives are fleeting and liquidity is anything but guaranteed, magnitude still rules the game. And those who respect it tend to last a whole lot longer than those who don’t.
We start by measuring the largest uninterrupted rallies.
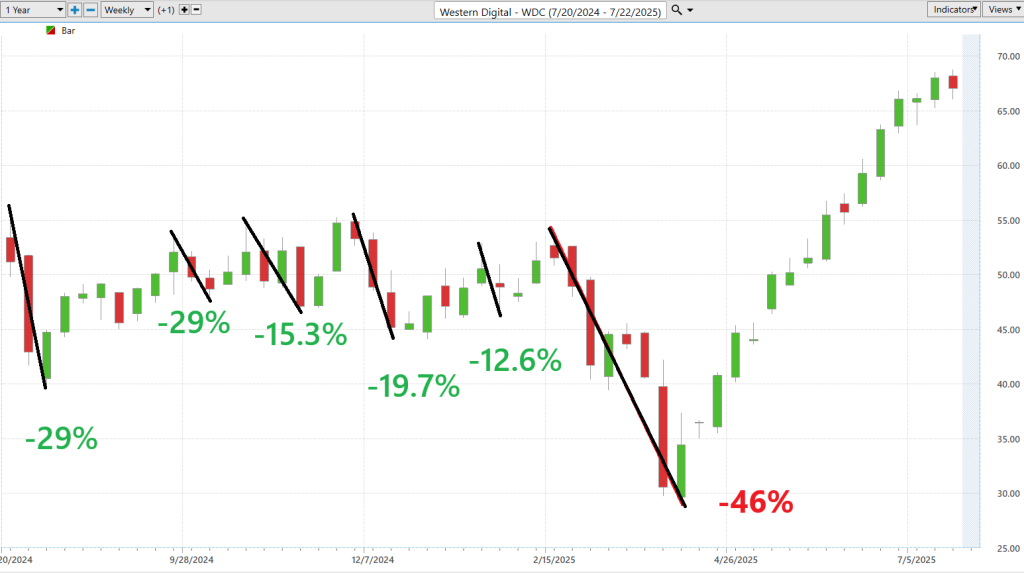
Then we measure the largest uninterrupted declines. From these two charts we get a very clear picture of the risk and reward opportunities in $WDC.
Next, we look at $WDC and compare it to the performance of all the major stock market averages.
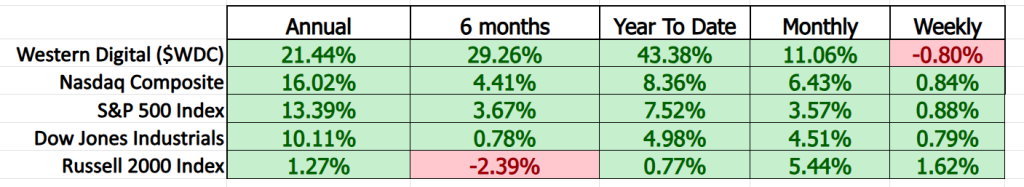
The graphic tells a clear story — Western Digital ($WDC) has been an absolute standout performer, outpacing all major indexes across every significant timeframe, from annual returns to year-to-date momentum. And not by a little — by a wide, commanding margin.
- Over the last 12 months, WDC is up +21.44%, compared to just +16.02% for the Nasdaq, +13.39% for the S&P 500, and a modest +1.27% for the struggling Russell 2000. That’s a +5.4 percentage point delta vs. the Nasdaq, and a massive +20-point beat over small caps.
- The 6-month surge is even more striking. WDC has climbed +29.26%, while the Nasdaq has only managed +4.41%, and the S&P 500 +3.67%. That’s not outperformance — that’s dominance.
- On a year-to-date basis, the trend continues with WDC up a staggering +43.38%, compared to +8.36% (Nasdaq), +7.52% (S&P 500), and just +0.77% (Russell 2000).
- Even over the last month, WDC is up +11.06%, nearly double the Nasdaq’s +6.43% and over three times the S&P’s +3.57%.
So, what’s driving this breakout performance?
First, we’re seeing stronger-than-expected demand recovery in the memory and storage market — particularly flash storage, where $WDC has unique leverage. After a brutal downcycle, pricing is stabilizing, inventories are normalizing, and enterprise demand is beginning to ramp again, especially with generative AI requiring vast amounts of high-speed data storage.
Second, Western Digital is executing a turnaround story that the market finally believes. Cost-cutting, asset optimization, and a renewed focus on profitability — combined with the potential spin-off or reorganization of its flash business — are giving investors something tangible to bet on.
Third, this is a re-rating in progress. After years of underperformance and compressed multiples, WDC is showing that it cannot only survive volatile cycles but thrive as the digital storage backbone in an increasingly A.I.-driven world. When the narrative shifts from survival to leadership, stocks don’t just grind higher — they rip.
Yes, $WDC slipped slightly over the past week (-0.80%), but that looks more like a healthy pause after a parabolic run than a change in trend. For traders and investors alike, the takeaway is clear: this is leadership behavior, and it demands attention.
Every stock moves — some more than others — and beta is the tool we use to quantify just how much more. For Western Digital ($WDC), the beta is currently around 1.6. That means if the broader market (like the S&P 500) moves by 1%, WDC typically moves by about 1.6% in the same direction (and sometimes more on the way down).
Imagine your portfolio is like riding a bike on a paved road. A beta of 1.0 is smooth pavement — predictable, steady. But WDC? It’s more like a mountain trail with rocks and roots. Those 1.6 times reverberate through everything: you’ll feel the bumps more, but you can also pick up speed faster on the downhill.
So, why does this matter? Because higher beta means bigger moves — both up and down. That’s great if you’re right, and brutal if you’re wrong. It’s like using a sports car instead of a minivan: faster and more exciting, but riskier if you don’t handle it well.
In practice, that means position sizing and risk controls must adjust accordingly. You don’t go full-throttle with high-volatility names like WDC — you scale your bets, set tight stops, and stay alert. Understanding beta isn’t optional. It’s a compass — showing you both where you might go fast…and where you might crash if you.
Vantagepoint A.I. Predictive Blue Line
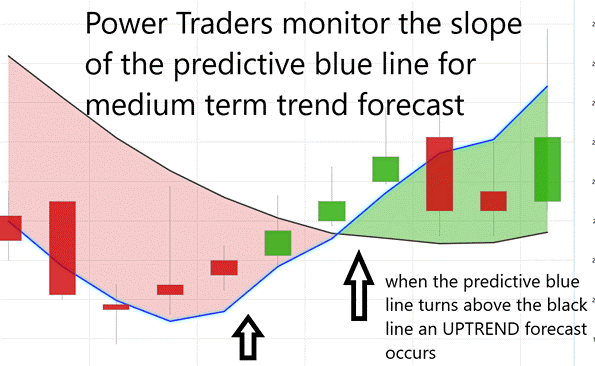
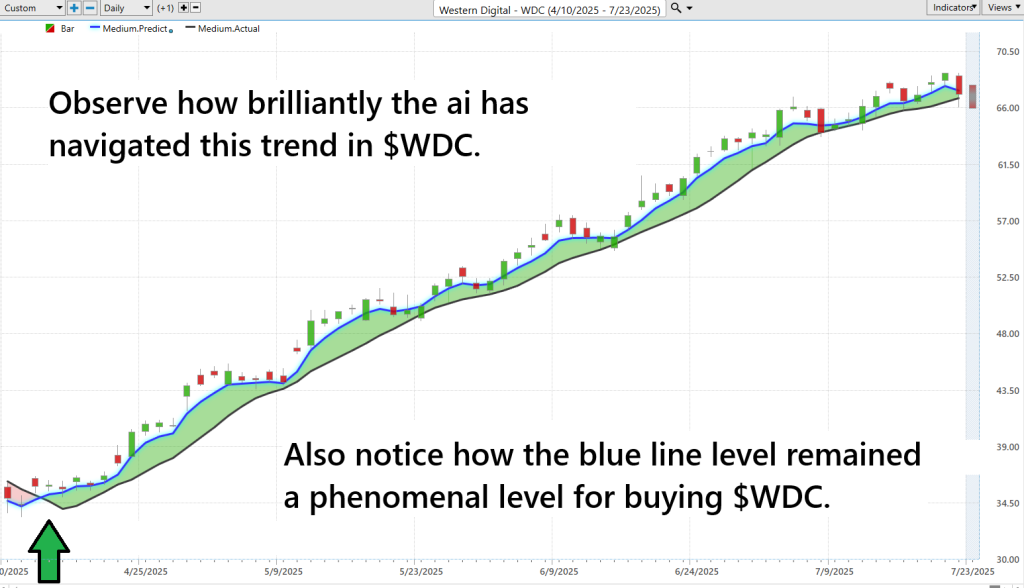
Let me be perfectly clear — in today’s fast-moving markets, where headlines are churned out by algorithms and volatility rules the day, traders need an edge that’s forward-looking, not reactive. That’s exactly what the VantagePoint A.I. Predictive Blue Line delivers. It’s not some backward-looking lagging indicator — it’s artificial intelligence applied with precision, trained to detect momentum shifts before the crowd catches on. When that Blue Line turns upward, it’s often the earliest sign that Western Digital ($WDC) is being quietly accumulated by institutions. And when the line rolls over? That’s your warning — reduce your position, tighten your stops, or get out before the trend turns against you. It’s a tactical early-alert system, and in markets like these, it’s essential.
But here’s where it gets even more powerful: the Value Zone. That’s the narrow window where $WDC trades near or just below the VantagePoint Predictive Blue Line in a confirmed uptrend. To the average trader, it might look like a pullback. But seasoned pros know — this is often where the smart money steps back in. Conversely, if $WDC pops above the line while in a downtrend? Watch out. That’s frequently a bull trap — the kind that catches latecomers right before the rug gets pulled. The Predictive Blue Line isn’t just about direction — it’s about context. It reveals intent, structure, and opportunity. In a market driven by uncertainty and machine-driven moves, this tool isn’t just helpful — it’s a serious advantage for any trader who wants to stay ahead of the curve.
Neural Network Forecast (Machine Learning)
In a market where the speed of information can make or break your next trade, the smartest traders aren’t guessing — they’re anticipating. They’ve discovered something better than gut instinct, better than outdated indicators, and far better than chasing headlines: neural networks. These digital brains, modeled after the human mind but free of emotion and fatigue, are quietly rewriting the rules of trading. They study decades of price action, volume, and intermarket behavior — and then do something no human can do: they learn. Constantly. They adapt in real time, find hidden patterns, and forecast with a level of accuracy that leaves old-school tools in the dust.
What does this mean for you?
It means the days of reacting late, chasing moves, and second-guessing yourself can finally end. Because when you pair the VantagePoint Predictive Blue Line with the Neural Index, you get a high-probability signal — one that’s forward-looking, built on thousands of market relationships, and refined by decades of historical data. The Predictive Blue Line tells you where price is likely headed. The Neural Index confirms whether the underlying momentum supports the move. Together, they give you what every trader dreams of: confidence backed by cold, hard data. In a world driven by noise, this is your filter. In a market built on speed, this is your edge. And in an industry where most people are gambling, this is your tactical advantage.
This isn’t some gimmick or feel-good chart overlay — it’s a tactical warning system, designed to help serious traders avoid costly mistakes, tighten up their exits, and protect hard-earned profits. Most folks out there aren’t trading — they’re guessing, reacting to headlines and chasing hype while Wall Street picks their pockets clean. But with the Neural Index, you’re operating with real intelligence — cutting through the noise, spotting momentum early, and acting before the herd even knows what’s coming.
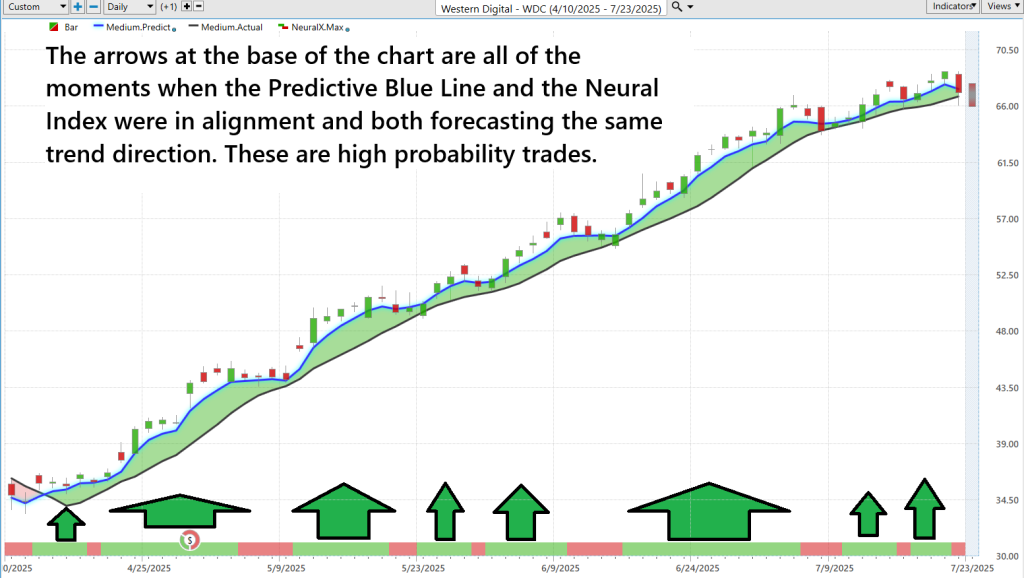
On the chart below the arrows at the base of the chart are all the moments when the Predictive Blue Line and the Neural Index were in alignment and both forecasting the same trend direction. These are high probability trades.
VantagePoint A.I. Daily Range Forecast
Volatility isn’t the enemy — it’s the signal. It’s the rhythm and breath of the market, the real-time reflection of shifting sentiment, risk appetite, and capital flows. For investors serious about building wealth over time, the goal isn’t to avoid volatility — it’s to understand it, anticipate its patterns, and use it as a framework for strategic decision-making.
Take a closer look at $WDC’s average trading ranges across daily, weekly, and monthly intervals. These numbers aren’t just statistics — they’re the outlines of opportunity, revealing how far the market is willing to move and where the next inflection points may emerge.
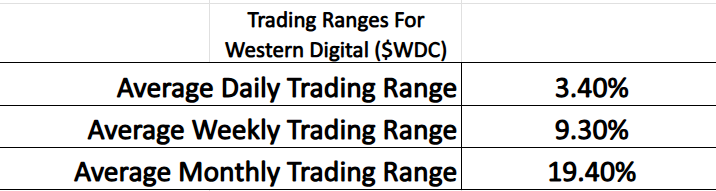
Traders let’s talk about what really matters in the day-to-day battle for profits: knowing your range and respecting it. The data on Western Digital ($WDC) says it all — an average daily trading range of 3.40%, weekly range of 9.30%, and monthly swings hitting 19.40%. That’s not noise — that’s fuel for short-term traders who know how to ride momentum and manage risk. When a stock gives you that kind of daily movement, it’s telling you: “There’s opportunity here — if you’re disciplined enough to harness it.”
And that’s the purpose of any real trading system, keeping you on the right side of the right trend at the right time. You’re not chasing. You’re not reacting. You’re planning, with data that shows exactly how far a stock like $WDC is likely to move. Whether you’re swing trading or scalping intraday moves, having a reliable picture of a stock’s volatility puts you in control.
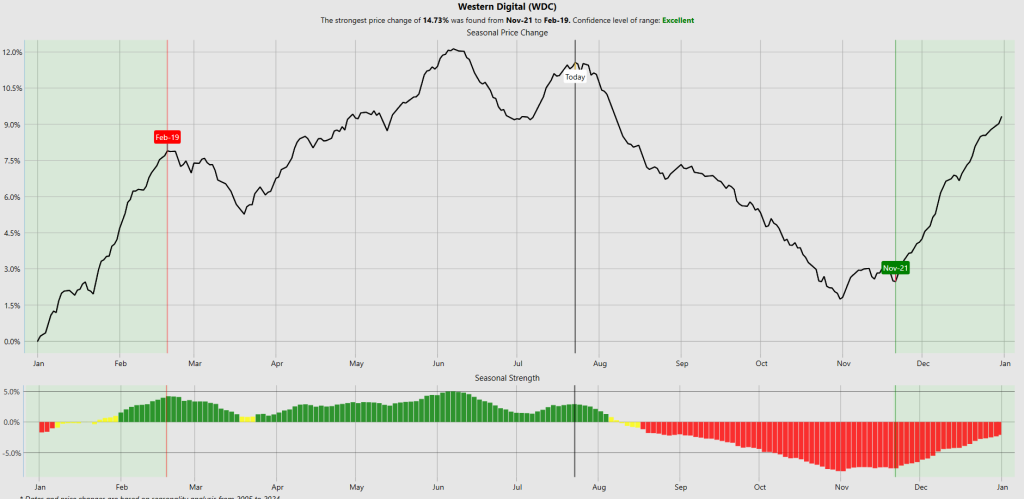
VantagePoint A.I. Seasonal Analysis
Seasonal analysis, as used by VantagePoint A.I., is like having a time-tested market calendar in your corner — it reveals recurring patterns in price behavior that tend to show up at the same time each year. By analyzing decades of historical price data, the system identifies reliable seasonal trends — the kind that consistently show up in commodities like grains and energy. But here’s the key: this isn’t about prediction, it’s about stacking probability in your favor. When seasonal analysis confirms what your other indicators are already telling you, it becomes a powerful green light — a second opinion backed by history, not hype. It’s not a standalone magic wand, but when paired with strong technical or fundamental signals, it becomes a precision timing tool. In short, it’s one more edge for traders who believe in probability over prediction — and profits over guesswork.
Seasonal analysis of Western Digital ($WDC) has been nothing short of impressive — confirming with pinpoint accuracy the stock’s powerful 12-week rally that began back in mid-April. According to the data, the strongest seasonal price change historically runs from November 21st to February 19th, with an average gain of 14.73% and an excellent confidence level. That’s not theory — that’s results, backed by nearly two decades of price action. But here’s the bottom line, folks: we’re now fast approaching that seasonal peak, and the smart money is watching closely. When a chart shows this kind of consistent behavior, you don’t ignore it — you prepare. Because while the ride’s been strong, timing is everything, and we’re nearing a critical inflection point where discipline matters more than ever.
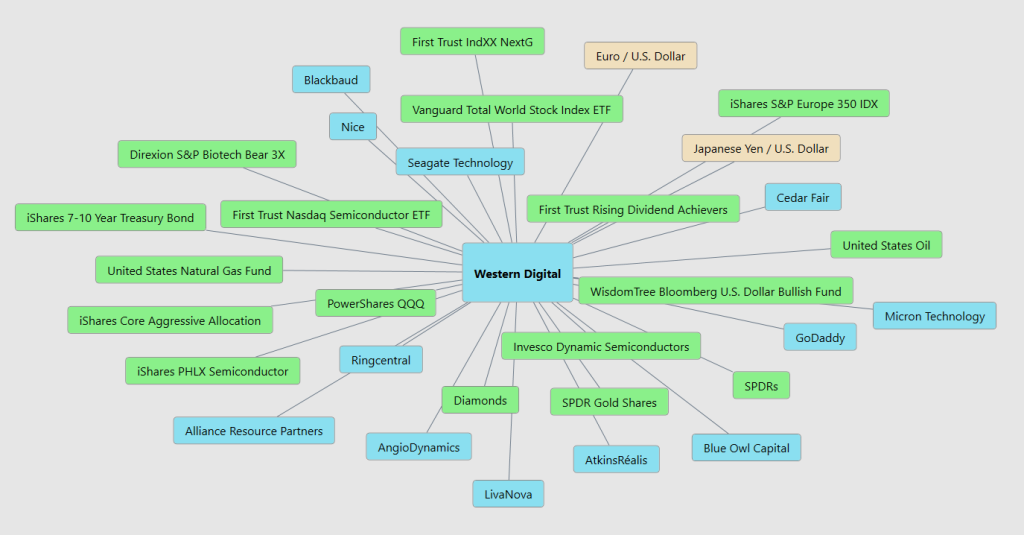
Intermarket Analysis
If you’ve ever wondered what moves a stock like Western Digital ($WDC), the answer is simple: everything that matters to big money. When the tech sector runs hot — when the Nasdaq is rising and AI headlines flood the news — money rotates into storage plays like WDC. That’s because every major innovation, from the cloud to machine learning, demands one critical thing: data storage. And $WDC provides it. Their drives aren’t just boxes of tech — they’re the infrastructure of the digital world. That’s why you’ll often see the stock riding the coattails of the tech rally… and sometimes leading it.
But tech trends alone don’t tell the full story. Chip prices, supply chain stability, and interest rate policy all tug at WDC’s margins and momentum. When NAND prices jump and WDC can pass those increases on, the stock can surge. When rates rise or the dollar gets too strong, foreign buyers pull back — and so does the stock. That’s why serious investors don’t just follow headlines — they track intermarket relationships: tech strength, bond yields, commodity prices, and currency swings. These aren’t just macro signals — they’re the levers of influence behind every institutional trade.
And then there’s the power of the company’s own moves — earnings surprises, product announcements, strategic spin-offs. These are the sparks that light the fuse. WDC’s push into A.I.-optimized storage and its bold restructuring of its SSD business aren’t just press release fluff — they’re strategic plays aimed at unlocking long-term value. That’s why 21 analysts are rating it a buy, and price targets are climbing. Bottom line? WDC isn’t just a storage stock. It’s a leveraged bet on the future of data, driven by the smartest money in the room. Learn how it moves, and you’ll be far ahead of the crowd.
Here are the 31 key drivers of price for $WDC:
Our Suggestion
If you’ve ever wondered what moves a stock like Western Digital ($WDC), the answer is simple: everything that matters to big money. When the tech sector runs hot — when the Nasdaq is rising and A.I. headlines flood the news — money rotates into storage plays like $WDC. That’s because every major innovation, from “the cloud” to machine learning, demands one critical thing: data storage. And $WDC provides it. Their drives aren’t just boxes of tech — they’re the infrastructure of the digital world. That’s why you’ll often see the stock riding the coattails of the tech rally… and sometimes leading it.
But tech trends alone don’t tell the full story. Chip prices, supply chain stability, and interest rate policy all tug at $WDC’s margins and momentum. When NAND prices jump and $WDC can pass those increases on, the stock can surge. When rates rise or the dollar gets too strong, foreign buyers pull back — and so does the stock. That’s why serious investors don’t just follow headlines — they track intermarket relationships: tech strength, bond yields, commodity prices, and currency swings. These aren’t just macro signals — they’re the levers of influence behind every institutional trade.
And then there’s the power of the company’s own moves — earnings surprises, product announcements, strategic spin-offs. These are the sparks that light the fuse. $WDC’s push into A.I.-optimized storage and its bold restructuring of its SSD business aren’t just press release fluff — they’re strategic plays aimed at unlocking long-term value. That’s why 21 analysts are rating it a buy, and price targets are climbing. Bottom line? $WDC isn’t just a storage stock. It’s a leveraged bet on the future of data.
Put $WDC on your trading radar — this stock is setting up to deliver multiple high-probability opportunities in the months ahead.
To capitalize, stay disciplined: manage your risk, protect your capital, and position wisely.
For short-term trades, rely on the VantagePoint A.I. Daily Range forecast — a powerful tool designed to help you time entries and exits with precision.
It’s not magic.
It’s machine learning.
Disclaimer: THERE IS A HIGH DEGREE OF RISK INVOLVED IN TRADING. IT IS NOT PRUDENT OR ADVISABLE TO MAKE TRADING DECISIONS THAT ARE BEYOND YOUR FINANCIAL MEANS OR INVOLVE TRADING CAPITAL THAT YOU ARE NOT WILLING AND CAPABLE OF LOSING.
VANTAGEPOINT’S MARKETING CAMPAIGNS, OF ANY KIND, DO NOT CONSTITUTE TRADING ADVICE OR AN ENDORSEMENT OR RECOMMENDATION BY VANTAGEPOINT AI OR ANY ASSOCIATED AFFILIATES OF ANY TRADING METHODS, PROGRAMS, SYSTEMS OR ROUTINES. VANTAGEPOINT’S PERSONNEL ARE NOT LICENSED BROKERS OR ADVISORS AND DO NOT OFFER TRADING ADVICE.


