| This week’s a.i. Stock Spotlight is ExxonMobil ($XOM) |
Exxon Mobil Corporation, commonly referred to as ExxonMobil, is a multinational oil and gas corporation headquartered in Irving, Texas. It stands as one of the world’s largest publicly traded oil and gas companies, derived from the 1999 merger of Exxon (formerly the Standard Oil Company of New Jersey) and Mobil (formerly the Standard Oil Company of New York), entities whose origins trace back to the vast empire built by John D. Rockefeller with the founding of Standard Oil in 1870.
ExxonMobil’s revenue streams are primarily generated through its various business segments: Upstream, Downstream, and Chemical. The Upstream division is involved in the exploration, extraction, and production of oil and natural gas. The Downstream division focuses on refining crude oil into petroleum products and transporting them. The Chemical segment produces and markets petrochemicals. These profit centers allow ExxonMobil to manage risks associated with price fluctuations in the oil market by diversifying its operations.
ExxonMobil employs approximately 63,000 people worldwide.
The company’s roots can be traced back to the founders of its predecessor companies, primarily John D. Rockefeller, who was instrumental in the creation of the Standard Oil Trust. Since its inception, ExxonMobil has grown into a juggernaut in the energy sector, becoming profitable early in its history due to the critical role oil plays in the global economy.
The company’s main competitors include other oil giants such as Chevron, BP, Shell, and TotalEnergies. These companies compete in various aspects of the oil and gas industry, including exploration, production, refining, and chemicals.
The biggest opportunities for ExxonMobil lie in its ability to innovate in energy efficiency, develop new sources of energy (including renewable energy sources), and expand its natural gas and petrochemical operations. Conversely, the risks include fluctuating oil prices, geopolitical tensions, regulatory changes, and the global push towards decarbonization and reducing reliance on fossil fuels.
ExxonMobil produces a wide range of products, from crude oil to natural gas, petrochemicals, and various refined products. Its biggest revenue generator has traditionally been its upstream operations, particularly oil production, though the downstream and chemical segments also contribute significantly to its overall revenue.
In 2024, ExxonMobil is poised to reach an unprecedented market cap of half a trillion dollars, signaling a significant milestone in the company’s history. This achievement is indicative of the energy sector’s robust performance, with ExxonMobil leading the charge, outpacing the S&P 500’s growth with a notable surge in the last month. The catalyst behind this impressive streak? A substantial increase in crude oil prices.
The heart of ExxonMobil’s recent success story lies in the rising prices of Brent crude oil, the global oil benchmark. With an 11% increase in the first quarter alone, these prices have significantly bolstered the company’s financial standing. This trend is not just a temporary boost but a strategic advantage that ExxonMobil is well-prepared to leverage, thanks to its solid position in the industry and a robust dividend stock performance that could set new records.
On the strategic front, ExxonMobil’s announcement of its merger with Pioneer Natural Resources on October 11 marked a pivotal moment. Despite achieving an all-time high in its stock value, a common occurrence among exploration and production companies, this merger represents a calculated move in Exxon’s cyclical business strategy. It’s a deployment of excess profits into new ventures, even as the company faced a temporary setback with a stock and oil price dip late in 2023.
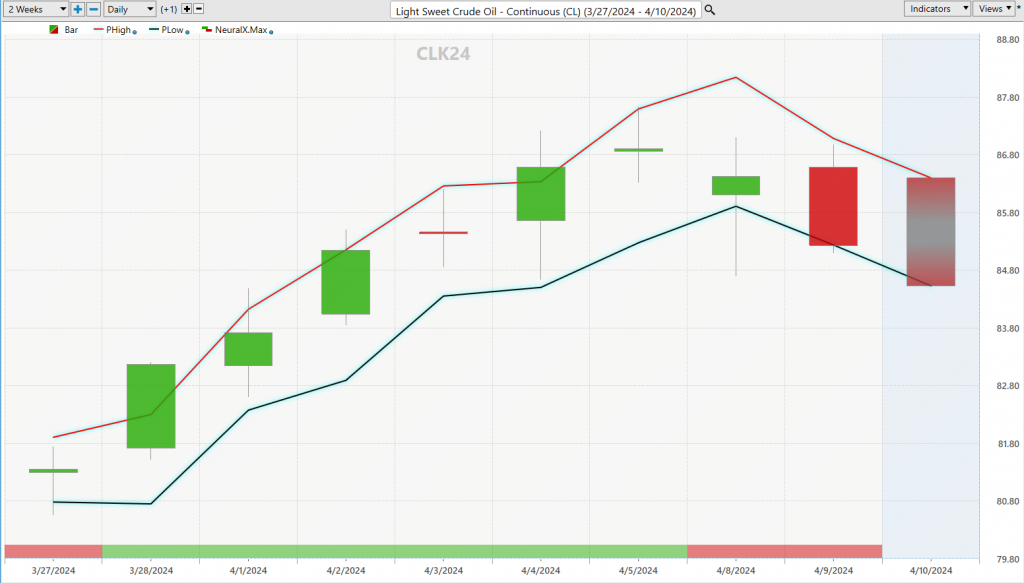
The recent upturn in oil prices, with Brent and West Texas Intermediate benchmarks hovering around $87 and $83 per barrel respectively, presents a golden scenario for ExxonMobil. Given that the company’s plans are based on a much more conservative $60 per barrel, the current prices offer an excess cash flow that could be strategically utilized for shareholder rewards, acquisitions, or dividends. This financial strategy could significantly enhance ExxonMobil’s market position and shareholder value.
ExxonMobil’s financial performance last year was nothing short of remarkable, with sales and earnings nearing a decade high and a substantial $33.5 billion in free cash flow. The return of $32.4 billion to shareholders through buybacks and dividends underscores the company’s commitment to shareholder value, even as it navigates the financial implications of its merger with Pioneer.
The key to ExxonMobil’s ongoing success is the sustained high price of oil. This not only accelerates the company’s growth but also enhances its ability to return more to its shareholders. While the Pioneer merger might temporarily slow down buybacks, the company’s long-term objectives and its ability to continue raising dividends remain intact.
ExxonMobil’s transformation over the past few years is a testament to its strategic financial management. By capitalizing on high oil prices, the company has shifted from a high net debt position to a strong balance sheet with minimal debt. This financial health allows Exxon to focus on dividends, buybacks, and long-term investments, maintaining its competitive edge in the industry.
Despite being slightly below its all-time high, ExxonMobil’s outlook for 2024 and beyond is promising. If it can replicate its 2023 performance, there’s no doubt it will surpass its previous records and outperform the market. The company’s robust financial strategy, coupled with a favorable oil price environment, positions it well for continued success. Moreover, Exxon’s ability to thrive in various market conditions offers investors a compelling reason to maintain confidence in its long-term value.
In this stock study we will look at the following metrics and indicators.
1) Wall Street Analysts’ Estimates
2) 52-week high and low boundaries
3) Vantagepoint A.I. Predictive Blue Line Analysis
4) The Best Case – Worst Case Scenarios
5) Neural Network Forecast
6) Daily Range Forecast
7) Intermarket Analysis
8) Our trading suggestion
We don’t base decisions on things like earnings or fundamental cash flow valuations. However, we do look at them to better understand the financial landscape that a company is operating under.
Wall Street Analysts’ Estimates
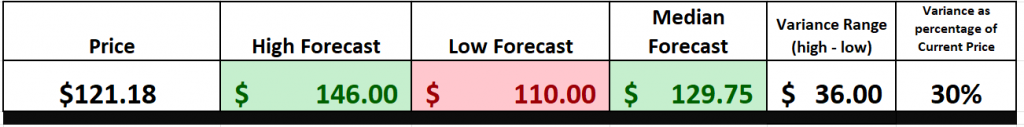
According to the issued ratings of 16 analysts in the last year, the average twelve-month price prediction for ExxonMobil is $129.75 with a high price target of $146 and a low-price target of $110. The most recent closing stock price is $121.18.
We pay close attention to the variance between the most bullish and most bearish estimates as it is often a precursor of expected volatility. Currently this variance is 30% of the current price. This means that statistically speaking it would be perfectly normal to expect $XOM to trade 30% higher and or lower over the coming 12 months.
52-Week High and Low Boundaries
We always advise that traders pay attention to stocks’ 52-week boundaries. These levels act as a report card on a stock, particularly when focused over the past year and compared to the broader market.
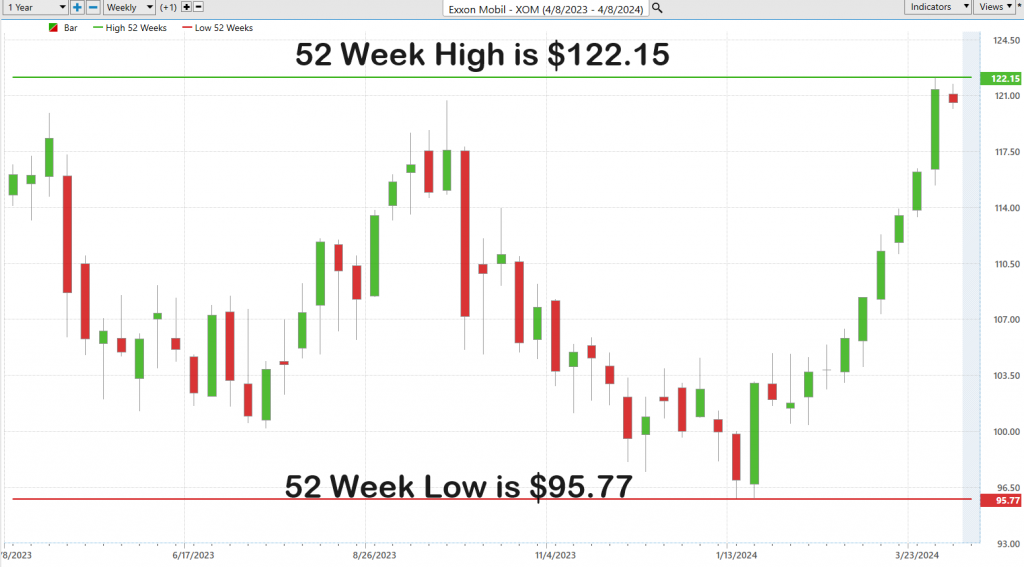
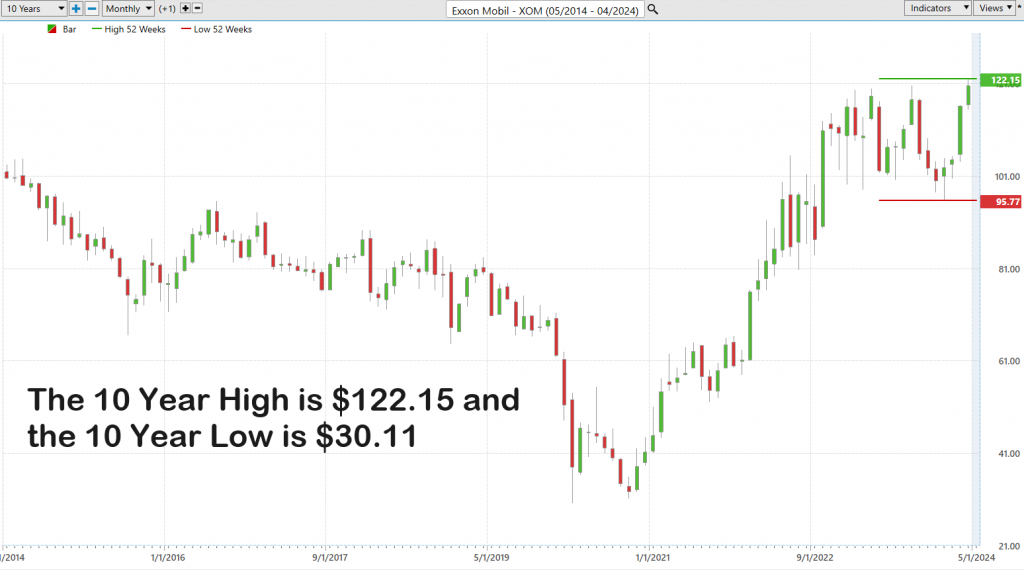
Over the past 52 weeks $XOM has traded as high as $122.15 and as low as $95.77.

The annual trading range was 26.38 or 22% of the current price. The Stock is trading at its 96th percentile of the last 52 weeks.
The 52-week high and low boundaries serve as critical psychological benchmarks in the financial markets, representing the highest and lowest prices at which an asset has traded over the past year. These levels are closely watched by investors and traders as indicators of an asset’s momentum and market sentiment. When a stock approaches or breaches its 52-week high, it often signals strength and positive momentum, suggesting that the asset is in demand and could potentially move higher. Conversely, falling to a new 52-week low may indicate underlying weakness, possibly triggering selloffs as investors reassess the asset’s value. These markers have been used for decades on Wall Street to gauge market sentiment and asset performance, reflecting long-standing principles of technical analysis.
A wide array of market participants, including individual investors, institutional investors, and traders, utilize the 52-week benchmarks to inform their trading strategies. These levels are employed to determine the relative strength or weakness of an asset and to identify potential entry and exit points. The concept of tracking 52-week highs and lows as a trading strategy can be traced back to well-established technical analysis principles, which have been a part of financial market analysis for over a century. The reliance on these markers underscores the human tendency to anchor expectations and decisions to historical price levels, a practice deeply ingrained in trading psychology.
For a new trader, monitoring stocks that are hitting new 52-week highs or lows can be incredibly educational. It helps in understanding market trends, investor sentiment, and the factors that drive significant price movements. Observing stocks at these extremes can reveal how news, earnings reports, and broader market trends impact investor behavior and asset valuation. It also teaches the importance of resistance and support levels in technical analysis. Essentially, keeping an eye on these benchmarks helps novices grasp the basics of market psychology and momentum trading, laying a foundation for developing more sophisticated trading strategies. This approach to market analysis has been shaped by generations of traders and analysts, drawing on the collective wisdom and experiences of the financial community.
One of our favorite all-time trading setups is to locate stocks that are simultaneously making new 52-week and new 10-year highs simultaneously. When this occurs you are encountering an asset that is overcoming all obstacles to its success. $XOM falls in this category today.
We can also get a very objective view of the long-term trend by zooming out to the 10-year chart. Doing so provides a quick visual of how the last 52 weeks have compared to the last decade.
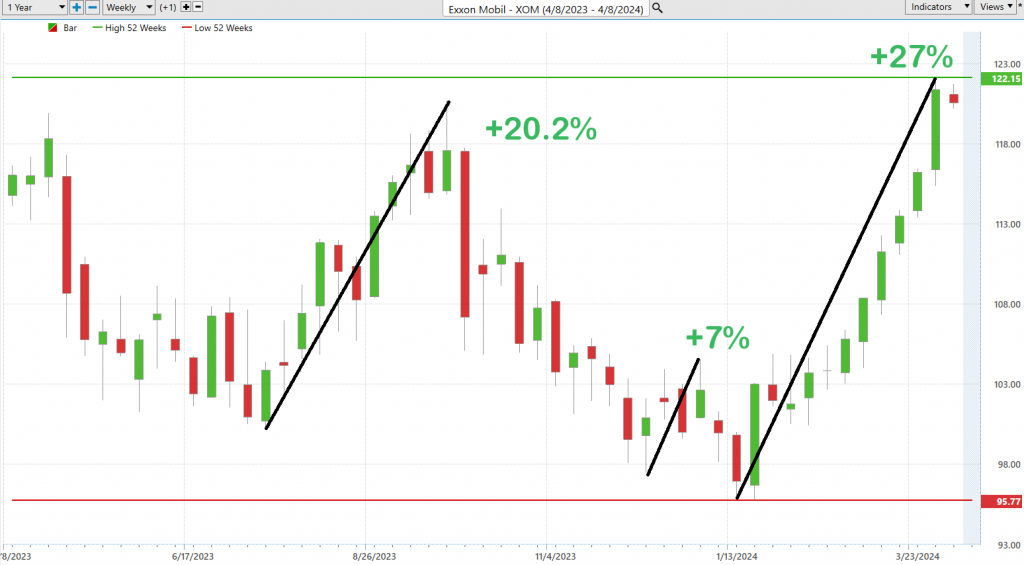
Best Case – Worst Case Scenario
What all investors and traders need to do to succeed is to develop and objective understanding of risk and reward. While there are many quantitative tools and metrics designed to assist in this regard, the most practical thing a trader can do is to simply look at the past year and compare the magnitude of the rallies with the size of the declines. This simple exercise forces traders to understand what normal price action and volatility is. It is invaluable for developing a realistic perspective related to risk.
It’s paramount to navigate with both eyes wide open, especially when you’re considering a stake in something as pivotal as Exxon Mobil (XOM). Here’s a nugget of wisdom for those analyzing a new trade – engage in what I like to call the “Sunshine and Storm” analysis. Picture this as your financial weather forecast, enabling you to envision your investment basking in sunlight or weathering a storm.
Why, you ask? Well, it’s all about steering clear of flying into a fog of uncertainty. It’s crucial to arm yourself with the knowledge of the best possible outcome (think soaring profits) and the worst (ponder potential losses). This clarity empowers you to weigh if the gamble matches your appetite for risk and aligns with your financial comfort zone.
Here’s how you tackle it: sift through the historical performance of your intended investment, pinpointing its zeniths and nadirs. This exploration into Exxon Mobil’s price fluctuations furnishes you with a concrete grasp of its volatility. You then chart a course from the recent peaks to the valleys, a straightforward yet enlightening exercise that unveils the tangible stakes of potential gains and losses.
– **In the Best-Case Scenario**: You’re essentially mapping out the high points to their recent counterparts on the lower end. This reveals a glimpse into the heights your investment could scale anew. It’s about setting optimistic, yet grounded expectations based on historical reality.
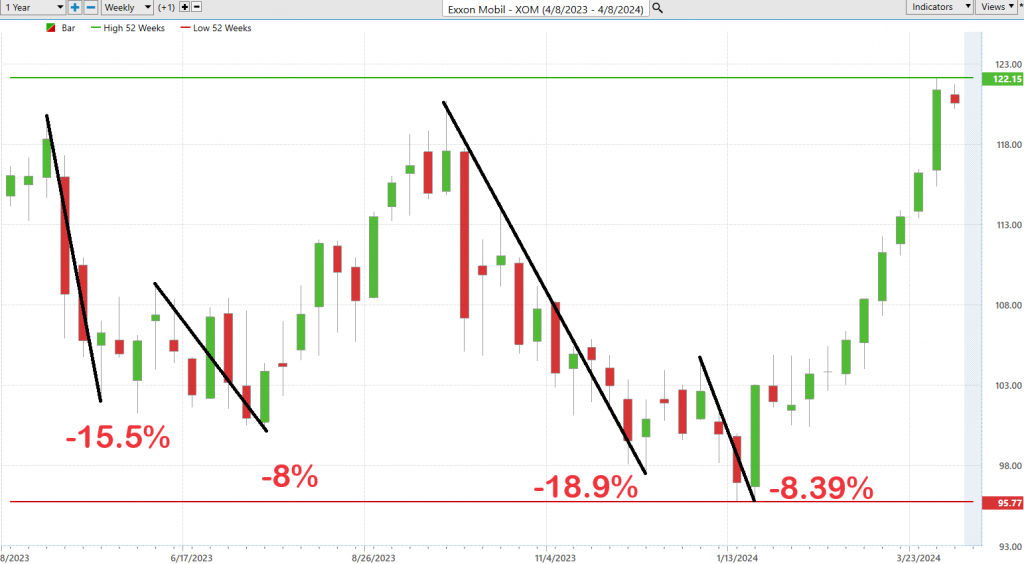
– **In the Worst-Case Scenario**: Flip the script and trace the valleys to their recent peaks. This exercise acquaints you with the potential downturns, prepping you for a possible financial downpour. It’s akin to setting up a financial umbrella – think stop-loss orders, which instruct your broker to offload your stake at a predefined trough, safeguarding you from a devastating loss.
This method isn’t merely about drawing lines from A to B; it’s an immersive dive into the investment journey you’re about to embark on. It grants you a panoramic view of the potential highs and lows, rooted in actual data rather than speculative forecasts. Armed with this knowledge, you step into the market with a tailored strategy that resonates with your goals and risk tolerance, ensuring you’re never blindsided, regardless of the market’s mood swings.
So, before you commit your hard-earned cash to the markets, take a beat to conduct this analysis. It’s akin to scouting the path ahead with a beacon, ensuring you’re primed for whatever lurks in the financial shadows. This approach transcends mere savvy investing; it’s about crafting a strategy that’s uniquely yours.
By adopting this lens, we can instantly decode the risk and reward landscape of the past year for Exxon Mobil (XOM), paving the way for an informed and personalized trading decision. Observe the depths of the declines at 18.9% versus the magnitude of the rallies at 27%. Awareness of these details can prove very important as you navigate the volatility of $XOM moving forward.
Moving forward, a comparative analysis of $XOM against broader market indices is crucial. This comparison not only highlights where $XOM has outperformed or underperformed in relation to the broader market.
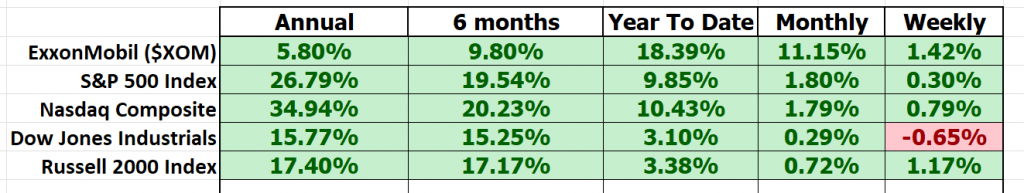
We can see that $XOM is lagging on the annual and 6-month performance compared to the broader market, but on all other time frames it has outperformed.
A critical component of this analysis involves assessing $XOM’s volatility relative to the broader market, through the lens of the beta coefficient. Beta is a measure of a stock’s volatility in relation to the overall market; a beta of 1 suggests that the stock moves in concert with the market, a beta above 1 indicates higher volatility, and a beta below 1 denotes lower volatility. $XOM has demonstrated a beta of .96 over the past five years, indicating a volatility level that is 4% lower than the broader market average. This suggests that $XOM is slightly less volatile than the broader market.
This simple and practical analysis demonstrates the leadership performance that $XOM has demonstrated over the past year. This analytical framework is instrumental in navigating the investment landscape with confidence and precision.
VantagePoint A.I. Predictive Blue Line Analysis
Our guiding principles are as follows:
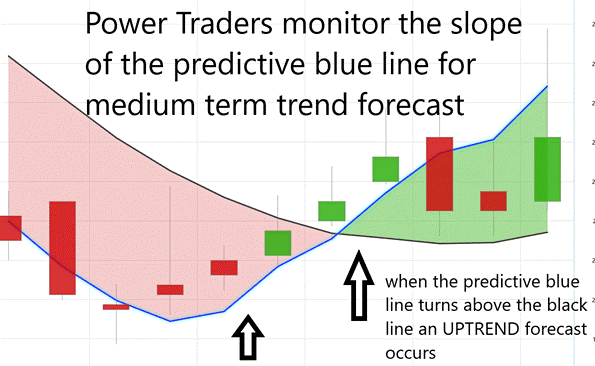
– The trajectory/slope of the predictive blue line dictates the trend forecast and overall trajectory of $XOM.
– Ideally, the VALUE ZONE is determined to seek buying opportunities at or below the predictive blue line or selling opportunities above it during a downtrend.
– Naturally, as the predictive blue line slopes downward, traders anticipate lower prices, either retreating to the sidelines or hedging their positions.
In the world of forecasting financial market trends, a revolution is taking place, heralded by the advanced technology of VantagePoint Software. Its artificial intelligence capabilities are transforming the way traders approach the market, especially with assets like $XOM, through its trend-forecasting prowess. The predictive blue line, a cornerstone of this sophisticated system, acts as a lighthouse in the foggy seas of stock trading, guiding investors towards potentially lucrative shores.
As we venture deeper into this complex terrain, it becomes clear that the blue line is more than just a line; it’s a window into the future. Observing its movements is akin to having a conversation with the market itself, with dips and ascents offering silent advice on the impending market dynamics. For the astute investor, these signals are invaluable, serving as a prompt to recalibrate strategies or explore protective measures against volatility.
The introduction of VantagePoint Software into this landscape is nothing short of groundbreaking. Equipped with cutting-edge AI, it offers more than just data analysis; it provides foresight, illuminating the path ahead with the slope of the predictive blue line. In an era where market conditions shift with the wind, such clarity is priceless.
VantagePoint’s role extends beyond mere prediction; it’s a compass in the often-tumultuous financial environment, with its AI-driven insights acting as a sneak peek into the market’s future intentions. The upward or downward movements of that iconic blue line serve as clear signals, guiding investors towards bullish opportunities or cautioning them against potential downturns.
Yet, this is not a mere conjecture. The predictive blue line is the culmination of VantagePoint’s AI mastery, blending neural networks and an extensive analysis of intermarket relationships to decode the market’s essence. This, coupled with the black line that charts recent market performance, creates a dynamic duo that unveils the momentum of the market, uncovering hidden gems in the vast ocean of trading opportunities.
In this ever-evolving financial narrative, the combination of VantagePoint’s artificial intelligence and the predictive prowess of the blue and black lines offers a beacon of hope and direction, enabling traders and investors to navigate the market’s complexities with confidence and insight.
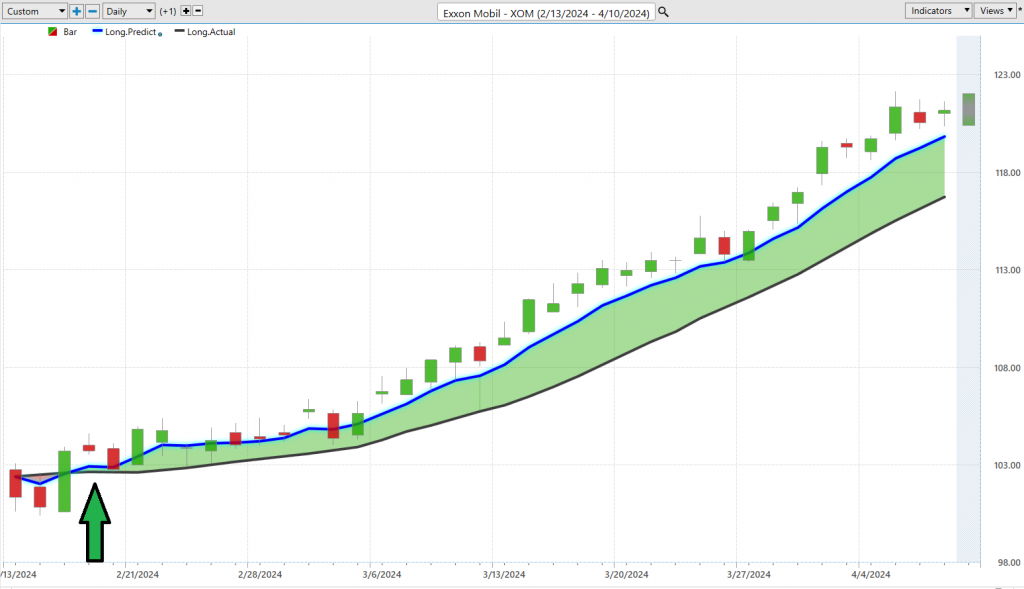
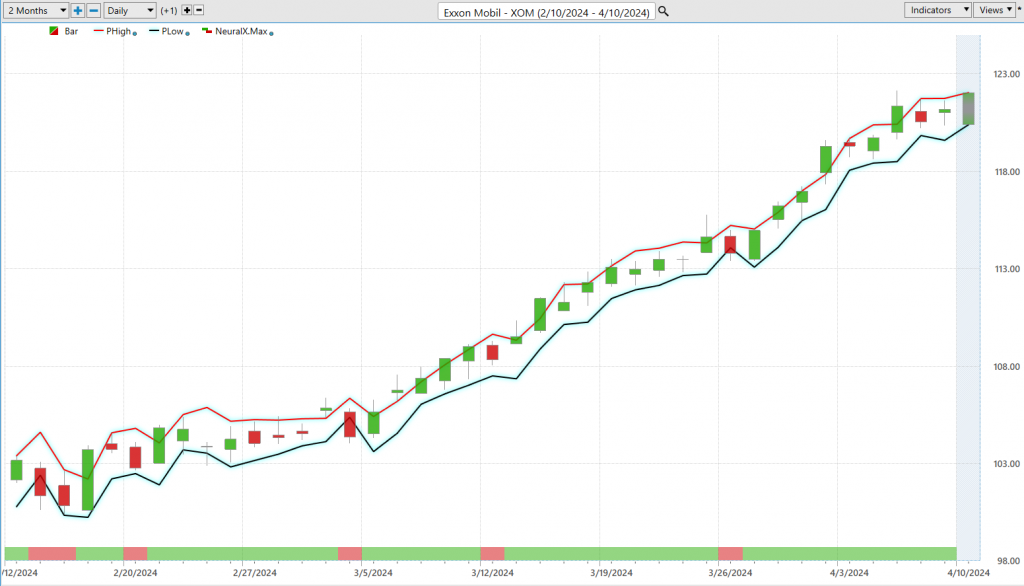
You can see the UP forecast was generated on February 16 at $103.73, and $XOM has rallied 16% since that time.
Neural Network Indicator (Machine Learning)
Neural networks for trading are advanced computational models designed to simulate the way the human brain processes information. They are constructed from layers of interconnected nodes or “neurons,” each capable of performing simple computations. Neural networks improve decision-making for traders by offering a powerful tool for pattern recognition, capable of identifying complex nonlinear relationships within the data that might be invisible to human traders or traditional statistical methods. They adapt and learn from new data, making them particularly suited to the dynamic nature of financial markets. This ability to learn and improve over time allows traders to make more informed decisions, anticipate market movements, and manage risks more effectively, leading to potentially higher returns on their investments.
The Neural Network Indicator, shines on our charts, much like a beacon, casting a green glow to signal market strength and adopting a red warning light to indicate potential declines.
This technological marvel brings the prowess of human cognitive abilities to our fingertips, offering a lens through which we can view the market in unprecedented detail. It excels in parsing through vast datasets, unveiling patterns and correlations that elude even the most vigilant traders. Imagine wielding a tool so adept at recognizing market patterns, it virtually predicts future movements, demystifying the markets’ often unpredictable nature.
But the essence of neural networks lies in their capacity for learning, constantly absorbing information, refining their algorithms with each new data point, making them particularly adept at navigating the fluid landscape of the stock market.
Now, let’s translate this into the tangible world of trading decisions. Neural networks emerge as the quintessential ally in mitigating risks, slicing through market data with a precision that transcends human capabilities. Their unparalleled pattern recognition empowers traders to identify market trends and anomalies with an accuracy previously deemed unattainable. These networks are not mere participants; they are pioneers, revealing emerging trends and signals in an instant, affording traders a decisive edge in the time-sensitive arena of trading.
Within the roadmap of $XOM’s market movements, the arrows signify the moments of harmony between the predictive blue line and the neural index, both heralding a unified direction. This confluence of technology and financial acumen mirrors the intricacy of the human intellect, perpetually adapting, learning, offering a deep dive into the market’s essence.
Armed with the VantagePoint A.I. Neural Index Indicator, our Power Traders embark on a data-driven odyssey, aligning the predictive blue line with the neural network’s foresight. It’s a ballet of data and anticipation, where the synergy between the Predictive Blue Line and the Neural Network not only highlights opportunities but delineates a path laden with high-probability trading victories.
The Neural Network Indicator, in concert with the Predictive Blue Line, sketches a navigational chart for our Power Traders, illuminating those crucial moments of ‘double confirmation,’ where precision and opportunity meet amidst the ever-dynamic tapestry of market forces.
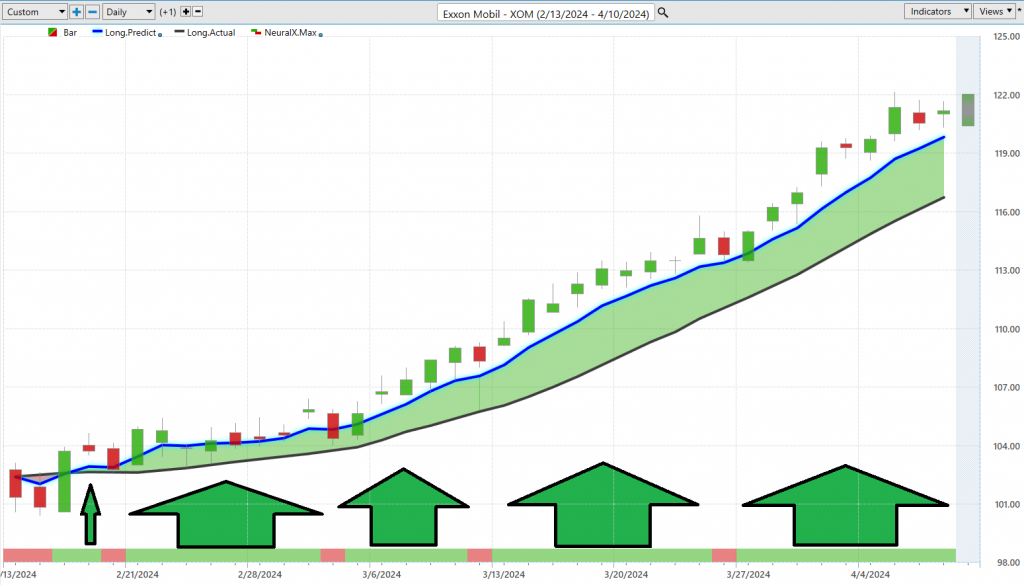
The arrows on the chart above are the moments when the predictive blue line and the neural index were both forecasting the same direction for $XOM.
VantagePoint A.I. Daily Range Forecast
One of the biggest challenges for traders is deciding WHERE to get IN and OUT of the market.
Volatility can be very deceptive and disconcerting unless you have a method of consistently balancing the risk versus the reward on any given trade.
Here are the trading range metrics for $XOM over the past year on a daily, weekly, and monthly basis:
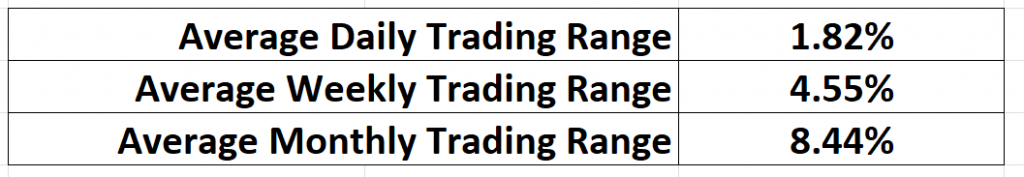
But even armed with those metrics the question remains how do you utilize them?
This is where we dive into the heart of the matter: Grasping these market ranges is merely scratching the surface. The true mastery, the art that distinguishes the seasoned from the novice, is in identifying those pivotal instants to make your move—both entering and exiting, capitalizing on the windows of opportunity that these ranges unveil.
Picture yourself on the precipice of an expansive sea of data, armed with AI, machine learning, and neural networks as your compass, navigating through the volatility. It’s in these critical junctures, equipped with cutting-edge technology, that traders can convert insights into tangible action, transforming the intricate web of market dynamics into avenues for substantial growth.
Here is the VantagePoint A.I. Daily Range Forecast which clearly delineates the trend and the expected trading range for each day. Observe how clear and accurate this analysis is and how it leaves absolutely zero room for any guesswork or additional opinion.
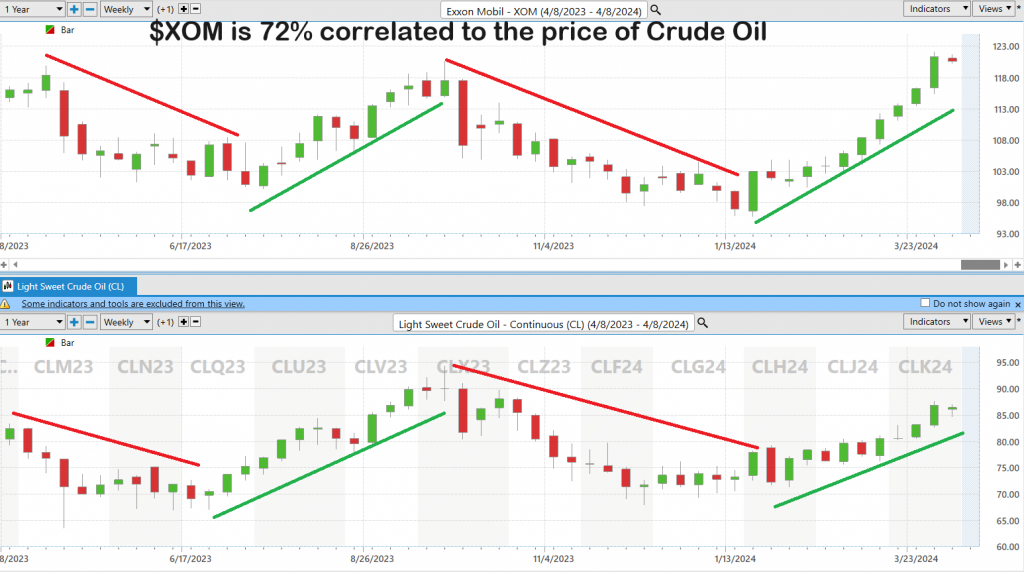
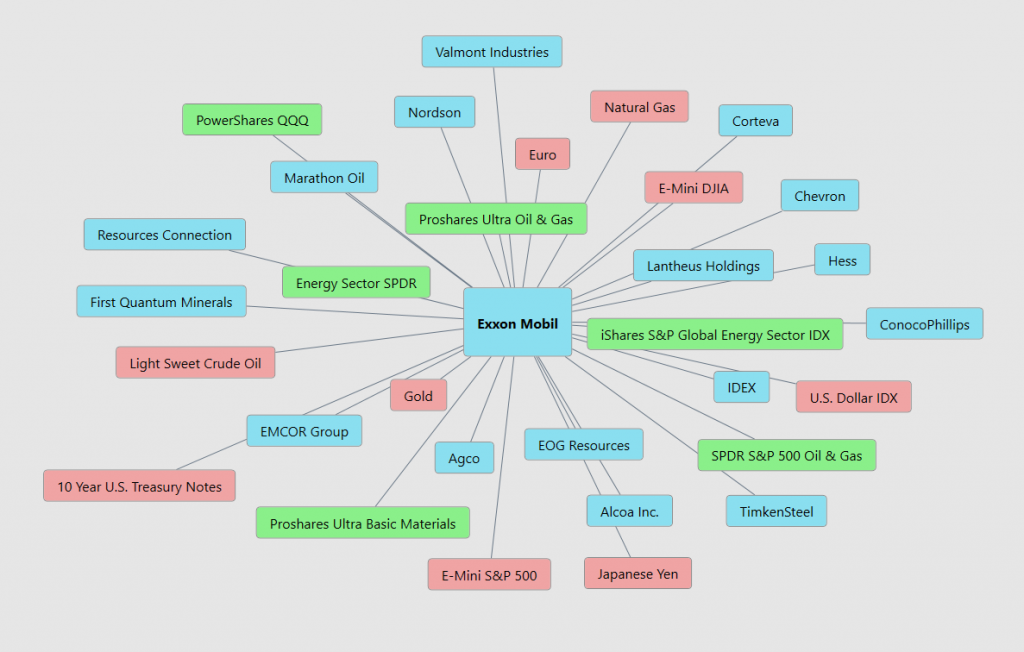
VantagePoint A.I. Intermarket Analysis
Envision stocks, bonds, commodities, and currencies each pulsating to their own beat, yet all entwined in a sophisticated ballet of economics. For those embarking on their trading journey, grasping this web of interconnectedness is pivotal to unlocking profound market insights and forging decisions that are both informed and strategic.
So, what exactly does intermarket analysis entail? It’s the art of observing the symbiotic dance among these diverse markets, understanding how each influences and is influenced by the others. Picture, if you will, the domino effect initiated by a surge in oil prices, a commodity’s caprice stirring the calm waters of inflation expectations, which in turn nudges interest rates and bond yields. This ripple can extend its reach to the stock market, especially touching sectors that resonate with the fluctuations of oil prices or the whispers of interest rates. Likewise, the strength of a currency holds the power to sway commodity prices, and thus, the fate of related stocks and sectors. By deciphering these intricate relationships, traders gain the foresight to spot underlying trends and shifts before they emerge into the limelight of conventional analysis.
And how does this elevate a trader’s decision-making? Intermarket analysis equips traders with a panoramic view of the financial universe. By piecing together how different markets weave into each other’s narratives, traders can predict shifts in one domain based on movements in another. This holistic insight fosters robust risk management and unveils trading opportunities that might otherwise remain cloaked in the shadows of a singular market focus.
The maestro behind intermarket analysis? While its roots stretch deep into the annals of financial strategy, it was John J. Murphy, a sage of technical analysis and a voice of CNBC, who cast this concept into the spotlight in the latter 20th century. With seminal works like “Intermarket Analysis: Profiting from Global Market Relationships,” Murphy laid the cornerstone for integrating technical analysis across the spectra of equities, bonds, commodities, and currencies. This foundation was further solidified by Lou Mendelsohn, the visionary behind VantagePoint A.I., who honed the craft of intermarket analysis within the powerful suite of VantagePoint Software.
In the tapestry of today’s global economy, where the flutter of a butterfly’s wings in one market can summon a tempest in another, the role of intermarket analysis has never been more crucial. It empowers traders to chart the intricate web of market relationships, steering through the financial seas with an adept hand. It transcends mere awareness of singular market movements, urging a deeper comprehension of how these movements echo across the broader financial ecosystem. This comprehensive approach paves the way for strategic trading decisions, enhanced risk management, and the potential to harness greater returns.
For newcomers to the trading arena, embracing intermarket analysis is akin to broadening one’s horizon, stepping out from the silo of single-market analysis to embrace a panoramic view of global financial dynamics. It’s about beholding the grand mosaic of the market landscape and positioning oneself to proactively navigate the ever-evolving shifts, not just within a solitary market, but across the vast expanse of the financial universe.
Our Suggestion
The next earnings call for Exxon Mobil Corporation ($XOM) is scheduled for April 26, 2024. For their last reported quarter, Exxon Mobil had earnings of $2.48 per share, which exceeded the consensus estimate of $2.20 by $0.28, with revenue of $84.34 billion compared to the consensus estimate of $90.03 billion. The. reason this is important is that $XOM has just come off of a blockbuster year with lower oil prices. Since crude oil have rallied to the $87 area, analysts believe that higher crude oil prices will increase profitability exponentially for $XOM.
For Exxon Mobil Corporation (XOM), the earnings estimates for the next quarter (March 2024) are as follows: analysts are projecting an average earnings per share (EPS) at $2.38. Earnings above this value will propel $XOM higher.
Since the company is simultaneously making 10 year and 52-week highs it deserves to be on your radar. If you believe that inflation will return, $XOM is definitely worthy of your attention as Oil companies do exceptionally well when Crude Oil prices rally.
In a notable announcement made in early December, ExxonMobil shared a bold blueprint promising to augment its annual earnings and cash flow potential by approximately $14 billion over the forthcoming four-year span.
Concurrently, its acquisition of Pioneer Natural Resources is heralding a significant boost to both short-term and long-term returns.
Reflecting on the past decade, the average price of Brent crude has consistently hovered well above the $60 mark, notwithstanding episodic plunges below $40 during economic downturns.
The outlook brightens further with ExxonMobil’s anticipation that a whopping 90% of its slated upstream capital investments in novel oil and natural gas production over the ensuing years are projected to yield returns exceeding 10%, even if Brent crude’s price were to dwindle to just $35 a barrel. This encapsulates ExxonMobil’s strategic evolution towards heightened efficiency and fortification against the unpredictability’s of a fluctuating oil price landscape.
Practice good money management on all of your trades and utilize the VantagePoint A.I. daily range forecast for future guidance.
Let’s Be Careful Out There!
Remember, It’s Not Magic.
It’s Machine Learning.
Disclaimer: THERE IS A HIGH DEGREE OF RISK INVOLVED IN TRADING. IT IS NOT PRUDENT OR ADVISABLE TO MAKE TRADING DECISIONS THAT ARE BEYOND YOUR FINANCIAL MEANS OR INVOLVE TRADING CAPITAL THAT YOU ARE NOT WILLING AND CAPABLE OF LOSING.
VANTAGEPOINT’S MARKETING CAMPAIGNS, OF ANY KIND, DO NOT CONSTITUTE TRADING ADVICE OR AN ENDORSEMENT OR RECOMMENDATION BY VANTAGEPOINT AI OR ANY ASSOCIATED AFFILIATES OF ANY TRADING METHODS, PROGRAMS, SYSTEMS OR ROUTINES. VANTAGEPOINT’S PERSONNEL ARE NOT LICENSED BROKERS OR ADVISORS AND DO NOT OFFER TRADING ADVICE.