


The Return of the Risk-Free Trade
Alright, folks, listen up — because this is one of the biggest shifts happening in the market right now, and most investors are still snoozing on it!
T-Bills are BACK. I’m talking about short-term U.S. Treasuries, those boring little government IOUs, suddenly looking very attractive again. Why? Because the Fed has been on a rate-hiking warpath fighting inflation, and now these short-term bills are yielding 4.4% or more — with zero credit risk. That’s right. So, what’s the takeaway? The return of the risk-free trade is reshaping how traders think. Capital is shifting. It’s no longer “There Is No Alternative” to stocks — there is, and it’s printed by the U.S. Treasury. Don’t ignore it. You want to know where the smart money’s hiding right now? This is it.
You need to understand the U.S. Treasury market, otherwise… you’re flying blind.
This isn’t an optional side dish for bond nerds. Treasuries are the bedrock of the financial system — the benchmark that everything else gets priced against. Stocks, mortgages, corporate bonds, junk debt, credit cards all dance to the rhythm of Treasury yields. If you’re out there trading without knowing how this market moves, you’re basically showing up to a gunfight with a squirt gun.
You see, every form of debt in the world competes with every other form of debt — not just for yield, but for safety. Investors don’t just want returns. They want returns with confidence that they’ll get their money back. That’s why U.S. Treasuries are so important. They’ve long been the global gold standard for “risk-free” returns. But this isn’t a one-country game. U.S. Treasuries compete directly with bonds from Germany, Japan, the U.K., China, Brazil — every nation on Earth. If another country offers better yields for the same or better risk profile, money moves. Fast.
So, what are Treasuries, exactly?
They’re IOUs from the U.S. government. When you buy one, you’re lending money to Uncle Sam in exchange for interest and the promise you’ll get it back later. These come in three main forms: T-Bills (short-term), T-Notes (medium-term), and T-Bonds (long-term). They’re considered safe. But they’re not simple, especially when you realize this: when yields rise, bond prices fall. That inverse relationship confuses most beginners. But it’s the lever that tilts the entire market. A 5% yield on a T-Bill doesn’t just offer a return — it sets a new bar for every other asset trying to compete for your money.
And that’s why Treasuries are more than just government debt. They are the backbone of global finance. They define the cost of money. They shape how capital flows, how risk is priced, and how portfolios are built. They are the starting point of every serious financial decision made by banks, corporations, governments, and yes — traders like you.
Bottom line? If you want to survive in this market, you can’t ignore the Treasury market. You’ve got to understand it, track it, and respect the massive gravitational pull it has over everything else. Because until you do, the rest of the financial world is just noise.
Why Tech Stocks Are Feeling the Heat
Rising interest rates have a way of shaking the foundations of even the most promising growth narratives. And, right now, few sectors are more exposed than technology.
At the heart of the issue is a financial principle that’s as old as Wall Street itself: discounted cash flow. Tech stocks, especially those in the high-growth camp, derive much of their valuation from expected earnings years into the future. But when interest rates rise rapidly in response to the Federal Reserve’s inflation-fighting campaign, those future earnings become less valuable in today’s dollars. In simple terms, the cost of waiting goes up. And that’s a problem for stocks banking on tomorrow.
We’ve seen this play out across the Nasdaq. Companies like Nvidia, Tesla, and Snowflake — names that rode the A.I. wave to stratospheric valuations — have all experienced moments of price compression. It’s not that investors doubt the long-term potential. It’s that, in the current environment, a 4.5% return on a 12-month Treasury bill with no risk suddenly becomes a very real alternative. When the “risk-free” trade is offering a yield competitive with the long-term annualized returns of the S&P 500, capital begins to reprice risk assets accordingly.
When the world stops making sense — when headlines are filled with war, erratic policy decisions, and geopolitical flashpoints — markets retreat to clarity. Capital moves swiftly away from riskier assets like growth stocks and into safer havens such as U.S. Treasuries, gold, and cash. Traders and investors, faced with uncertainty they can’t quantify, default to capital preservation over speculation. In these moments, it’s not about chasing returns, it’s about surviving volatility until the fog clears.
This puts the recent A.I.-driven tech rally in a unique bind. On one hand, the narrative is powerful — machine learning, automation, and data analytics are changing the world. On the other, investors are facing a stark choice: chase speculative upside or accept guaranteed return. For many institutional players managing billions, that decision becomes a matter of fiduciary responsibility, not FOMO.
What makes today’s yields so appealing isn’t just the return, it’s the refuge. In a world loaded with geopolitical landmines and chaos around every corner, this is where money hides when it can’t figure out what the smart thing to do is.
In short, the gravitational pull of rising yields is exerting pressure on tech valuations across the board. And as long as Treasury yields remain elevated, the premium investors are willing to pay for long-duration growth stories — no matter how compelling — will remain hazardous and under scrutiny.
Before we go any further, let’s put the sheer scale of the U.S. Treasury market into perspective.
As of 2025, the U.S. Treasury market stands at over $27 trillion in outstanding debt and growing. That’s not just a big number. That’s the largest, most important debt market in the world. Now compare that to the U.S. stock market, which clocks in at a total market capitalization of around $52 trillion. You might think that means stocks dominate the financial system — but you’d be wrong.
Stocks are priced based on perception, earnings, and growth potential. But Treasuries? They’re priced based on reality. They define what a dollar of future money is worth today — and that valuation underpins every other asset in the system.
If there’s one thing you need to wrap your head around, it’s this:
The Treasury market doesn’t just reflect financial conditions, it creates them.
Here is a chart of the yield of the Ten-Year US Treasury going back to 1962.
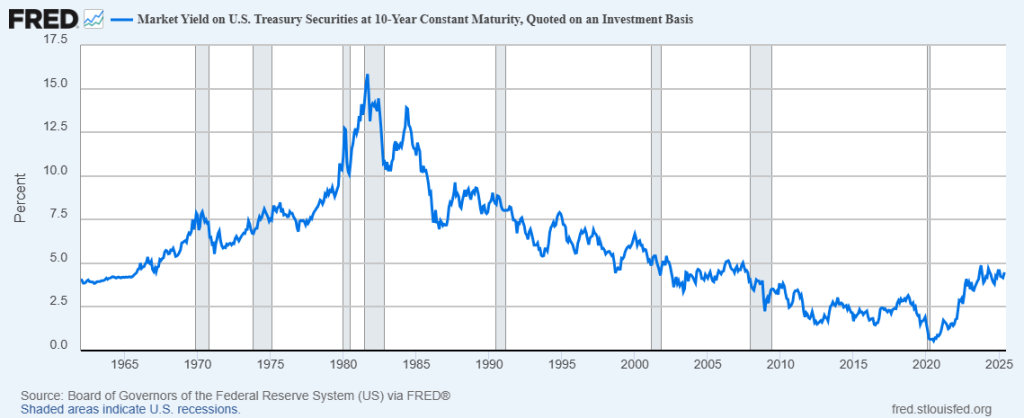
Treasury yields set the tone for every other interest rate in the economy. Whether it’s your mortgage, your credit card, a corporate bond, or an emerging market loan — they all start with the U.S. Treasury as the benchmark. When Treasury yields rise, the cost of borrowing rises everywhere. That’s how the Fed “tightens” the economy without touching a single consumer directly.
U.S. Treasuries are considered “risk-free” because the government (so far) has never defaulted. That makes them the baseline. Everything else, whether it’s a stock, bond, or real estate deal — is judged relative to the return on Treasuries. If a risky asset doesn’t offer a decent premium above Treasuries, it’s ignored. That’s how capital flows.
This isn’t a market that sleeps. The Treasury market trades trillions of dollars per day — more than any stock or futures market. It’s deep, it’s liquid, and it allows institutions, governments, and traders to move in and out fast, with precision. That liquidity makes it the real-time dashboard for global capital.
When the world gets scary — wars, pandemics, crashes — there’s one door everyone runs through: Treasuries.
The result? Prices soar, yields fall, and the market sends a crystal-clear signal that fear is taking over. That behavior isn’t a fluke, it’s a pattern that’s been repeated for decades.
Think about it: You’re considering investing $10,000 in either:
- A tech stock expected to return 6% over the next year
- A 1-year Treasury Bill yielding 4.2%
Risk-free rate = 4.2%
This means the tech stock only offers a 1.8% premium over the risk-free alternative. If that 1.8% isn’t worth the extra risk, a conservative investor will often choose the Treasury.
And that’s why the yield curve doesn’t just tell you about interest rates, it reshapes asset prices everywhere. When yields rise, the present value of future cash flows drops — which means stocks get repriced, especially the ones banking on big earnings years down the line (like tech stocks).
Beyond its role as a snapshot of interest rates, the yield curve offers a deeper window into the market’s psychology and expectations. One of its most important functions is revealing the cost of borrowing. When short-term rates rise sharply, it signals tighter financial conditions. This makes it more expensive for both businesses and consumers to borrow money, often leading to a slowdown in economic activity as credit-driven growth stalls.
The curve also captures the market’s expectations for inflation. If long-term yields begin to climb, it’s often a sign that investors are bracing for higher inflation in the future. Conversely, when those same yields fall, it suggests expectations of an economic slowdown — or even deflation — are taking hold. These shifts matter because they influence everything from bond pricing to central bank strategy.
Perhaps most significantly, the shape of the yield curve acts as a barometer for Federal Reserve policy. An inverted curve — when short-term rates are higher than long-term ones — is widely interpreted as the market’s bet that the Fed will be forced to cut rates in the future. It’s not merely an academic signal; it’s a reflection of how investors are pricing in the likelihood of policy missteps, economic weakness, or both.
Finally, the yield curve is a live readout of the market’s appetite for risk. A steep, upward-sloping curve typically indicates optimism and a willingness to bet on growth. A flat or inverted curve, on the other hand, reveals caution — an environment where investors are retreating into safety and defensiveness.
In the end, the yield curve isn’t just a forecast, it’s a verdict. It tells us where capital is flowing, what it’s wary of, and how risk is being repriced in real time. To ignore it is to ignore the clearest and most consistent voice on Wall Street.
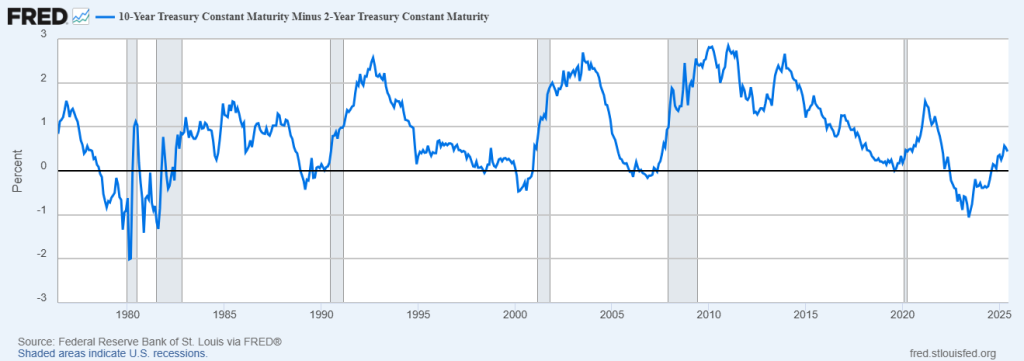
This chart from the Federal Reserve Bank of St. Louis shows the spread between the 10-Year Treasury yield and the 2-Year Treasury yield — commonly referred to as the yield curve. When the line drops below zero, the yield curve inverts, meaning short-term interest rates are higher than long-term rates. That’s unusual — and it sends a powerful message.
In a healthy economy, investors expect higher returns for locking up their money longer. So, the 10-year yield is normally above the 2-year yield. But when the economy looks shaky, investors rush to long-term bonds for safety, pushing long-term yields down. At the same time, the Fed might be raising short-term rates to fight inflation, pushing short-term yields up. The result? An inverted yield curve.
Why does it matter?
Every time the yield curve has meaningfully inverted in the past 40+ years, 1980, 1990, 2000, 2007, and again in 2019–2022, a recession has followed. The shaded gray bars on the graph show U.S. recessions, and you’ll notice a pattern: inversion comes first, recession comes later.
This curve isn’t just a quirky economic stat — it’s a warning light. When short-term borrowing costs are higher than long-term expectations, businesses and consumers pull back. Credit tightens, spending slows, and economic activity begins to cool. The yield curve, in effect, reflects fear about the future.
As of the latest data, the curve has begun to recover from a deep inversion, suggesting the market may be bracing for Fed rate cuts — but the historical pattern still lingers. If history repeats, economic softness could follow. The yield curve isn’t magic. But it’s been one of the most consistent recession indicators Wall Street has.
Ignore it at your own risk.
For over a decade, markets operated under the gravitational pull of a single narrative: TINA — There Is No Alternative. With interest rates pinned near zero and central banks flooding the system with liquidity, investors were all but pushed into equities. Risk assets, particularly high-growth stocks, became the default choice. There was simply nowhere else to go.
But that dynamic has fundamentally changed. With short-term Treasury yields now comfortably above 4.48%, investors suddenly have a legitimate, low-risk alternative that pays real returns. The result is a noticeable shift in behavior across the market. Appetite for volatility-heavy trades has waned. Money is rotating slowly but deliberately, out of high-beta momentum plays and into safer, yield-generating instruments. The chase for speculative upside no longer looks like a requirement, it now feels like a luxury.
This shift is having clear ripple effects in the growth-versus-value conversation. Growth stocks, particularly those with long-duration earnings expectations, are facing valuation pressure as their future cash flows are discounted more aggressively. Value stocks, while not universally surging, are finding new relevance in portfolios seeking stability and income. Meanwhile, momentum strategies — long the beneficiaries of TINA-fueled flows — are becoming more erratic, as the liquidity that once powered them is increasingly being parked in short-duration bonds and money markets.
The core idea is simple: when safe money pays, risky money must justify its existence.
In this environment, risk isn’t being chased, it’s being re-priced. And that, more than any headline or earnings report, may be the most important development traders face in 2025.
Numerous legendary traders have exploited this idea in recent years.
When the crowd was still chasing tech stocks and sipping the Kool-Aid, Victor Niederhoffer was doing what real traders do — watching the tape and pulling the trigger when it mattered. The guy wasn’t guessing. He wasn’t “hoping.” He had a rule: when 10-year Treasury yields hit 5%, it was time to short the stock market and back up the truck on bonds. That’s exactly what he did in October 2007 — dropping a billion-dollar short position on stock futures. Boom. Yields climbed, stocks tanked, and he walked away with a monster profit. Not because he predicted the news — but because he understood the math. When risk-free bonds start paying enough, they steal oxygen from stocks. That’s not a theory — it’s a law of capital flow. Victor saw it. He acted. And he cashed in while others were still asking, “What just happened?”
Stanley Druckenmiller? Same league. Different approach, same core belief. One of the sharpest macro minds in the business, Druckenmiller has warned about bond stress and even stayed short when yields were rising. But he’s also been crystal clear: when Treasury yields climb above 5%, that’s your cue to think twice about chasing stocks. Because suddenly, Uncle Sam is handing out solid returns — no drama, no earnings misses, no CEO missteps. That changes the game. It tilts the risk-reward scale. Stocks that looked like home runs now must compete with a sure thing. Druckenmiller, like Niederhoffer, knows the real action isn’t always in the hot sector of the moment. It’s in reading the bond market’s signals before the rest of the herd even looks up.
Right now, the market’s not trending — it’s thrashing.
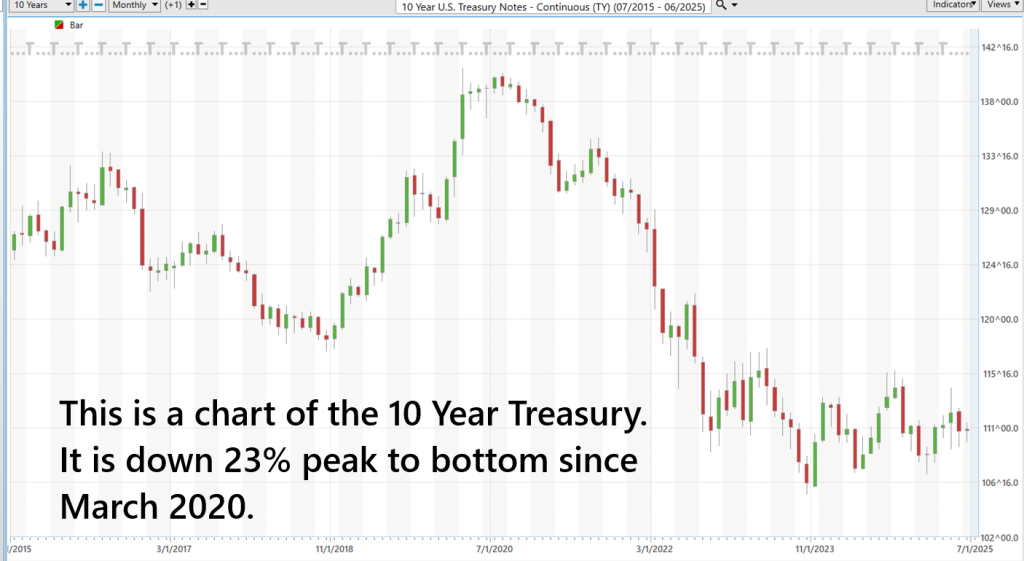
Here is a 52-week chart of the S&P 500 Index followed by a 10 Year Chart of the 10 Year US Treasury.
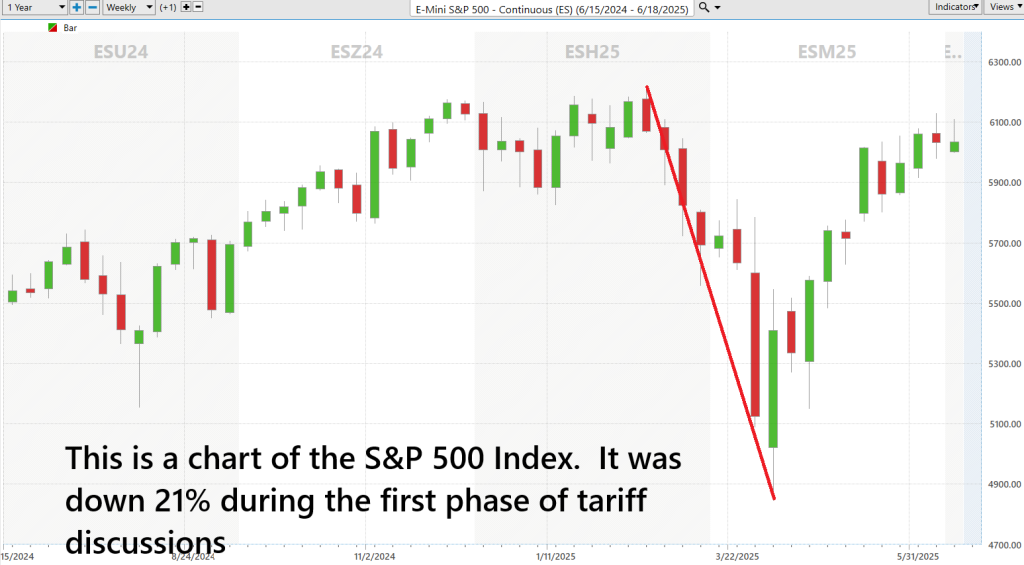
What makes this chart so compelling for me is that over the last 8 months many traders who were watching bond yields opted for the safety of Treasury bills as opposed to the volatility of the S&P 500 Index.
One day it’s fear, the next it’s FOMO. Money floods into T-bills when the headlines scream recession or war. Then, boom — one inflation print comes in soft and everyone stampedes back into tech like it’s 2021 all over again. This isn’t investing, it’s a bar fight between risk and safety, and the smart money is dodging punches while the amateurs get flattened.
If you’re still trying to trade this market by gut feel or watching yesterday’s news, you’re already behind. The edge now belongs to the traders who’ve armed themselves with faster tools—like A.I. that tracks rotations in real time. Tools that don’t wait for CNBC to catch up. While everyone else is reacting, they’re already in position.
Because in this kind of two-lane market — where capital swerves between safety and speculation like a drunk driver — you’ve got to be nimble, you’ve got to be data-driven, and you’ve got to move before the crowd even knows what’s happening.
This isn’t about being the smartest guy in the room. It’s about being the fastest one to spot where the money’s going next.
In the digital age, the greatest threat to the fiat monetary system isn’t simply inflation or central bank policy missteps — it’s the gradual erosion of trust in the system itself.
The yield on the 1-year U.S. Treasury sits at approximately 4.15% — a level that carries significant implications for investors, policymakers, and the broader market alike.
At face value, this may appear to be a routine figure. But in context, it reflects a profound shift in the financial landscape. For more than a decade, investors operated in a near-zero interest rate environment, where yield was scarce and capital was pushed toward riskier assets in search of returns. Today, the picture looks markedly different. A 4.10% yield on a one-year Treasury bill offers not only a respectable return but does so with zero credit risk, making it one of the most competitive and liquid instruments available in the market.
This return challenges traditional asset allocation assumptions. For conservative investors, it presents a viable alternative to dividend-paying equities or corporate bonds. For institutional capital, it sets a new benchmark against which risk-adjusted returns must be measured. In short, it alters the risk-reward equation at every level. When government-backed securities deliver this kind of return, the opportunity cost of holding volatile assets like growth stocks or emerging market bonds becomes harder to justify.
As capital begins to rotate into these short-duration, high-yield instruments, the effects can be felt across sectors — from compressing equity multiples to draining liquidity from speculative corners of the market. In this environment, investors are no longer chasing returns; they are redefining what return is worth chasing.
At the core of the fiat model lies a promise: that currency, untethered from a physical commodity, will be managed responsibly. Yet in an era defined by unprecedented stimulus, growing deficits, and balance sheets measured in the tens of trillions, that promise is wearing thin. Fiat currencies rely on perception. And increasingly, traders and investors are asking a fundamental question: what’s a dollar really worth if it can be printed indefinitely?
The concern is practical. Traders, particularly those with exposure to long-duration assets, are watching the slow decay of purchasing power in real time. Food, housing, energy, these essentials aren’t subject to the same monetary narratives. They reflect the real-world consequence of a system where supply of money grows faster than output. As capital seeks shelter, we’re seeing increased interest in digital alternatives — Bitcoin, stablecoins, tokenized assets — not necessarily as a bet on technology, but as a hedge against fiat fatigue.
What was once considered fringe is now becoming a legitimate question for asset allocators: can you preserve wealth inside a system that quietly punishes savers? That’s the quiet reckoning happening beneath the surface of global finance.
Why A.I. Isn’t Optional Anymore (If You Want to Survive in This Market)
Let’s get something straight — the market you’re trading today isn’t the market you grew up with. It’s faster. It’s more volatile. And it’s being moved by algorithms that don’t sleep, don’t hesitate, and don’t care about your gut feeling.
That’s why Artificial Intelligence isn’t a luxury anymore—it’s a necessity.
You want to know why most traders get smoked? It’s not because they’re lazy. It’s because they’re late. They react after the move has already happened. They buy the top, sell the low, and chase headlines like a dog chasing parked cars.
That’s where A.I. flips the script.
The real purpose of artificial intelligence in trading is simple:
👉 Keep you on the right side of the right trend at the right time.
Not tomorrow. Not next week. But right now — while the smart money is still moving.
This isn’t about magic. It’s about math. A.I. scans billions of data points — technical indicators, sector rotation, momentum shifts, intermarket correlations — and tells you where the real action is before it shows up in the news. While the crowd is still arguing about why something moved, you’re already in the trade.
Look, you can try to wing it. You can keep refreshing charts, chasing rumors, and hoping you get lucky. But hope isn’t a strategy. Edge is.
Here’s Your Next Move:
We’re hosting a Live A.I. Trading MasterClass where you’ll see it in action—real charts, real trades, real time. No fluff. No filler. Just the raw power of predictive analytics showing you where the market’s headed before the move.
If you’re serious about trading smarter, faster, and without the second-guessing, this is where it starts.
👉 Click here to register for the Live A.I. MasterClass.
And show up ready — because the markets won’t wait. And neither should you.
It’s not magic.
It’s machine learning.
THERE IS A SUBSTANTIAL RISK OF LOSS ASSOCIATED WITH TRADING. ONLY RISK CAPITAL SHOULD BE USED TO TRADE. TRADING STOCKS, FUTURES, OPTIONS, FOREX, AND ETFs IS NOT SUITABLE FOR EVERYONE.IMPORTANT NOTICE!
DISCLAIMER: STOCKS, FUTURES, OPTIONS, ETFs AND CURRENCY TRADING ALL HAVE LARGE POTENTIAL REWARDS, BUT THEY ALSO HAVE LARGE POTENTIAL RISK. YOU MUST BE AWARE OF THE RISKS AND BE WILLING TO ACCEPT THEM IN ORDER TO INVEST IN THESE MARKETS. DON’T TRADE WITH MONEY YOU CAN’T AFFORD TO LOSE. THIS ARTICLE AND WEBSITE IS NEITHER A SOLICITATION NOR AN OFFER TO BUY/SELL FUTURES, OPTIONS, STOCKS, OR CURRENCIES. NO REPRESENTATION IS BEING MADE THAT ANY ACCOUNT WILL OR IS LIKELY TO ACHIEVE PROFITS OR LOSSES SIMILAR TO THOSE DISCUSSED ON THIS ARTICLE OR WEBSITE. THE PAST PERFORMANCE OF ANY TRADING SYSTEM OR METHODOLOGY IS NOT NECESSARILY INDICATIVE OF FUTURE RESULTS. CFTC RULE 4.41 – HYPOTHETICAL OR SIMULATED PERFORMANCE RESULTS HAVE CERTAIN LIMITATIONS. UNLIKE AN ACTUAL PERFORMANCE RECORD, SIMULATED RESULTS DO NOT REPRESENT ACTUAL TRADING. ALSO, SINCE THE TRADES HAVE NOT BEEN EXECUTED, THE RESULTS MAY HAVE UNDER-OR-OVER COMPENSATED FOR THE IMPACT, IF ANY, OF CERTAIN MARKET FACTORS, SUCH AS LACK OF LIQUIDITY. SIMULATED TRADING PROGRAMS IN GENERAL ARE ALSO SUBJECT TO THE FACT THAT THEY ARE DESIGNED WITH THE BENEFIT OF HINDSIGHT. NO REPRESENTATION IS BEING MADE THAT ANY ACCOUNT WILL OR IS LIKELY TO ACHIEVE PROFIT OR LOSSES SIMILAR TO THOSE SHOWN.


