




Welcome to the Artificial Intelligence Outlook for Forex trading.
VIDEO TRANSCRIPT
VantagePoint A.I. Market Outlook
US Dollar ($USDU)
Okay, hello everyone and welcome back. My name is Greg Ferman and this is VantagePoint AI market outlook for the week of August the 3rd, 2026.
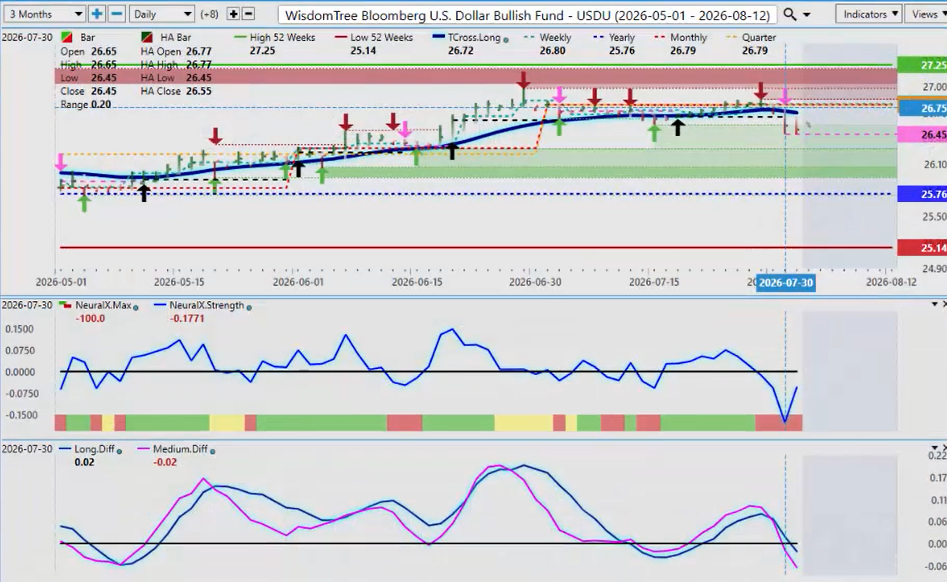
Now, to get started this week, we’ll begin where we always do with that very important US dollar. Now, the dollar coming under pressure this past week for a number of different reasons. The two main reasons, the Fed backing off its stance on rate uh hikes. We also had the Fed indirectly endorsing uh the Bank of Japan intervention by saying that the yen is grossly undervalued. That obviously set off US dollar selling pressure.
But in my respectful opinion, only the clear pattern that I’ve seen, the dollar is usually very strong in the week of the non-farm payroll number or in the first week of the new month up until the week after the payroll number. So looking at our our trading setup here over the last few months, you can see that the dollar coming off the yearly opening price. Now I do like to change things up once in a while. So I’ve added in the VantagePoint Predicted Heikin Ashi bars. And as you can see when we’re using the T-Cross Long and the black arrow that warns us that we’ve got momentum building.
So, we’ve had a bit of a push down here on uh on Friday, Thursday and Friday of last week, but I believe that to be temporary. If we look at our neural index and our neural index strength more specifically, that is showing that the potential that this is just the market reacting to to the Fed and the potential of that intervention. So, for next week, T-Cross Long is coming in at 2670. We know that we have this dollar strength coming. It’s just a question of uh what will happen with the U.S.-Iran war to start the week.
But again, ultimately that dollar does strengthen and we do have uh at least what would appear to be a short-term reversal signal.
Gold ($XAU/USD)
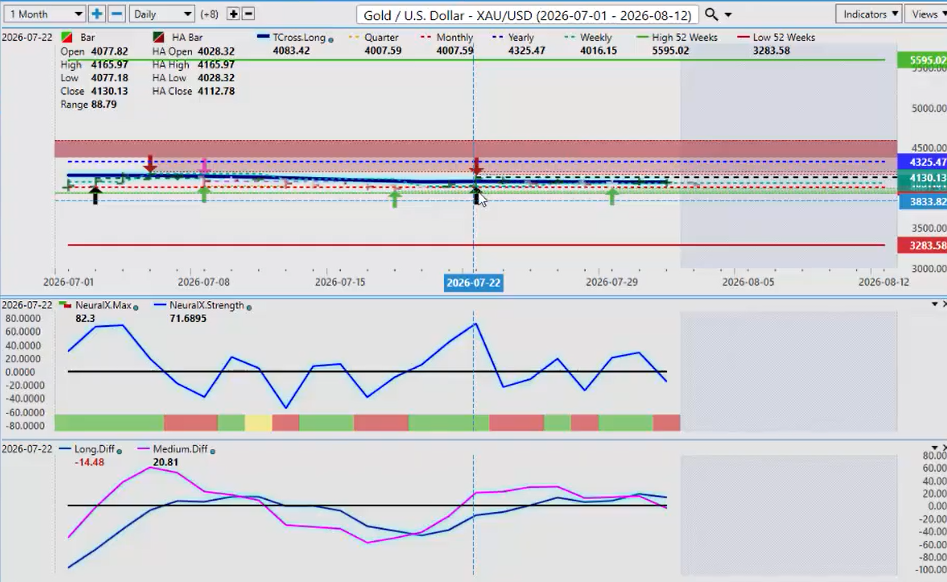
Now, if we look at gold going into next week, once again, the most recent signal here above the T-Cross Long back here on the 22nd, but gold is really running sideways over the last month or so. And July is usually not the best month to buy gold. Usually, it’s October through into about mid-January, but we could see some strength forming. Right now we do have a medium-term crossover to the downside. Neural index is pointing down.
This is indirectly uh confirming what I already suspect is that basically the sell off in the US dollar will be very short-lived because we know also the dollar is strong again mid-August through the about mid-October and with September being in most cases the dollar’s strongest month. So for now uh again gold is not overly bullish here. Uh I would prefer to get above 4325 the calendar yearly opening price and that’s where I will set buy stops right above that area. So if we can clear that yearly opening price then I’ll have a buy order ready to go at that suggested level.
DAX
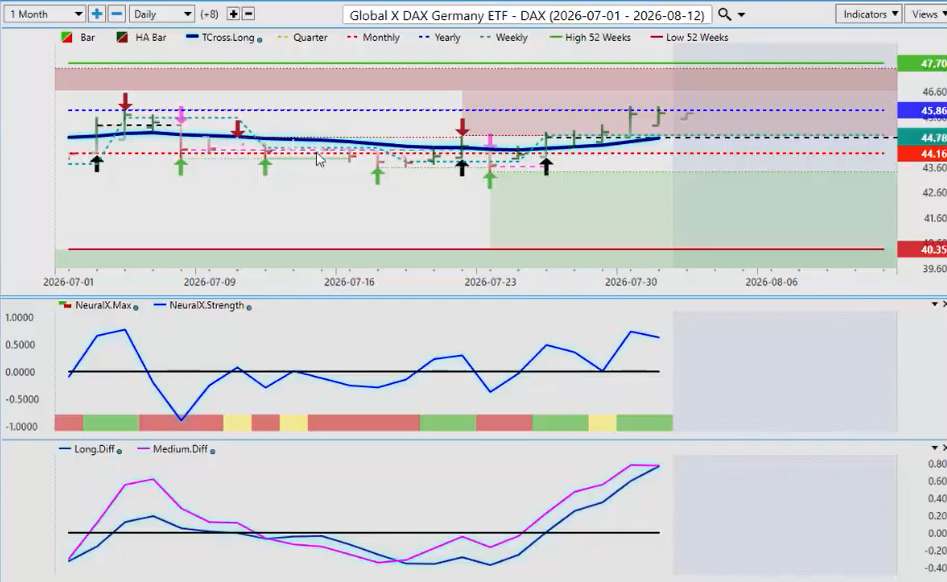
Now if we look at the main equity uh ETF starting with the DAX. Now again, uh I like to show things and change things up a little bit. Now, soon as we cleared the T-Cross Long right here, that tells me, okay, we’ve got strength coming here. We had some volatility right beside it, but we want to stay with the T-Cross Long. The most recent buy signal on the DAX came on the 27th just a few days ago.
So again, we’re pushing stronger, but we’re stalling right at the calendar yearly opening price. Now, when we look closer at our VantagePoint software, this purple line is about to cross over the dark colored blue line. So, the medium-term strength, which is clearly to the upside, is weakening against that longer term strength. So, once again, that would suggest here that the DAX could struggle next week. But if we can get above 4578 and stay above that then the then the Global X and the DAX futures will both extend higher.
But at this time my optimism on that remains heavily guarded.
Nasdaq 100 ETF (QQQ)
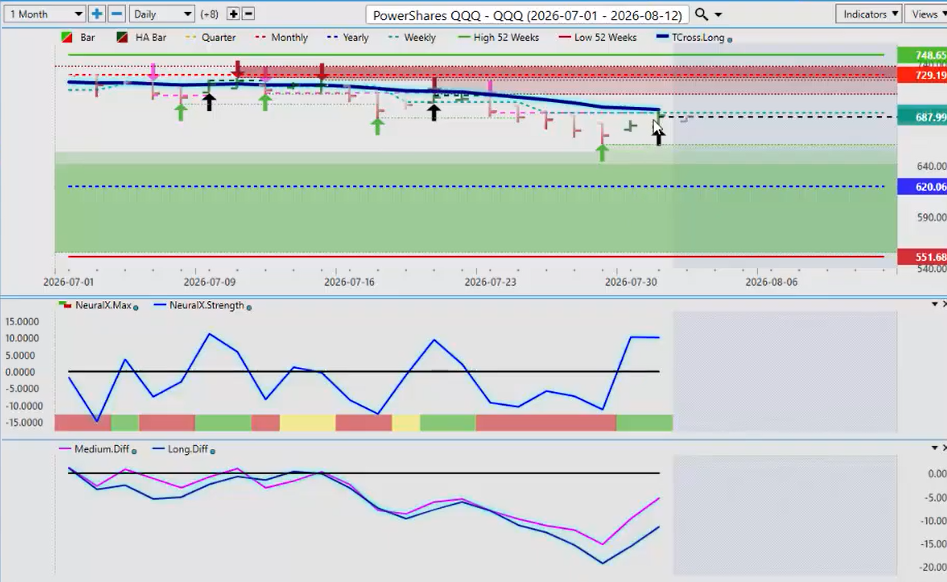
Now if I cross reference this to the Q’s once again with the Q, we can see that a fresh Heikin Ashi signal is forming. However, what I will point out is we remain below the T-Cross Long. Now we are above the calendar yearly opening price. There is some m momentum building here but I suspect that that momentum will start to wane closer to Tuesday and Wednesday as the dollar strength potentially kicks in. Now our neural index is strong but you can see the neural index strength is not it’s uh struggling here to show any kind of momentum but again uh we are getting uh a very light buy signal on the Heikin Ashi again suggesting momentum is building here but again I believe that to be very short-term.
S&P 500 ETF (SPY)
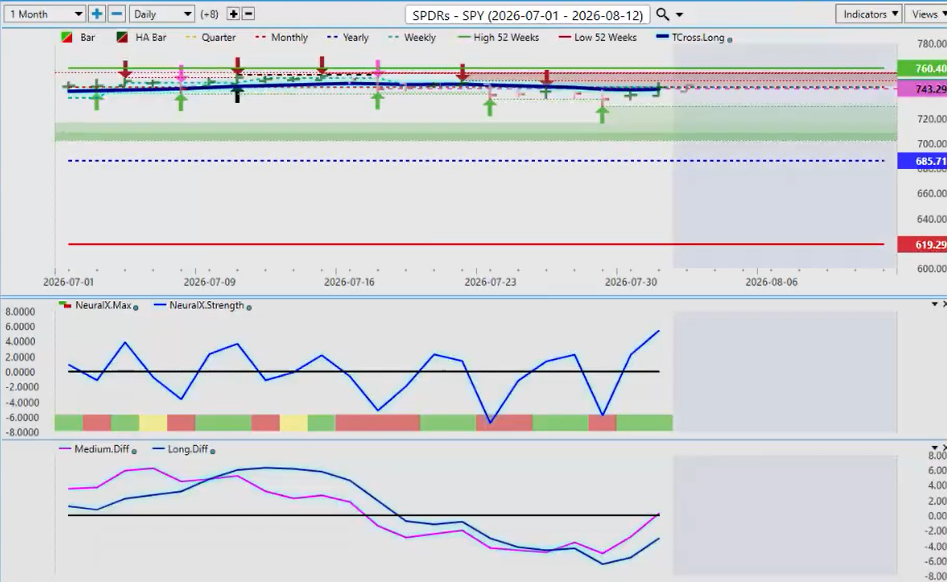
If we look at the spies now the spies are doing better than the Q’s that that is for sure we have crossed over the T-Cross Long, but I don’t have a buy signal yet coming from the Heikin Ashines. But I do have a buy signal coming from the neural index, the neural index strength, and we have a medium-term crossover. But my my concern with that medium-term crossover is that I need a clean break of the T-Cross Long at 74310. If we can get above that area and hold above that area, then and only then can we potentially extend higher.
Bitcoin
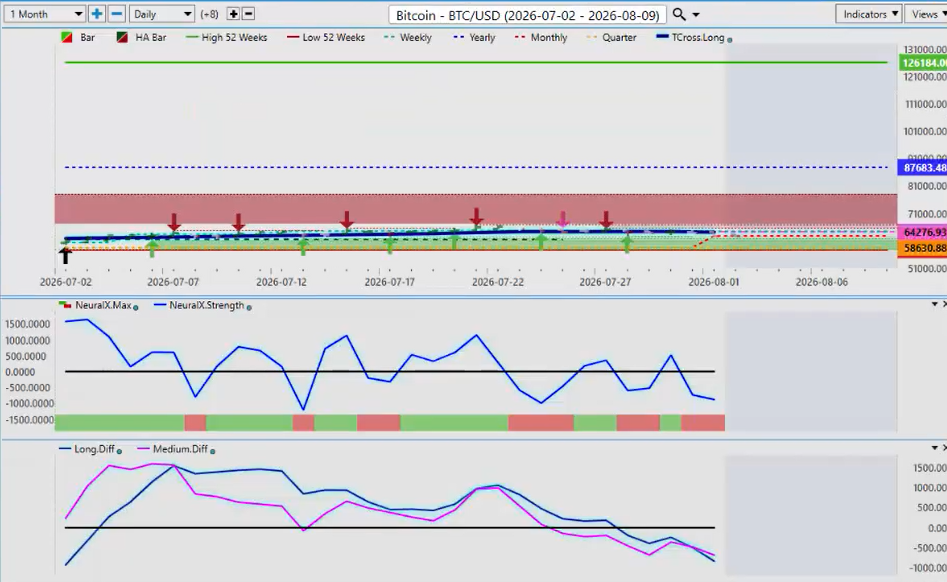
Now when I look at Bitcoin once again, Bit the rally in Bitcoin very very short-lived here uh this past week. My view on this is that Bitcoin remains sideways until we get into mid to late September and then October, November, December and potentially uh starting again in 2027, Bitcoin gets much stronger. That’s the pattern that that I’ve seen over the last 10 15 years that we have three years up then we have a significant down year. That would be this year. Then the next three years were up.
So again we’ll monitor this and update everybody uh each week on this because again this is a weekly outlook guys not a monthly just a weekly. But for now uh again the T-Cross Long is the one to keep your eye on. 64,050. That’s the critical level. Our 52-week low is sitting down below that at 58,630.
I believe we do come down to that level potentially in the next week or two.
Euro/U.S. Dollar
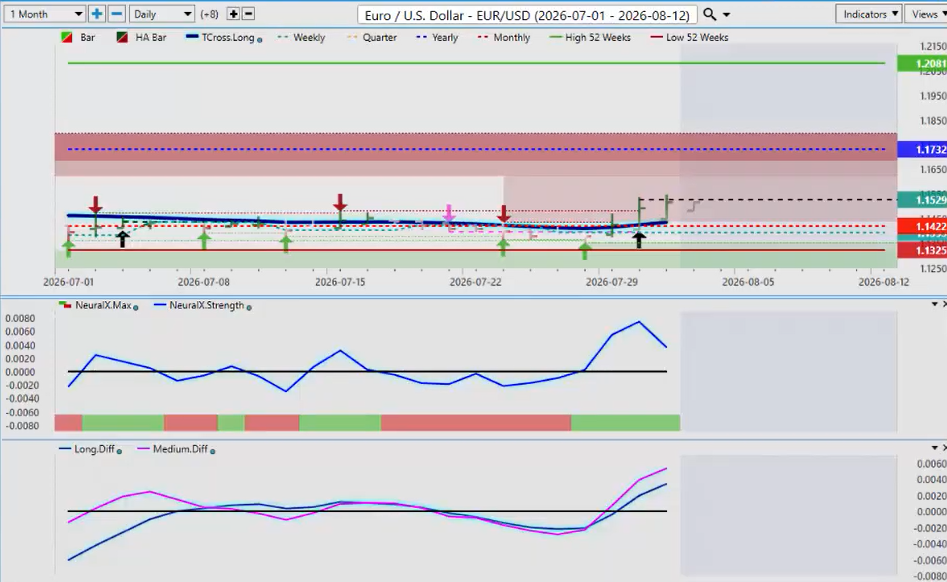
Now, when we look at some of our main forex pairs, again, I will focus on the core forex pairs against the US dollar, the euro/U.S. dollar. So, the euro/U.S. dollar has a newly formed hacky buy signal coming off the 52-week lows, but we’re above the T-Cross Long, but we are still negative on the year. The primary trend here, guys, is still down.
And the easiest way to determine what the current trend is, are we positive or negative on the year? Now, on a side note, we are positive on the month and the T-Cross Long is intersecting with the monthly opening price. All of that support here, guys, is coming in right at 11435. So, for next week, this is a relatively simple setup here. Uh, we would only buy on a retest of the T-Cross Long, but I believe we would have sell stop orders ready to go below the 114 level because if we go down below 114 again, we’re likely to retest 11325.
Now what I can tell you again the euro predominantly does not fare well in August and September uh and even part of October. These are dollar strong months for the US dollar and again the Euro zone talking about ra uh raising rates. I seriously doubt that uh because that would boost their currency which would kill their tourism and really that’s all the Europe has going for it is tourism. So there are some other things there too but again uh not strong months for the euro. So for now we we have the high of that Heikin Ashi bar coming in at 11537.
We would need to stay above this if this is a breakout to retest 11732 but that is extremely unlikely in the next uh in the week ahead. But we’ll monitor it. The main thing is guys know your levels right and everything is happening right around the 11435 area.
British Pound/U.S. Dollar
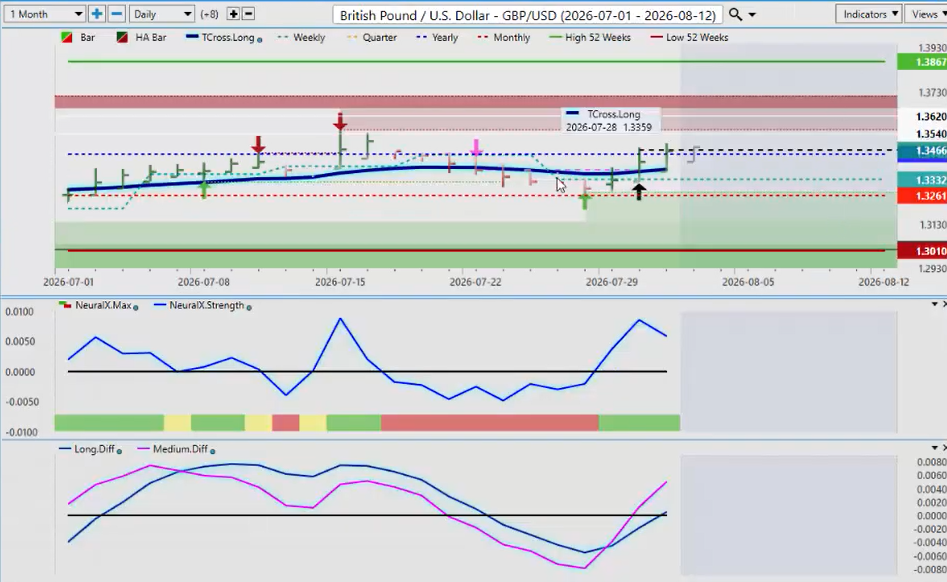
Now the British pound this past week once again the calendar yearly opening price that is coming in at 13448 that is containing the rally here. Now, we do have a a fresh buy signal coming off that quarterly monthly opening price, but we we will next month in the month of um August, we will have a diff a different monthly and quarterly opening price, which I’ll talk about in next week’s outlook. But for now, uh we are positive on the quarter, but it’s really struggling to get above and hold above the calendar yearly opening. So again, we have a medium-term and a long-term crossover with a fresh buy signal on the Heikin Ashi, but we need to hold above these two levels if we are going to continue to buy this. So one of the other ways that we can play this is have sell stop orders below the T-Cross Long at 13379 and additional shorts below the quarterly opening at 13261.
Now if we can hold above that all-important yearly opening price then maybe we can extend higher but again ne next week is probably not that week. Uh I think that the the dollar will get hit on Monday then Tuesday and Wednesday it starts to recover.
Australian Dollar/U.S. Dollar
Now the Aussie/U.S. dollar pair again a very popular pair. It’s been in a very strong uptrend all year guys. So when we look at the Aussie/U.S. dollar pair from the start of the calendar year, there’s indisputably that this has been in a very very strong uptrend in 2026.
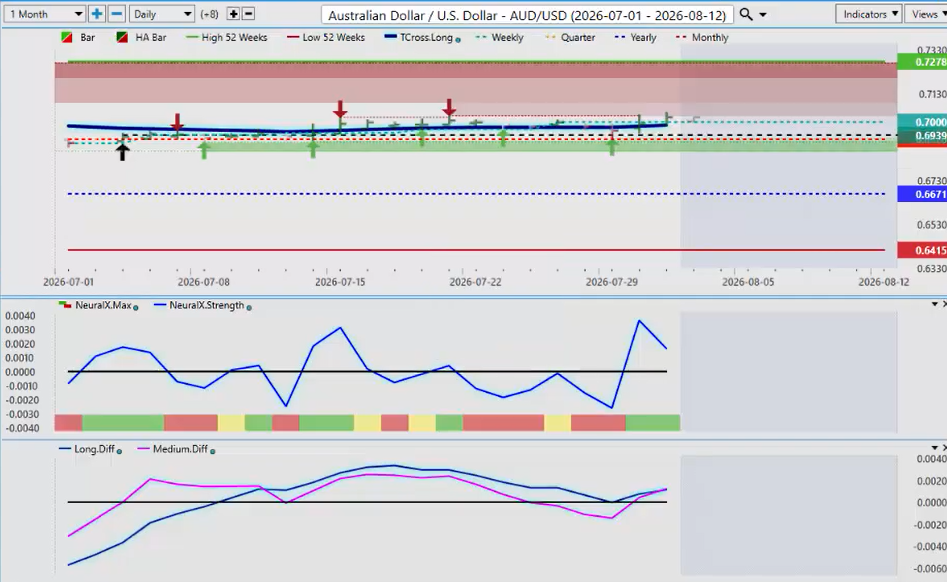
Anything to do with the Aussie, Aussie, Swiss franc, Aussie New Zealand’s been pretty good. Uh Aussie CAD, all of them. But the main thing is we identified that trend. So looking at it right now from a shorterterm perspective, we can see that the the last signal we have from the Heikin Ashi was right at the beginning of the month on on the third of the month. And basically we’ve had our ups and downs during that period, but we have held on a retest of the quarterly opening multiple times.
So for next week, how does it look? Well, we’ve got our MA Diff Cross, which is to the upside. Uh I believe we will come down a little bit lower next week probably down into the 6920. Watch that area very closely. That is the quarterly opening.
But if we look at the stacking the quarterly, the monthly, the yearly opening price, everything is pointing higher on this. But again, uh you do have that period of known dollar strength. So be careful of that. Okay. But again, the data coming out of China a little bit softer could affect the Aussie, but ultimately uh I believe the Aussie is one of your better bets if you’re selling US dollars.
It’s much better to do that with the Aussie than the euro in my respectful opinion because there’s a very different trend here. The Aussie is in a clear uptrend. The euro is in a clear downtrend.
U.S. Dollar/Japanese Yen
Now next week again all eyes are going to be on the the dollar/yen. I don’t believe uh the Bank of Japan will be successful in it with intervention even with the help of the new Fed chair Kevin Walsh. I don’t think that that’s going to work. Historically what we’ve seen with the Swiss National Bank uh in the Bank of Japan’s previous attempts and this is a mess that they’ve created guys uh in during the co years they intervened and said they were going to protect the 100 level on the dollar/yen. Well that really blew up on them.
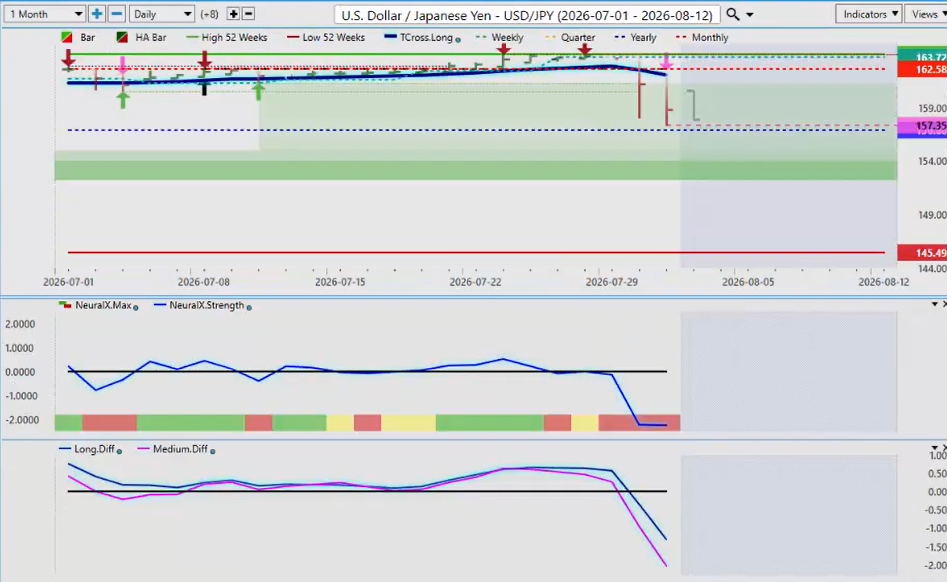
Then the Fed started hiking. Next thing you know you have a massive carry trade meaning buying dollars selling the yen. Now we are at a critical level here. The yearly opening price 15728. The key thing, like I always say, guys, know your levels.
The low end of that bar is 15731. I believe, be careful on the open Sunday night. You can see that this video is being done at 11:44 a.m. on Sunday morning while the markets are closed because again, this is an outlook, guys, not a recap of something that’s already happened. We’re forward looking here.
So that yearly opening price 15728 the lower end of that Heikin Ashi bar 15731 that’s where all the activity is going to be and I I do think the Bank of Japan is going to be into the markets again this week. So be careful of this particular pair.
IES Holdings ($IESC)
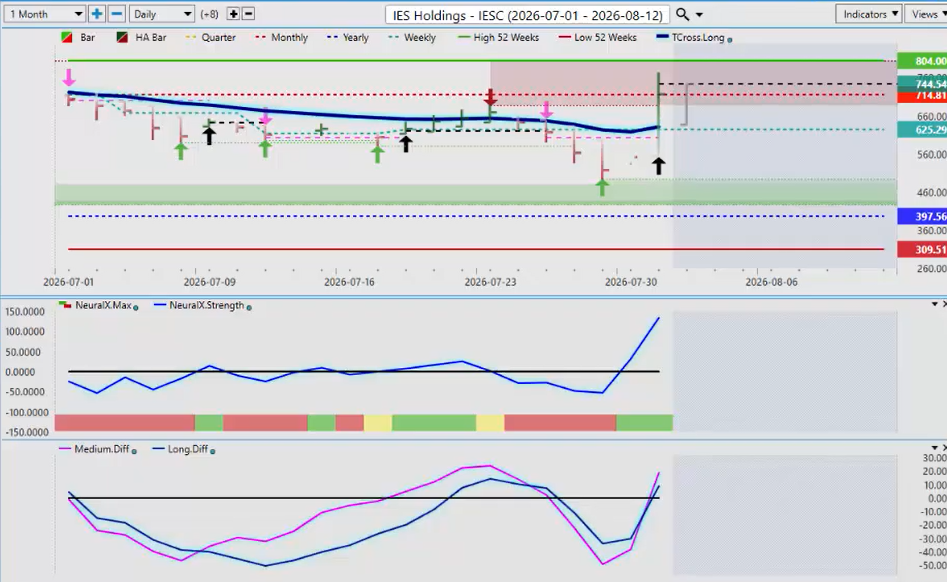
Now as we look at a a couple of stock trades for the month again I like to mix these things up a little bit. Let’s first of all start with IES Holdings. Now, IES Holdings, you can see we’ve had a big push on Friday. Uh, and again, we’ve cleared the T-Cross Long and we’ve cleared the monthly opening price while the entire time we’ve been above the yearly opening price at 39756. So, I believe we will pull back closer to the T-Cross Long, that level at 63,169. and the indicators from VP are saying that this still remains a a pretty strong option uh on the stock side.
Hess Midstream Partners ($HESM)
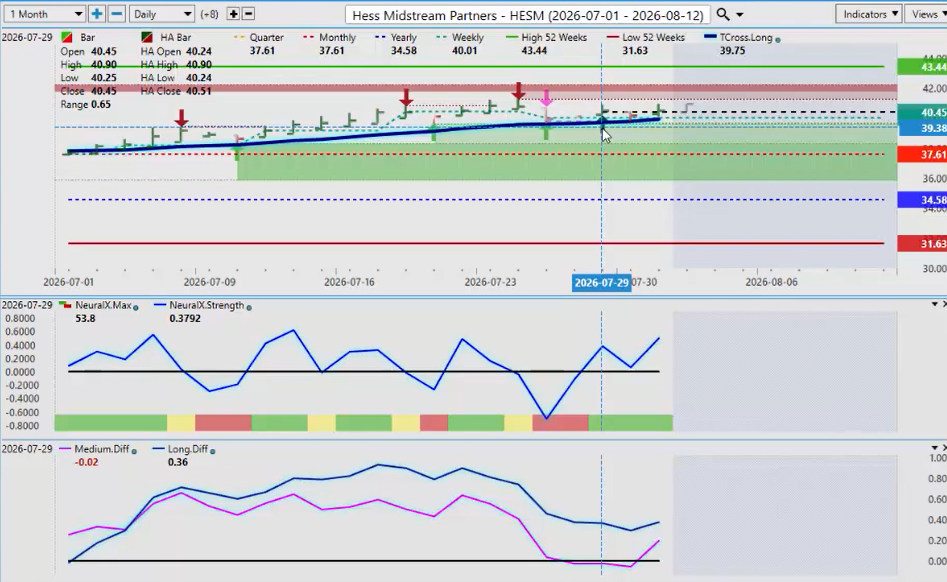
Now the additional one again we would look at would be HESM. Now HESM is a little bit better value in my respectful opinion only. You can see that two days ago on the 29th we actually had a newly formed Heikin Ashi signal off of the T-Cross Long. Now, what I’ve seen personally in trading and investing over the many years in this industry is a lot of people will try and play both sides of the trade where we don’t really need to guys. We identify the primary trend starting with the yearly opening price 3458.
We’re above that. The quarterly and monthly opening price 3761. We’re above that. Then we look at the T-Cross Long 39.95. And again, we’re coming off of that.
And and again, this is uh showing a corrective move only on the Heikin Ashi bar. So, we stay with the primary trend. And you will see uh a very a pretty solid signal here uh when the conditions are correct. But I would prefer personally with any type of system like that I would like to see uh that signal forming above the T-Cross Long not below it. So like a sell signal forming above the T-Cross Long is unlikely to work.
I want to stay with the primary trend. So everything there still looks good even though we’re going into a new month. The other way we can look at this too is one year ago. How did this do? Well, the stock really had a big push in August and it was actually closer to uh September where it started to to slip here.
So again, uh in my respectful opinion only, I would say that there’s probably a little bit more upside on this stock, at least for this coming week. But again, volatility is high. Uh we’re we we had a strong move off our 52-week lows. But again, we always want to make sure we’re looking at what the primary trend is.
Retail ETF (RTH)
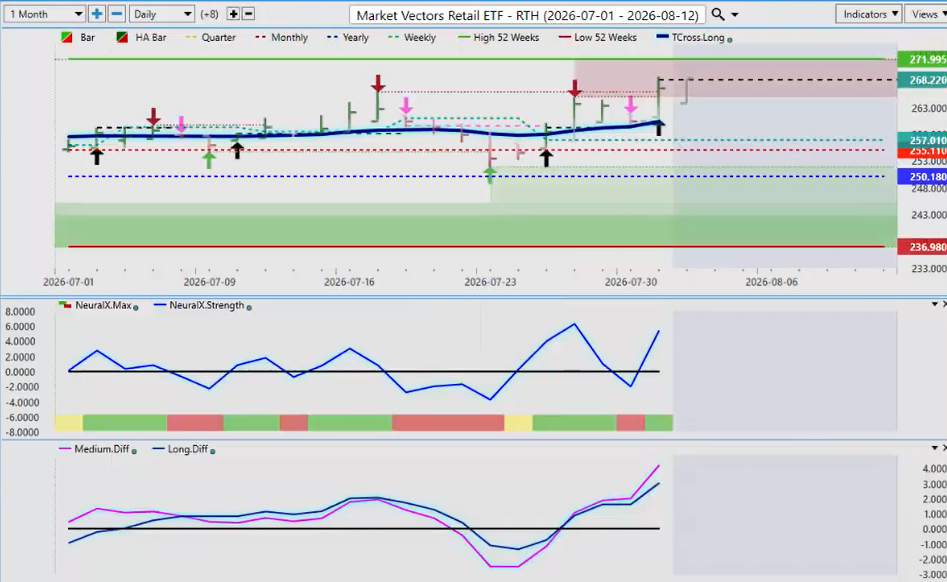
Now, again, giving something to the ETF market either also. So, we’re covering basically most or if not all of the markets. Uh RTH, uh uh looks to be a pretty decent ETF here. Uh, and what we’re see what I’m seeing is every time I get one of these Heikin Ashi signals near the T-Cross Long, I get a pretty strong move. And so we have a new one is formed on Friday.
And again, this is an outlook, guys, not a recap of something that’s already a market that’s already moved. I’m looking for this to retrace closer to the T-Cross Long 260 where longs still appear to be reasonable on this. Now again if I look at this from a seasonal perspective where were we last year and you can see last year we had a very similar signal that formed with the T-Cross Long and the Heikin Ashi and again we were above the quarterly and the monthly opening and the yearly opening prices. So this one it’s a little choppy like most ETFs and stocks are but with that will always come opp with opportunity. So with that said, this is the VantagePoint AI market outlook for the week of August the 3rd, 2026.