


Register for a Free Live Training
The Hot Stocks Outlook uses VantagePoint’s market forecasts that are up to 87.4% accurate, demonstrating how traders can improve their timing and direction. In this week’s video, VantagePoint Software reviews forecasts for Regeneron ($REGN), Beacon Roofing Supply ($BECN), NVIDIA ($NVDA), AMD ($AMD), Oracle ($ORCL) and Verizon ($VZ), Bank of New York ($BK) and Kroger ($KR)
Hello again, traders and welcome back to the Hot Stocks Outlook for April 29th, 2022. Hope you all are having a great week out in the financial markets. And like always, plenty to cover here in today’s outlook. We’re going to revisit Regeneron. We got these two charts to take a look at. A lot of weakness throughout the tech space. We’ll look NVIDIA, AMD, also Oracle, and really just some weakness in general.
I just want to highlight how the VantagePoint tools here are picking up on weakness throughout the marketplace, and that’s made it very easy to identify areas in the market to trade.
When we start here off with Regeneron, we looked at this last week. I have these two charts up just to really highlight the shift that we had. We had all this strength coming from February, which was actually very similar to what the broader markets did.
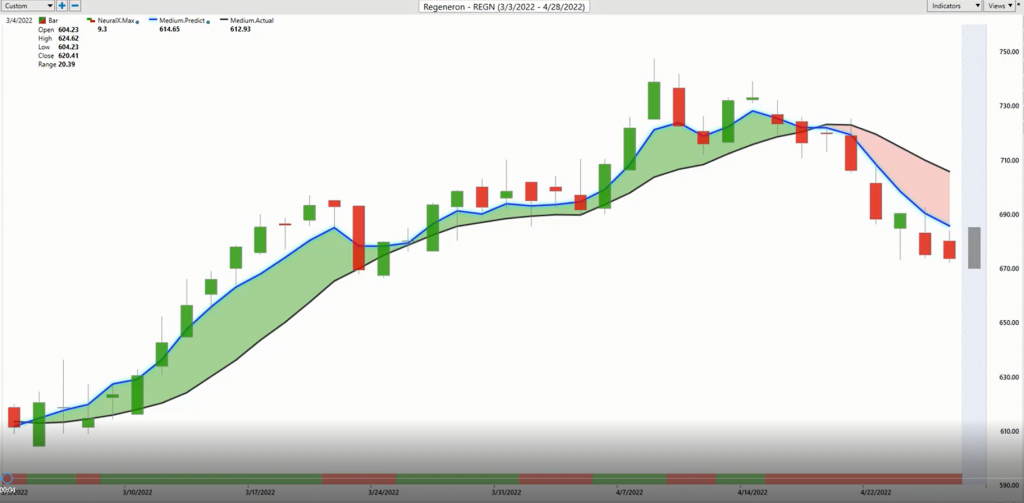
You saw the S&P bottom out, but we’ve started to see a lot of signals as far as weakness even in markets that have been quite strong. We highlighted this crossover to the downside last week in Regeneron. I can just use this other chart to go ahead and zoom in here and see how this works. Now, what you have here with shares of Regeneron is daily price action. Each one of these candles is a full and complete trading day. Right up against that price date, you’ll notice that there’s a black line and also a blue line there.
The black value that you’re seeing on the chart is a simple moving average. That’s a very common technical indicator. In this case, it just looks back at the previous 10 closed prices and adds them all together and divides it by 10. That acts as a good measure to smooth out the existing price action, but all that data that constructs that indicator is really coming from the past. It really lets you know where market prices have been. But traders need to be ahead of that next move and understand where are prices likely to go next.
What we’re able to do with this technology with VantagePoint is actually compare that black, what you might call a lagging simple moving average, to this predicted moving average. For that number to get calculated and plotted against the chart every single trading day, this is where VantagePoint’s technology of artificial neural networks are performing what’s called intermarket analysis.
What that means is rather than just looking at the past prices of Regeneron, like most technical analysis indicators, what this technology is doing is looking at markets that are known to drive and influence the future price of Regeneron. Now, that’s going to be things like pharmaceutical share of ETFs. That’s going to be things that like individual stocks, the value of the dollar index is rippling through the markets right now, crude oil prices, commodity prices, global interest rates.
All of these things factor in to even these subtle day-to-day movements of the markets that you’re participating in. This is how we can get a huge edge as far as what to expect next in the market. These neural networks are very good at taking in huge amounts of data and making predictions forward. What we have with that blue line crossing below the black line is suggesting average prices are going to start moving lower.
What happens is that information taken from that neural network process is actually used to generate future predictive data that hasn’t yet occurred. It’s that technologically driven data that’s used to construct these moving averages, turning what were lagging tools into forward looking predictive tools. Now, in addition to that predicted moving average though, there’s other indicators here that also utilize this technology, but to solve different problems that kind of manifest themselves in different timeframes.
At the very bottom of the chart here, this is what’s called the predicted neural index. We see that this does go from green to red. It stays red here. What this indicator is forecasting is very short-term strength or weakness just over the subsequent 48 hour period, short-term strength or weakness in the market. In addition to that, you’re also provided with a predicted high and a predicted low for every single trading day before the trading day occurs.
We looked at this last week with Regeneron, but this is why this is so important to get really good entries into the marketplace and understand that in a market such as this, you’d only want to short, take profits on shorts. We’re getting a tremendous amount of weakness here. You see, you’re not even getting back up to this predicted high, but you see how these predicted lows do a very good job as far as the market gap down trades within the range, but it’s still moving lower.
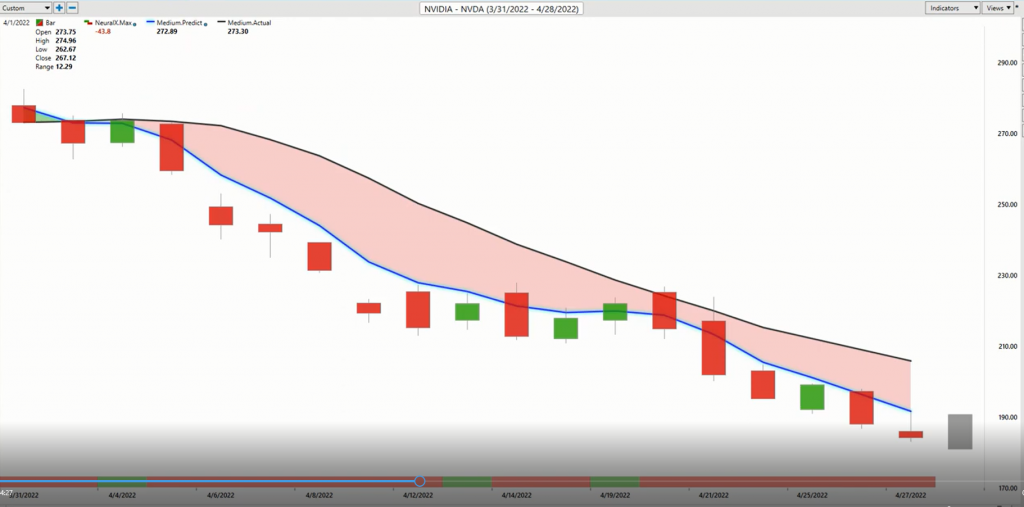
And very clearly you would only want to short, take profits on shorts would be the only thing that makes a whole lot of sense. You see how very bearish these forecasts are, with this predicted moving average moving well below the actual moving average. Regeneron, we’ve seen this weakness manifest more recently, but this has been going on for a while, especially in the tech space. There’s been a really tremendous opportunity to get some shorts, whether it be the NASDAQ index or some of these tech stocks.
But here in NVIDIA, we looked at this last week as well, we get this crossover to the downside, and then we can update these forecasts. We see that very clearly all you’ve gotten over the past week here is a continued forecast to the downside here in NVIDIA shares and certainly we’ve seen a lot of weakness throughout that space. Now, the reason I wanted to bring this through with NVIDIA is you see that actually last week, we hit this level and have come lower, but we haven’t gotten anything over the past few days.
But when you understand where to be looking in the marketplace and understand which markets are trading in tandem, well, let’s look at AMD here and say, “Okay, well, if we’re trading AMD, where might there have been some opportunities midweek?” Well, if we have these levels, we’re going to have a day like this that says, “Okay, well, look, you’re trading above the predicted high. We know there’s a lot of weakness in this area. This might not be a bad place to go ahead and set a short position.”
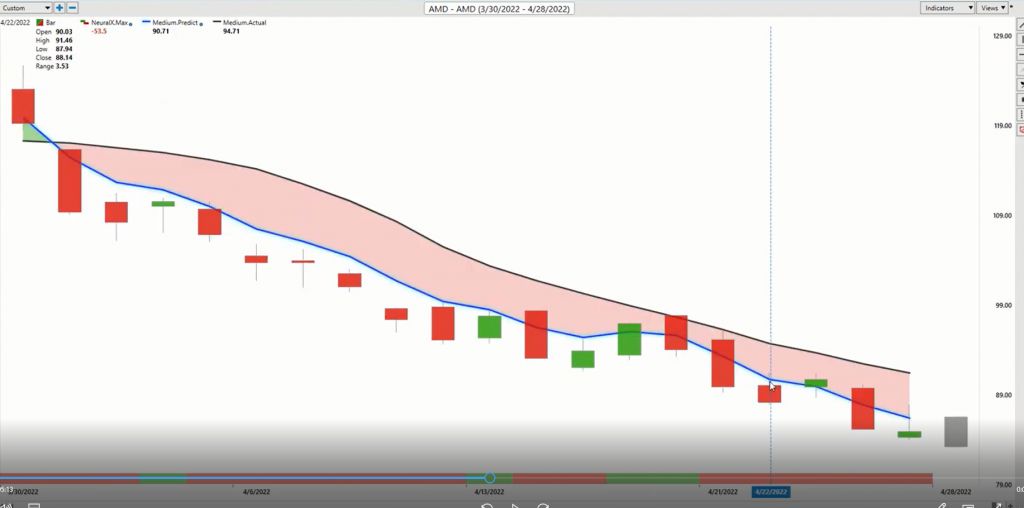
And sure enough, dramatically moving lower and that’s about it. Just moving lower here at least over the past week, but not too hard to say, “Okay, well, what’s the bias here on the markets? Are we more bullish or more bearish?” Well, we’ve just seen a tremendous amount of bearishness especially in the tech space.
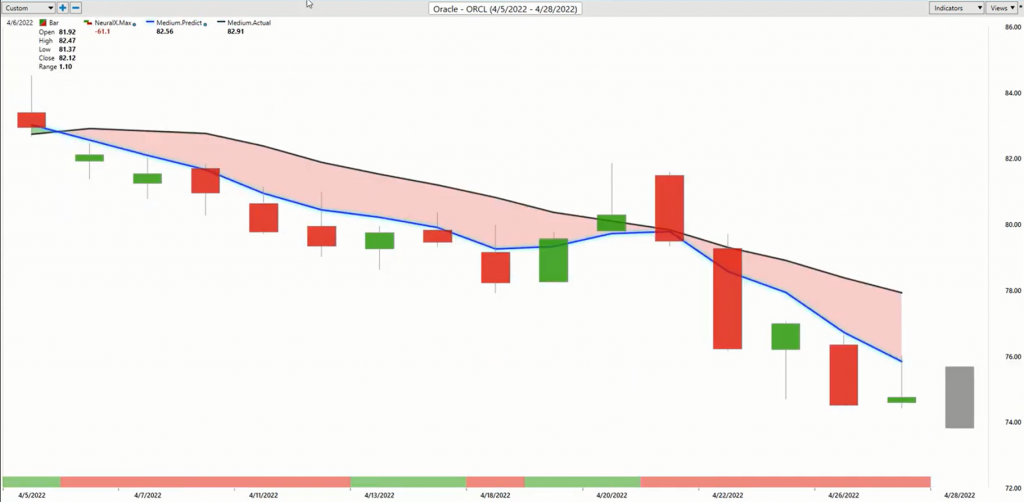
Here, again, is Oracle. I just wanted to highlight, again, the neural index and some of these short-term tools where you see how the neural index gets bullish here.
You have to remember that this is a 48 hour indicator. It’s looking ahead and gets this right with upwards of 80 plus percent accuracy. You can think of it as you have an indicator down here that’s going to get it right four out of five times. But we can use the compliments of these other indicators to say, “Look, the overall trend is down, but okay, expect some strength coming in over these subsequent 48 hour periods.” But as long as that blue line remains below the black line, the overall trend is lower.
You see, once to the neural index gets bearish again, that weakness accelerates to the downside. And of course, we can, again, use tools like the predicted highs and lows to say, “Okay, well, where are these levels intraday where we might want to go ahead and actually establish positions?” If you’re actually ready to short on days like this and have a strategy that will deal with that volatility, you’re just going to get short at the open, and then have the market move lower. You see another predicted high here.
You’ve got about six levels here just over the past couple weeks as shares have continued to move lower and been under a tremendous amount of pressure here. Very clearly until we start seeing more crossovers to the upside, then we can start going along, but we’re really not seeing much of that. This is why over the past couple weeks we keep bringing in these tech stocks, keep highlighting these shifts to the downside, because that’s the prevailing situation that’s playing out.
Now, you have noticed I’ve looked at shares like Caterpillar and some of these capital good shares because that’s one of the few areas where the VantagePoint software has been picking up on some strength.
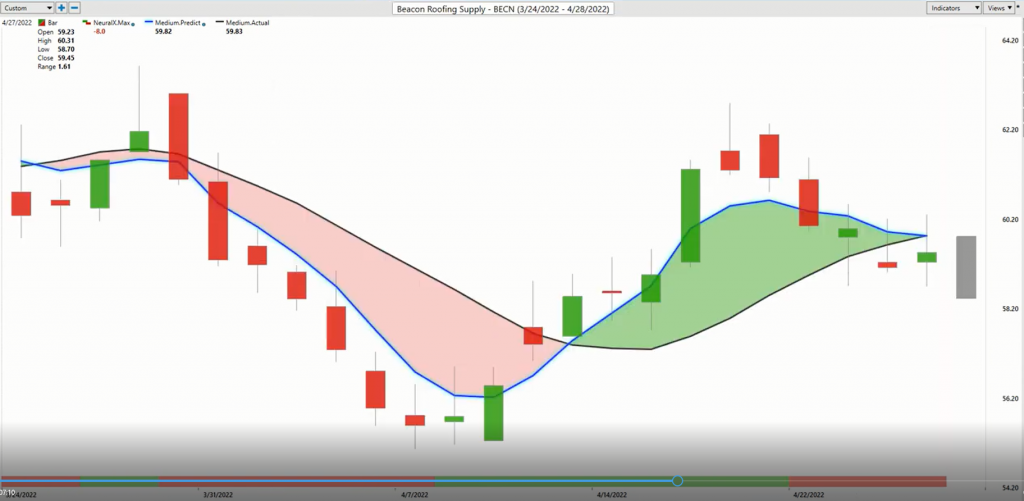
We see here in Beacon Roofing Supply, we had a couple weeks of some really nice strength here in the market. We can look at the predicted highs and lows and just see how effective this has been on the downside, as far as upside where you might want to short, and then from the downside where you might want to be taking long positions.
But we see that things are not only tremendously weak throughout the broader marketplace, but we see here the neural index getting weak here in Beacon Roofing Supply. It’s not as dramatic of a crossover, but still we’re just seeing that pressure manifest quite widely throughout the market. We can adjust these positions, understand, okay, I want to get long. Take profits on long. That’s fine.
But again, just using things like predicted highs and lows and understanding that if you are trying to get long, that should be complimenting some of these short positions which have been the over prevailing sort of situation here. We see the index is under an enormous amount of pressure here. Now, over to the financials. We’ve looked at a couple of these, keyCourt, Morgan Stanley a few weeks ago, and that weakness continuing.
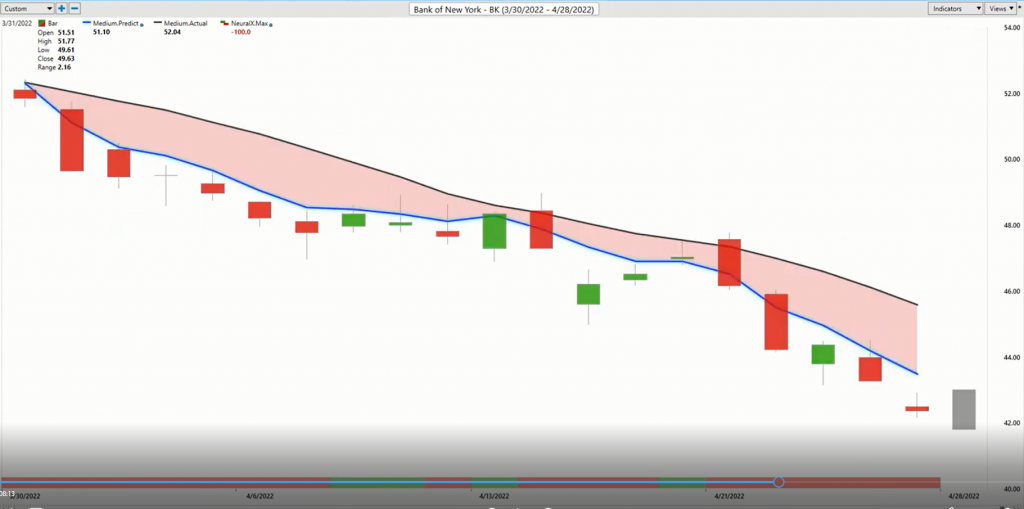
Here, Bank of New York crossed over the downside.
Again, a little bit of strength here over these subsequent 48 hour periods. Here it’s actually wrong, but here it’s right four to five times here. It gets it right with a very high level of accuracy. And when you can tie that in with these other predictive indicators, like your predicted highs and lows, like your predicted moving averages, you’ve really got quite the tools here to make some good trading decisions regardless of the timeframe in which you’re operating here.
Again, you see as this market really runs sideways, the software doing an excellent job at picking up the upper side of this range and having you available to make money as these declines come in over the longer term, because that’s what you would expect with what we’ve seen. Again, just taking a look at some of these moves here, about a 17% decline in the past 19 trading days. Again, just the breadth of this. You’re seeing financials. We’ve got the technology stocks for sure, healthcare, pharmaceutical stocks.
There’s certainly some warning signs out there. And if things shift, great. We’ll understand; there has been stocks like Kimberly-Clark, I believe, and also Sherwin-Williams, some of these things there’s a little bit of strength out there, but there are some real problems there. It just seems like the software has definitely been alerting you to… Overwhelmingly, you’re getting at least recently, past couple of weeks here, more signals to the downside.
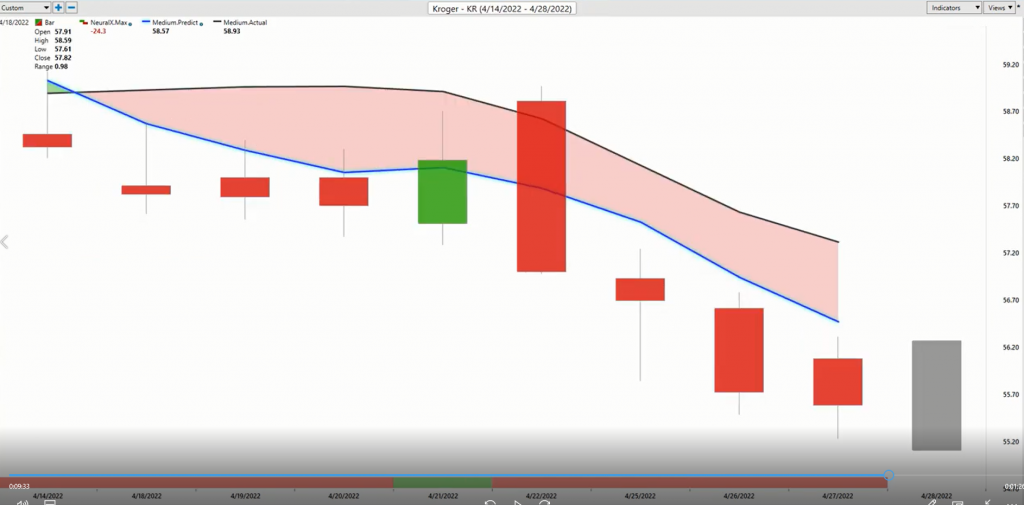
Here, shares of Kroger crossed over to the downside here.
You see neural index gets bullish, and there’s this aspect to the neural index that looks at higher highs over those 48 hours. You see you get that gap up, but the overall trend is down here. Of course, you’d want to just use those VantagePoint tools to be looking to short up at predicted high levels and ideally take some profit potentially at those daily predicted lows. There’s not a lot of variety to a lot of what’s going on here. It’s just indicated that, look, there’s definitely some weakness spread out throughout the market.
You’ve had the forecast that guide you each and every day, sort of walking you forward that say, “Okay, how do you make those little day-to-day adjustments to get the best out of many of these opportunities?” But it’s all about just walking this forward and understanding that, yeah, we had a lot of markets that were in up trends. We can certainly trade those markets with that blue line above the black line and things look to be in an up trend.
But when you start seeing these shifts in more and more the marketplace, and this can be evidenced by using some of the other tools within VantagePoint to really automate seeing a lot of these shifts in the market, you’re recognize them as soon as possible and able to participate and really extract as much value out of that market as you can. Once again, this has been our Hot Stocks Outlook for April 29th, 2022. Thank you all for watching. Best of luck and bye for now.


