Welcome to the Artificial Intelligence Outlook for Forex trading.
Okay, hello everyone and welcome back.
My name is Greg Firman and this is the Vantage Point AI market outlook for the week of July the 14th, 2025.
Now, to get started this week, we’re going to do things a little bit differently here. Uh, a signal in Vantage Point is starting to form around the US dollar. So, what I’ve done is split the screens, brought all of our markets in here, uh, because again, this is an outlook, not a recap of something that’s already happened.
PowerShares DB US Dollar IDN Bullish Fund ($UUP)

So the dollar currently, using the uh UU up ETF and the Vantage Point software, with the starting of the new quarter. Now what I can tell everybody is that in most cases—not all—the dollar is not strong in July. But we are in the US fiscal fourth quarter that ends September 31st, and in most years, that’s the strongest the dollar is.
So, as you can see, it’s starting to form a different signal here. The current quarterly opening price coming in at 26.83. As long as we’re holding above that, then that seasonal pattern of dollar strength into August and September is potentially underway.
Now, the UUP is down 9.18% on the year. This is probably the worst performance the dollar’s had going back 30 years. So again, that’s not a reason to buy it, but if the signals in Vantage Point are supportive of that, then we would look at that. So, our T-Cross long 27.13.
Now what we want to do is say, okay, we have a very clear line in the sand: 26.83, and our T-Cross long at 27.13. If we can continue to advance from these levels, how is that not only going to affect the forex pairs but the equity markets and the commodity markets?
SPDR SPY ETF ($SPY)
So looking at the SPYs right out of the gate, the SPY is in a different picture here. The dollar is well below its yearly opening price, 29.15, but the SPYs are firmly above their yearly opening price. Now, I would argue there’s been a significant period since November 2024 where these two have been positively correlated—not just the standard inverse correlation that obviously is still there—but they can move up together at the same time.
And if that’s going to happen, it would be between basically now and October 1. So for now, our key level on the SPY, again, we want to look at that quarterly opening price at 616.36. That is a key level. Then we move down from there to our T-Cross long, 614.79.
If we can hold above these two levels, then the SPY—the equity markets—can still advance even with dollar strength.
Now, Monday we’ll see no shortage of volatility yet again, guys. Uh, cuz tariffs are going against everybody. So, we’ll see how this one plays out, but expect a very rocky start for the equities on Monday. But as long as we know these key levels, then we can trade them.
So, again, I will point that out — it is possible for them both to move up — but I will also concede, largely, there is still an inverse correlation.
DAX

Now when we look at the global equity markets — more specifically the global XDAX ETF — then this one is very interesting also because you can see once again, as the dollar is moving lower, the DAX — that has fueled DAX strength.
So if the dollar — or when the dollar — moves higher as we start moving towards September, then the DAX is far less attractive to us at this time of year.
So our quarterly opening there is going to come in at 44.56. Our T-Cross long: 44.83. The DAX has without a doubt been the better play, but now that could be running out of steam, and that could also affect the Euro currency which I’ll talk about in a minute. But the main thing is that we identify these core levels. If we break down below that, that will confirm the dollar is going to be fueled again with real demand for US dollars, despite all the tariff nonsense and all this stuff. Does somebody need to buy US dollars? I would argue yes, they do — in the US fiscal fourth quarter, which we have now just entered into.
Volatility Index ($VIX)
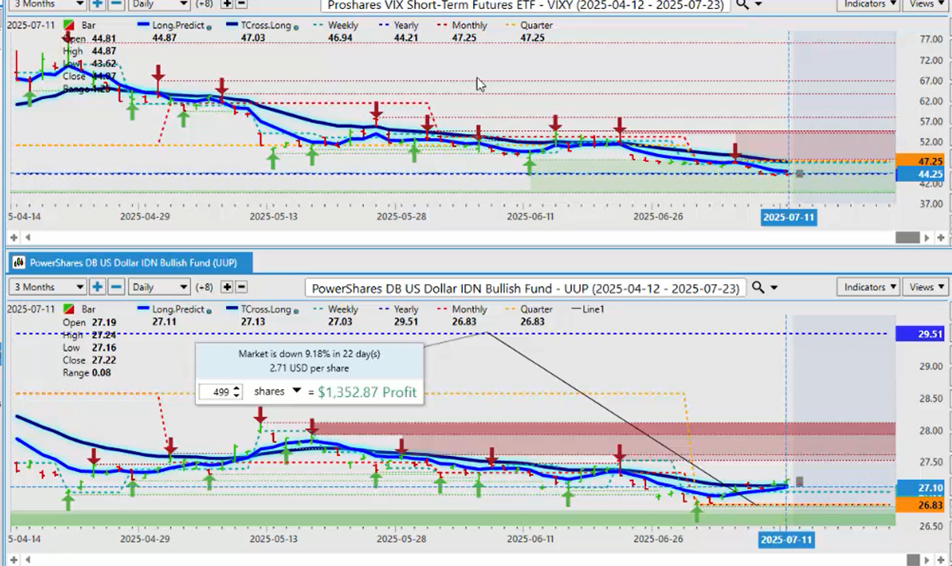
Now, how will this affect the VIX? So we want to watch this VIX very closely here on the ETF side. The calendar yearly opening price: 44.21. We are now opening below the quarterly opening price. So this is suggesting that the VIX is getting ready to move lower. But there could be a new trend starting here, guys. That’s what I would warn of, because the VIX has done very well this year — but that could be coming to an end, and I believe a lot of that is coming from hedging with the uncertainty from tariffs.
Bitcoin

Now, with Bitcoin — Bitcoin here is another one that’s very interesting. We’ve had a big push up, and the seasonal pattern, at least for the last 5 years, does support this strength. But I firmly believe we will have a sell-off before the real move happens — which is in September and October. But again, I could very well be wrong, and that move could be underway right now. In most cases, Bitcoin against the US dollar goes in three-year cycles. If you look back at the performance of Bitcoin: 3 years up, 50% down; 3 years up, 50% or more in a down year again.
So, right now, I will warn everybody — we are in the third year of that same three-year rally. And if it’s going to sell off or have a corrective move, by the charts and by its own performance, it would be 2026.
So, we’ll watch it into the year-end. But for now, I would advise caution — extreme caution — buying it up here. Because in most cases, they’ll flush the market out before the real move occurs. And I’m pretty confident I know when that’s going to be — which is September through October. It’s the same every year when you look at the charts. But this year is a little more ominous, so be careful.
But our main level with the VP level — our long predicted, which is only a moving average (not a standard crossover) — is 113,885. Our T-Cross long, which is a major pivot level, is 110,296. If we break either way, in my respectful opinion, that’s our retracement point. If that can hold, we’ve got the added protection of the quarterly opening price at 107,598. But I can’t rule out a retest of 93,84 before year-end — the current calendar yearly opening price.
No live prices being quoted here — just talking about pivot levels, quarterly opening, yearly opening — just to avoid any confusion.
United States Oil ($USO)

So when we break down that side of the trade, then I’m also going to bring in the commodities here — which again is very interesting. This particular trade setup — we can see that oil and the US dollar largely have a very, very high correlation. Now, the war between Palestine and Iran and Israel — the US jumping in — causes a spike in oil. But the dollar did spike.
But you’ll notice here something that I want everybody to see — oil started moving lower with the dollar. They reconnected to each other. So starting the quarter right here, you can see that oil and the dollar are rising together. The ETF here — which is very fascinating, how Vantage Point has moved towards these ETFs — and when I do a comparative analysis, which I will in a moment with the actual dollar index, I would argue there is less lag in the actual UUP ETF.
Is it possible that the ETFs are weeding out that false price from the futures market in the Asian market and in the London and European markets — and it’s focusing more on the US session? That’s entirely possible. And that price in those markets is causing distortion. I’ve seen that very clearly with the DAX. I showed it about a month ago — how the DAX ETF did not break below its calendar yearly opening price, but DAX futures did.
So that volatility there — if we look at this right now — I would say that there is a very strong positive correlation between this. So if oil right now — USO — is just breaking above its yearly opening price (that’s at, again, the yearly 76.84) and now the very important quarterly opening price at 73.61.
So looking at these charts, the performance, the correlations — I would respectfully submit that if the dollar can break higher, as we start moving higher, oil will likely do the same. So this will be a very interesting play.
But if we look at the actual dollar index itself, we can see that the dollar index is struggling a little bit here, while the UUP ETF is giving us a clean signal. Now, they’re both down almost exactly the same — one is down 10.94% on the dollar index, and the ETF approximately 9.18%. So when you’re trading the UUP, it is the same trade — but the performance is what we have to look at.
So again, the dollar index itself is slowly rising up here, but I would respectfully again submit that the ETF has far less — far, far less — lag. So again, that very small lag time here can be an early entry point too for signals. But again, when we look at that dollar index, it is holding behind the actual ETF.
So that is something to watch, and I will update from time to time.
Gold ($XAU/USD)
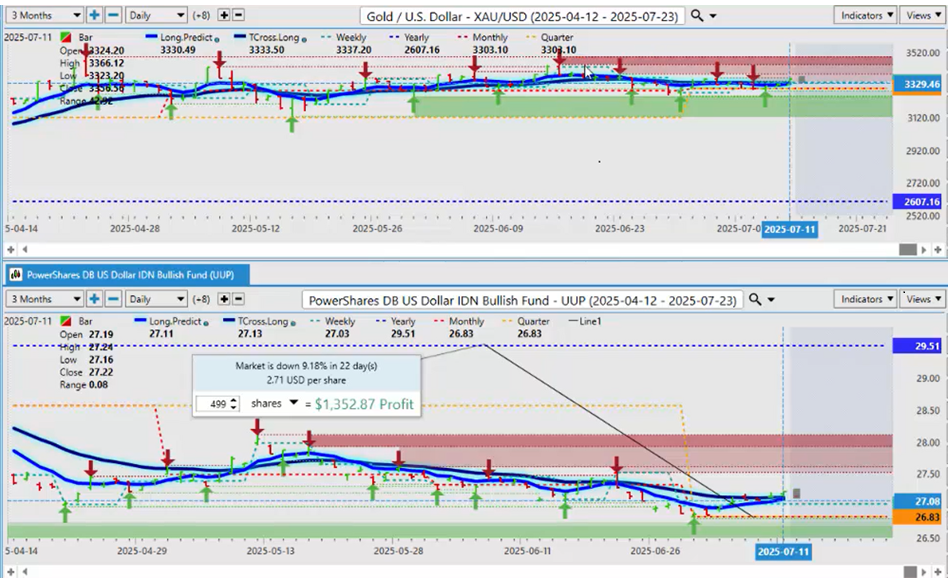
Now when we look at some of our main forex pairs — before we do, we also want to have a look at gold here using XAUSD. Now this one is very interesting. Not a lot of buying up here over the last, probably the last month, month and a half. There is solid buying from the monthly opening price, but the signal is getting a tad weaker now. With more tariffs coming in, that’s likely going to boost gold. But the bigger rally in gold usually is in mid-October through mid-January — once we get past that seasonal period of US dollar strength.
So we could see this pushed lower here, but we are holding above the quarterly opening at 3,303. The monthly — obviously that’s going to be the same price this month. The yearly: 2,607. So I don’t think we’re going to have that deep of a retracement. There’s more than enough fundamentals to keep gold firm.
Just always remember the inverse correlation between gold and the US dollar — that doesn’t always stay the same. I’ve seen, particularly in August, September, and October in conditions similar to these — I’ve seen the dollar and gold both go up and down together.
So, watch the key levels here right now. But there is still a bullish tone to gold. But the dollar likely won’t overshadow that too much at this particular time.
Euro versus U.S. Dollar
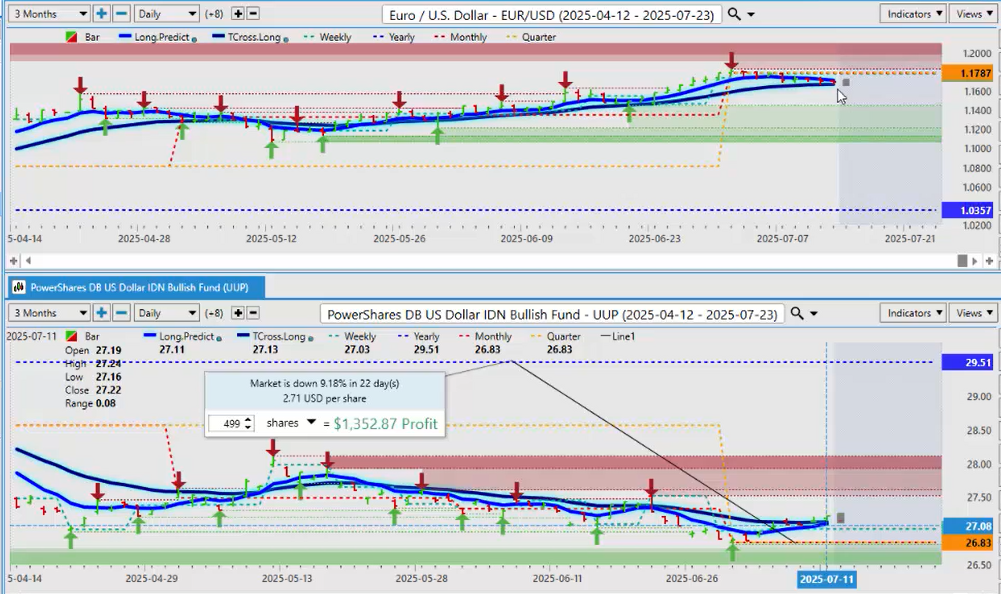
Now, when we look at our main forex pairs here, we look to see which pairs are above the T-Cross long and which pairs are not. I’ve already scanned through them, and it’s approximately between 52% and 62% favoring — if I work in the UUP — favoring dollar strength this week in the forex market.
Now again, we’re at critical levels here. But the main one we would watch would be Euro-US. Now, what I personally find interesting about this — respecting the fact there’s a 99.999% inverse correlation between the dollar index and EUR/USD — Euro did not break down below its T-Cross long at 1.1670.
So what I will respectfully again submit: for the beginning of the week, that is the key level to keep your eyes on here, guys.
Now, if we look at our quarterly opening price, we’re running right along it. We have not been able to get above it so far, but in most months, it’s actually in the middle part of the month where the dollar is a little bit softer.
So we could see a bounce on the Euro, but the UUP is saying a long is building here — which means a short EUR/USD. So, keep an eye on that critical level. And if you are shorting it, make sure your stops are above the quarterly opening price at 1.1787 — or allow the market to come higher potentially on Monday and set your shorts closer to that area.
But again, you will have another very volatile start to the week.
British Pound versus U.S. Dollar

Now when we look at the British pound, it has broken down already below its T-Cross long. It did very poorly right out of the gate. The quarterly opening price — second day of the month — it pushed lower. So for next week, again, all of your G7 pairs are based around the dollar index.
So that T-Cross long — that’s going to come in at 1.3596. And then we have our quarterly opening at 1.3733. So we’ll watch these areas right now. But again, the minimum area you would look at a short would be up here at the long predicted and the T-Cross long. They’re both now at the exact same level.
So our resistance for the week — we’ll just round it out and say 1.36 if you’re going to short. Now again, if you’re shorting, you want to make sure you’re not getting tagged out between the T-Cross long and the quarterly opening at 1.3733.
Australian Dollar versus U.S. Dollar

Now the Aussie continues to buck the trend. Even with the dollar strength, it’s pushing higher. But you can see on Friday where it’s failing — right at that quarterly opening price: 65.81. So if we enter into a big risk-off market, which I think we will off the open tonight with all these tariffs being hit with the European Union, I think it’s going to be more of a risk-off environment, and this could hurt the Aussie.
So be mindful of that. But if you’re buying up here, then it would be advised to be cautious around 65.81, because if it’s going to fail, that’s where it’s going to be. The T-Cross long is providing our support for us and buying opportunities this past week: 65.38 to start the week. I do anticipate we will test that level.
But the main thing we want to look at: is the dollar strong across the board? The answer is no — it’s actually not. It’s on a very select few pairs. So, keep a very close eye on that one also.
U.S. Dollar versus Japanese Yen
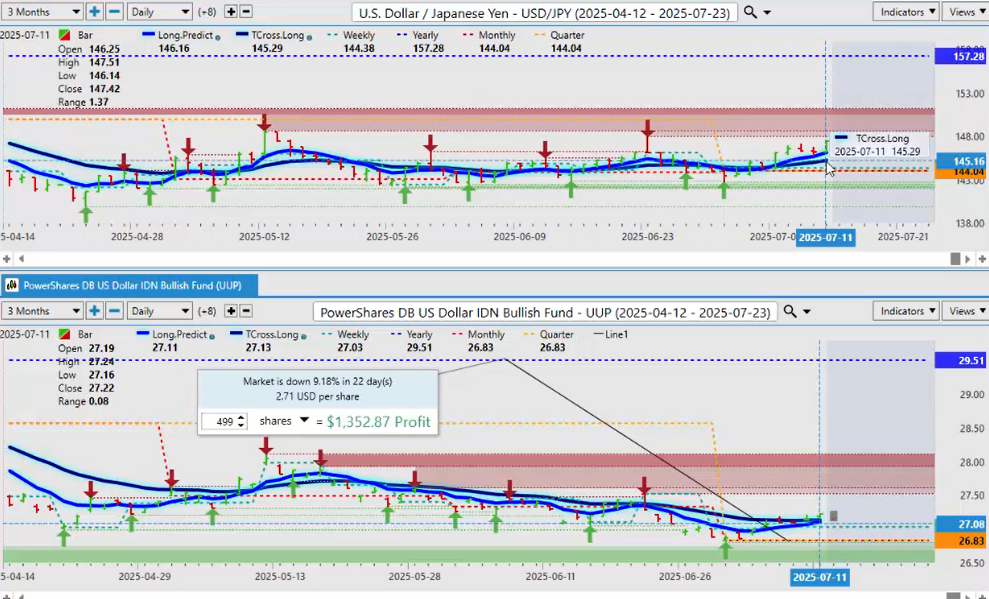
The dollar-yen is trying to push higher again. But a risk-off scenario, in my respectful opinion only, would favor the yen more than the dollar. But the time of year that we’re in — when we look at it — the dollar-yen, this is the polar opposite year it’s having with respect to last year. We are well down on the year. So again, a retracement higher is perfectly normal.
We’ve got some very stiff verified resistance at 148.65. So again, this could be another area where real money — whether they want to or not — they have to buy US dollars. This also is fully supported by the carry trade, at least for now.
But I believe we have the US CPI coming out next week. If that’s a hotter number than expected, and the Fed is saying he’s not going to cut, then that favors a long actually here — and you’re in a period of known US dollar strength.
So again, watch your quarterly opening: 144.04, and we’ve got our T-Cross long at 145.29. So, if you are so inclined to buy this, it’s going to be between 146.16 and 145.29 — because again, this is an outlook, guys, not a recap of something that’s already happened. We want to target levels to buy and sell from going into the next trading week — before it starts trading, not after.
U.S. Dollar versus Japanese Yen

Now when we look at the US Canadian dollar — now US again, tariffs are back on the table. I think 35% for Canada August 1st. So as you can see, the Canadian dollar is being affected by that. The US Canadian pair pushing higher.
The key levels to watch again on this one going into next week: the quarterly opening 1.3608. And again, then we layer in our VP indicators — which are again sitting just below that. That’s going to be 1.3669. And we’ve got again the T-Cross long 1.3669.
So right now we’ve had a pretty strong close: 1.3690. So again, I think longs are reasonable while above 1.3608. I believe we can possibly break down below the T-Cross long or the long predicted in choppy Monday trade.
But again, risk-off does not favor the Canadian dollar, but higher oil prices do. So keep an eye on oil. But again, the Canadian dollar doesn’t have the luxury of riding piggyback to the US dollar economy anymore — or we’re not sure where we’re going with the tariffs. So it could be problematic, to say the least.
U.S. Dollar versus Mexican Peso

Now even if we look at the US Mexican peso here, I believe that the T-Cross long will be challenged next week: 18.79. Watch for a potential break of there.
But the main thing here, guys, is we want to look at all of the forex pairs together and count which ones are above the T-Cross long and which ones are not. So it slightly favors the US dollar going into next week’s trading.
Like I said, between 52% and 62% bullish on the dollar. But remember — the dollar is still in a very significant downtrend.
And again, with the Kiwi — sorry, I think I missed that one — that one is already slipping below the quarterly opening and the T-Cross long at 60.31.
New Zealand Dollar versus U.S. Dollar
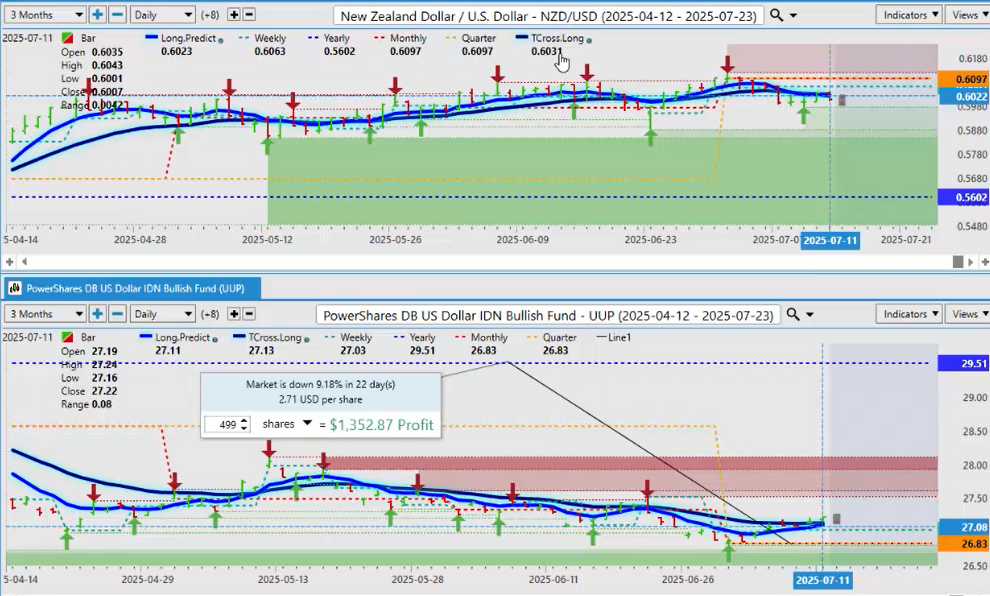
So there’s a number of things pointing to dollar strength coming, but it will be a very choppy week.
So with that said, this is the Vantage Point AI Market Outlook for the week of July the 14th, 2025.