




Welcome to the Artificial Intelligence Outlook for Forex trading.
VIDEO TRANSCRIPT
VantagePoint A.I. Market Outlook
US Dollar ($USDU)
Okay, hello everyone and welcome back.
My name is Greg Firman and this is the Vantage Point AI market outlook for the week of July the 27th, 2026. Now, to get started this week, we’ll begin with uh that very important US dollar, a different way of measuring that US dollar strength using the wisdom tree uh US dollar bull fund, the USDU, a powerful ETF.
Now, in last week’s outlook, I had talked about how we were holding above the TCross long with a bullish signal forming on the US dollar. And of course, we’ve seen the dollar make significant gains against the euro, the British pound, uh even the Aussie, and to some degree the yen. But we’ll look at all of those.
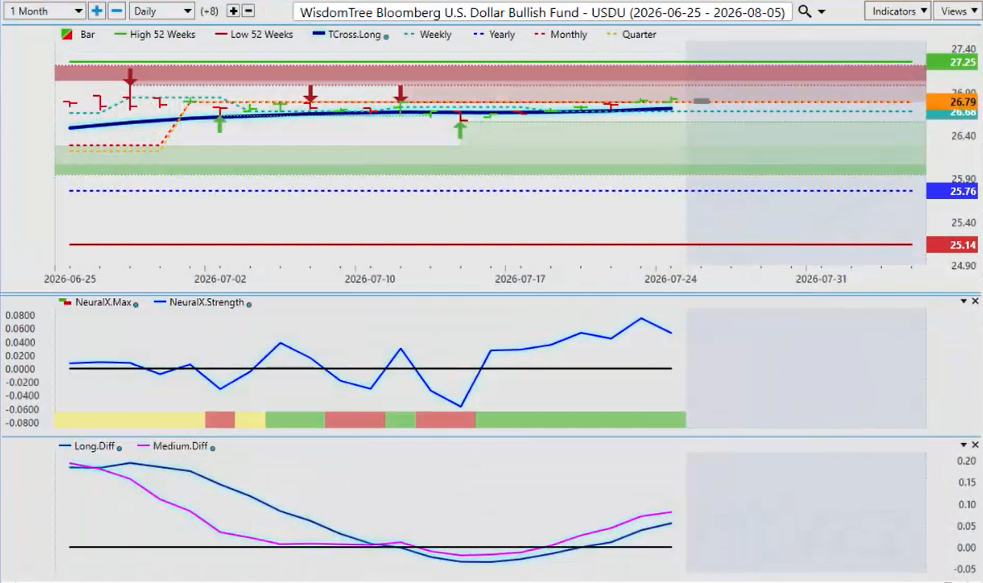
But for now, we can see that we have retaken that monthly and quarterly opening price. We’re above our yearly opening price. The neural index has warned us that we are getting ready to move up on this along with our medium and long-term crossovers.
Now, for next week, the neural index strength is pointing down, possibly a little bit of a down day on Monday, but that would obviously be a buying opportunity uh with everything that is currently happening. Still a lot of rhetoric around the Fed hiking rates, but I I don’t see him hiking anytime in the near future.
But either way, the dollar is supported in in September, mainly September and part part of August. So, this is obviously having a very negative effect on gold, but gold is holding its own this week. Basically running fat flat, more or less flat, excuse me, on the XAUSD, which is basically a gold cash price.
Gold (XAU/USD)
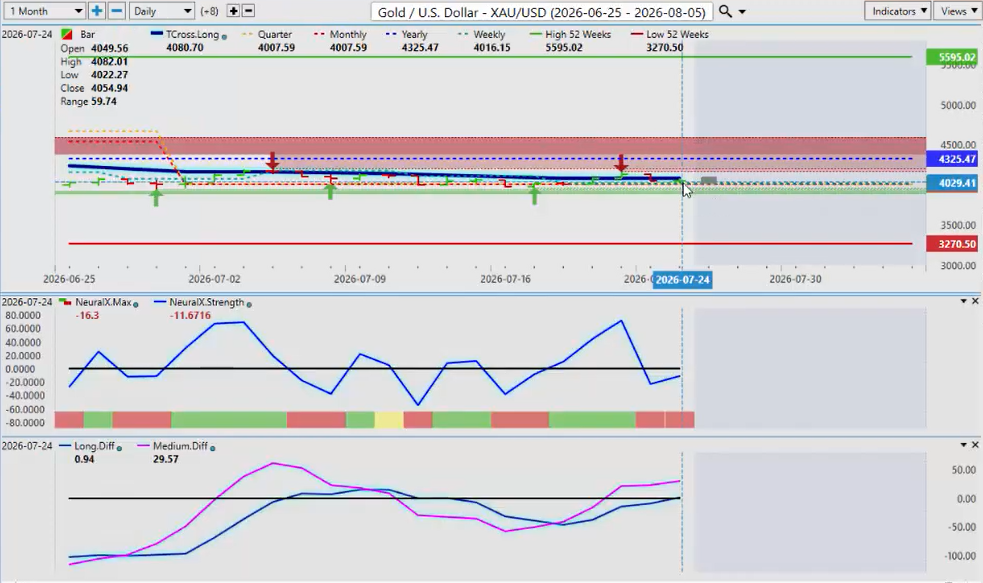
Now, what we do have forming, however, we have a medium-term crossover, but we are below the TCross long. we have a long-term crossover forming to the upside. The question is, can the US dollar and gold both go up at the same time? And the answer is yes, they can.
And that if that something like that were to occur, it would usually be at the very end of the month or the first week of the new month. So, gold is not down and out, but the primary trend has shifted to the downside while below 4325, but the indicators in VP are warning that some gold strength potentially is coming.
Bitcoin
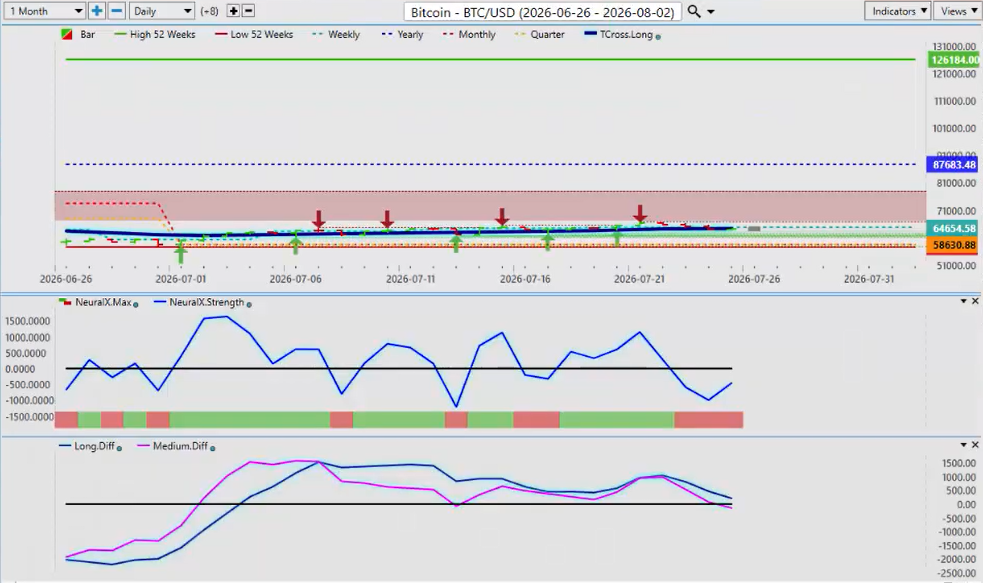
Now when we look at Bitcoin for next week, once again Bitcoin just running sideways here. Uh August is unlikely to be a good month for Bitcoin, but midepptember and October and de November, December of this year and 2027. Uh historically, we’re in we’re in the fourth year, which is a down year.
So three years up, one year down. This is that down year, but we would be moving into a bull market potentially over the next 3 years, which is likely going to start somewhere around midepptember, early October. And that could run, like I said, for 2 3 years.
We’ll still have the up and down years, uh, the up and down weeks and months, excuse me, but the primary trend will shift back up to the upside likely in 2027.
So for now our tross long 64,308 that is the key level. We are net positive uh in the third quarter. However, we’re above 58,630.
That is your critical area to keep your eye on, guys. And I believe there’s still a buying opportunity off that level. But we do have a medium-term to the crossover to the downside. We’re coming into a period of known dollar strength. So again, Bitcoin not likely to fare overly well there.
German DAX ETF (Global X DAX ETF)
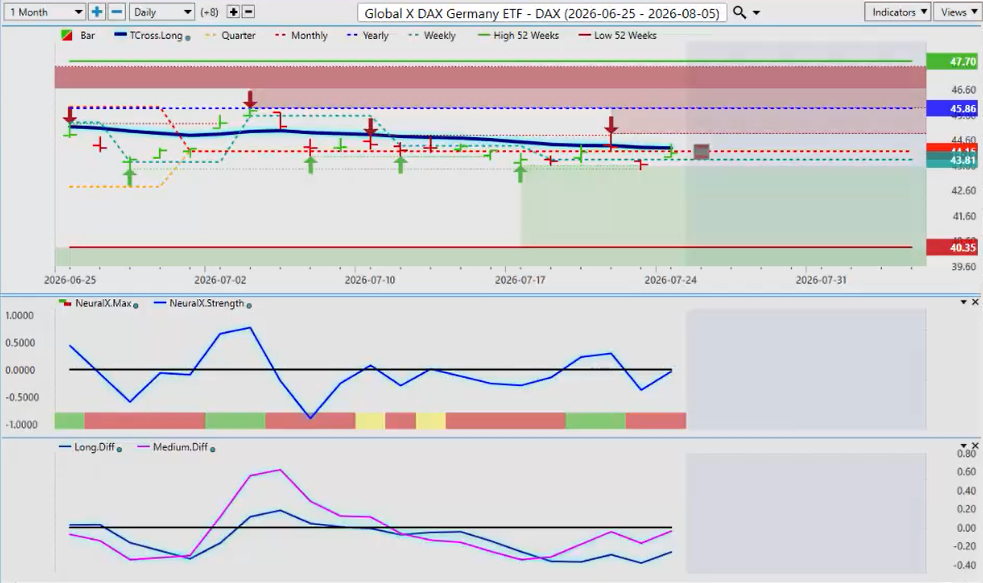
Now, as we look at some of our main equities here, the first one I would be looking at would be, of course, the uh the the German DAX ETF, the the Global X. So, right now, the it’s being somewhat pressured back to the upside, but there’s a very high correlation between Euro US and again that um the the DAX.
So, in and it’s very unlikely the Euro is going to recover next week. So more downward pressure on the DAX is likely while above our T while below excuse me our T cross long 4429 that’s your key level but the really big level here guys 4586 we have to get above that for both the Global X and the DAX futures for them to go higher.
But this particular ETF has been highly accurate in engaging the momentum and strength of of the DAX and the Euro. And you can see we’ve had a pretty significant failure exactly on the calendar yearly opening price where no visible resistance was present. We had a significant failure.
We’ve tried to retrace here but it we keep moving to the downside. So once again uh downward pressure still more likely than not.
Euro versus US Dollar ($EUR/USD)
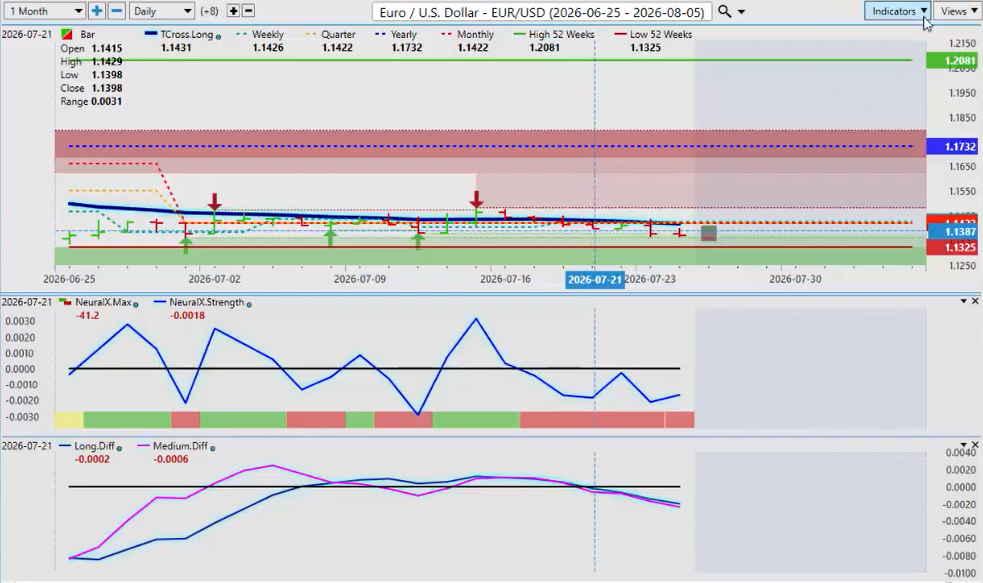
Now with some of our main FX pairs starting with uh again that very important Euro US this week here this past week we’ve been running and and again guys this is why that T cross long or the triple AMA cross somebody did ask if I could show that and the answer is yes of course anything you guys want to see I can show it.
So, it’s a triple EMA cross with the short and medium-term predicted moving average removed. All I’m using is simple predicted moving average. Very easy to get my entry point off that, guys. And very easy to know where to put my buy stops for a reversal.
It would have to be above that important TCross long at 11418.
So what I suspect will happen again with this pair is we’ll move higher on Monday only to get pounded lower Tuesday and Wednesday.
But again uh for the savvy trader can put a buy stop around 11440 11450. Once we clear if we clear this tross long we know we’re going to have a long trade to the upside.
But for the bears 11418 selling into that area is still reasonable.
British Pound versus US Dollar ($GBP/USD)
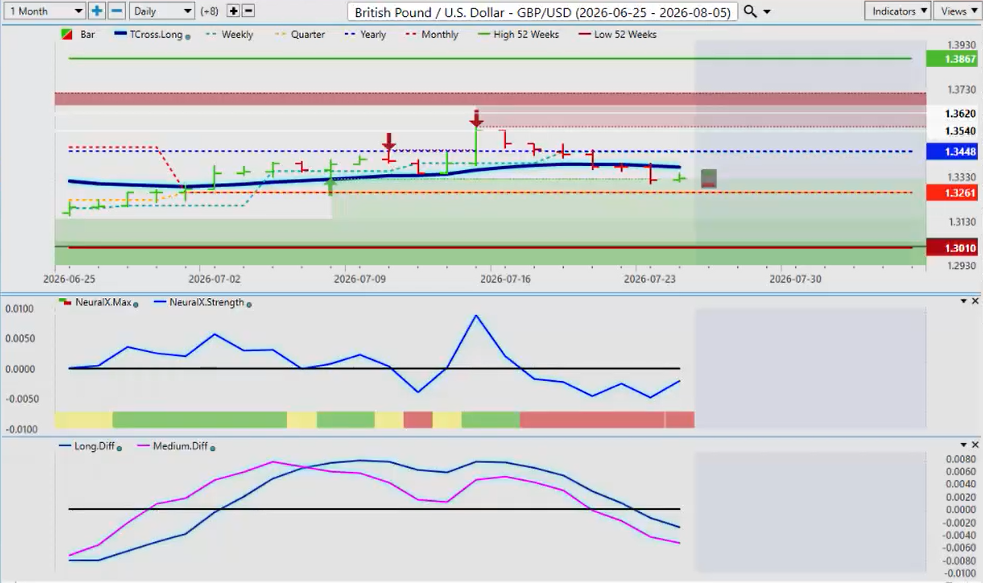
Now, the pound dollar again based on last week’s analysis with the US uh DU. The pound dollar also failing right off the beginning of the week.
I knew it was not going to be well for the British pound this past week. We failed at the yearly opening price. Then on Tuesday, we closed below the tross long and down we went.
So, on a positive side for the bulls, 13261, the quarterly opening price, that’s the level to keep your eye on. And if we can hold above that, well, we could see a potential reversal.
But at the present time, that seems very very unlikely uh for again uh with everything that’s going on in the UK.
Again, a terror attack in Europe this weekend. Uh so it’ll be interesting start to the week to say the least as that manhunt goes on.
Australian Dollar versus US Dollar ($AUD/USD)
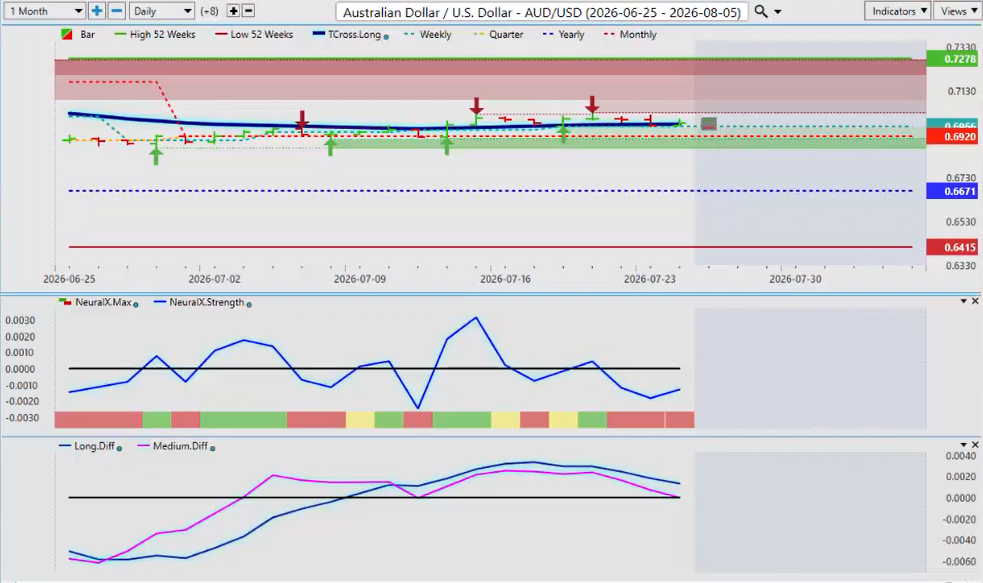
Now, when we look at the US, the Aussie US, the one thing these four main forex pairs have in common, guys, is they’re all trading against the US dollar.
Now, the Aussie is really holding its ground and it does not look like the British pound or the euro US.
The Aussie is above its yearly opening price, meaning the primary trend is up and it’s above the quarterly and monthly opening price.
And on top of that, we’re holding on to that T cross long 6975.
So longs are still reasonable on this pair even if you’re shorting the other two because again it’s a very different economy. Australia is tied very much to China, the Asian trade.
So the very impressive that the Aussie can uh fight off this uh US dollar strength but also if we if we slip below the quarterly opening at 6920 or for this again for the savvy trader who knows his levels or here are levels you can put a sell stop below 6920 because I guarantee you well nothing’s a guarantee in trading but this is pretty pretty darn close is that if we break down below that quarterly opening then we could be targeting 6671 because Australia usually doesn’t do very well in in the month of September or the month of August.
US Dollar versus Japanese Yen ($USD/JPY)
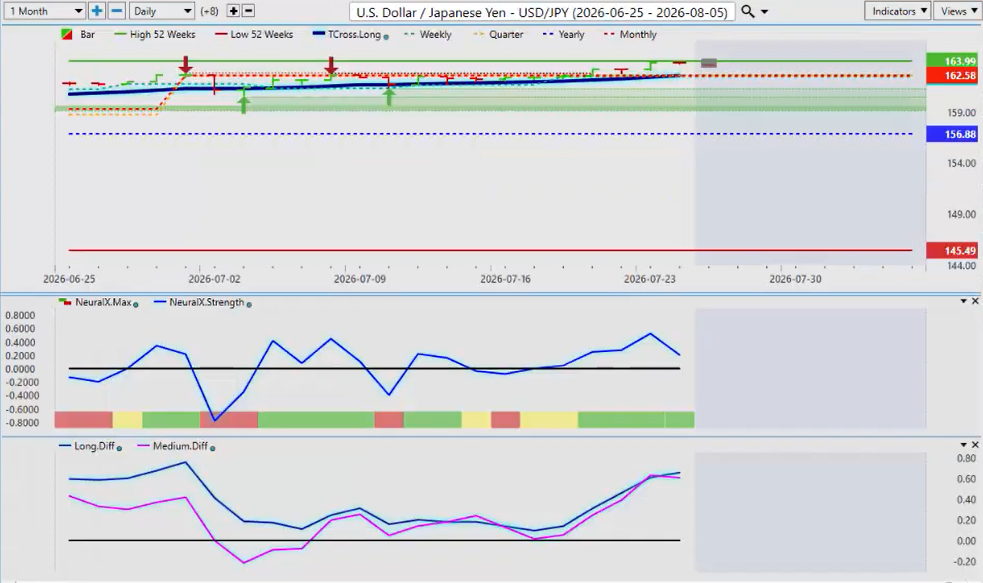
Now again the dollar yen the dollar yen a lot of rhetoric with the Bank of Japan but nobody’s listening to them. Uh they’ve lost their credibility like the Swiss National Bank.
So again, we’re still rising, but it’s hard for me to even comprehend closing the week at 16 almost at 164 again.
So again, the dollar is in complete control, but always remember at any time the Bank of Japan could intervene and force this thing lower.
So be very careful.
And I will warn everybody, there is an MA diff cross in grossly overextended at a grossly overextended level. It’s been quite a while since I’ve seen an MA diff cross up at this height.
So again, that pink line over the blue line is warning us to be very very cautious going into next week with longs.
But if I am going to buy this, then it’s very easy to pinpoint where that is guys. The tcross long 16255, the quarterly opening 16258.
I would not even consider a long until it gets to that particular level and then reassess the conditions at that particular time.
Barclays (BCS)
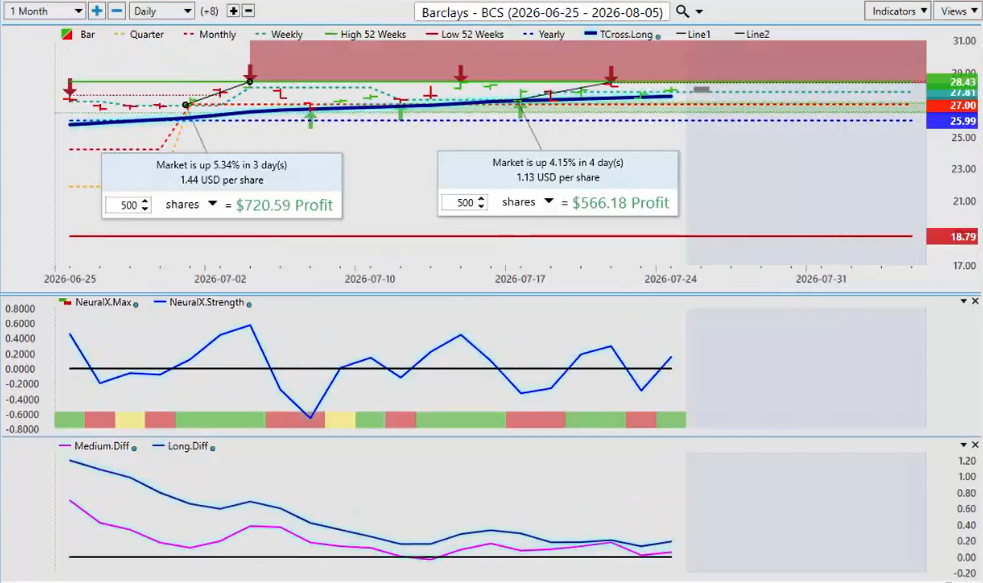
Now, just a quick look at a couple of stocks for this coming week because once again, I believe a stock and an ETF is a reasonable play.
Now, Barclays has made the list here this month. This is a new addition to the AI Weekly Outlook, making it more balanced with a few forex pairs, some ETFs, some commodities, and some individual stocks.
So, Barclays has been running along VantagePoint’s T Cross Long all week and now we have another fresh buy signal.
Last week after the recommendation, we can see we rose right up to just over 4% on the stock for the week. Very nice trade that was suggested before the market open, just like this video right now.
You can see this video is being done at 1:00 on Sunday afternoon while the markets are closed. Last weekend’s was done on Saturday around 1:00 because again guys, this is an outlook, not a recap of something that’s already occurred. There’s very little value in that.
We want to make sure we’re looking forward, not backwards.
So again, the stock has retraced exactly back to the T Cross Long for a secondary time. And I believe you have potentially a third trade with this stock.
As long as we’re holding above the T Cross Long and the quarterly, I think we can make one more run at that. So it will make the cut for next week’s trading.
You can see we didn’t get a medium-term cross to the downside. The Neural Index has flipped.
And for anybody that’s an advocate for candlestick patterns, which I’m not, there are certain predictive candlestick patterns in the Heikin Ashi candlesticks inside the VantagePoint software that are highly effective.
Based around Heikin Ashi, I can tell you there is a fresh buy signal again forming off the exact same level, guys.
So again, it makes the grade.
SPDR Portfolio S&P 500 High Dividend ETF (SPYD)
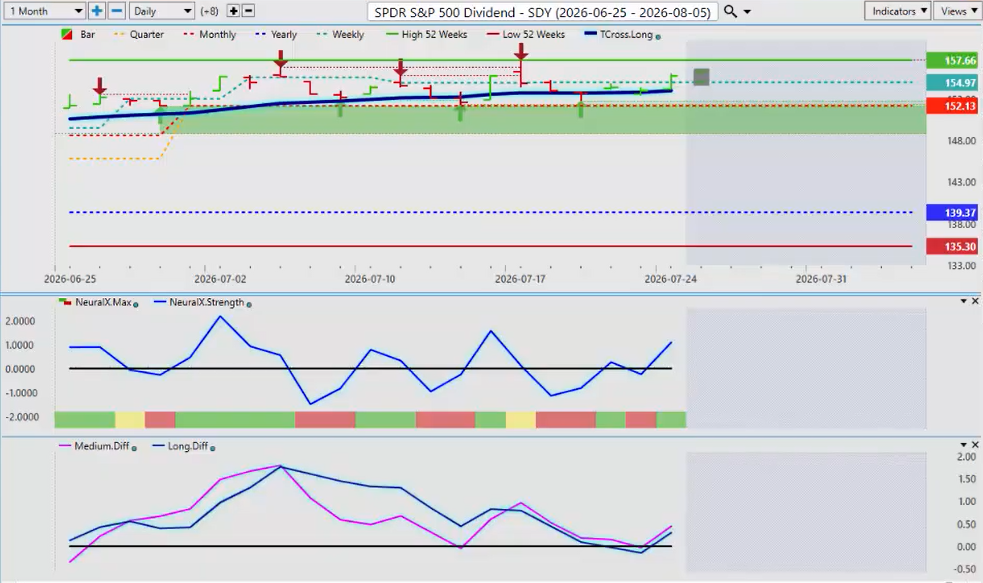
Now on the ETF side, and this is another way of looking at the S&P 500 or the US equity markets, the SPYD, the SPDR Portfolio S&P 500 High Dividend ETF.
So, right now, we’ve made a nice move, made a new 52-week high, and we’ve had a natural retracement back down to the T Cross Long.
But you can see we didn’t close below it.
And now we’ve gone sideways for two days, and we’re starting to move up yet again.
So, the T Cross Long there, 15392. That’s a reasonable entry.
The primary trend is clearly up.
We’re above the yearly opening price at 13937 and we’re above the third quarter opening price at 15213.
Then again we have our T Cross Long coming in at 15392.
So I’d be looking for a little bit of a pullback on Monday or Tuesday and pick this one up potentially long again.
Black Hills Corporation (BKH)
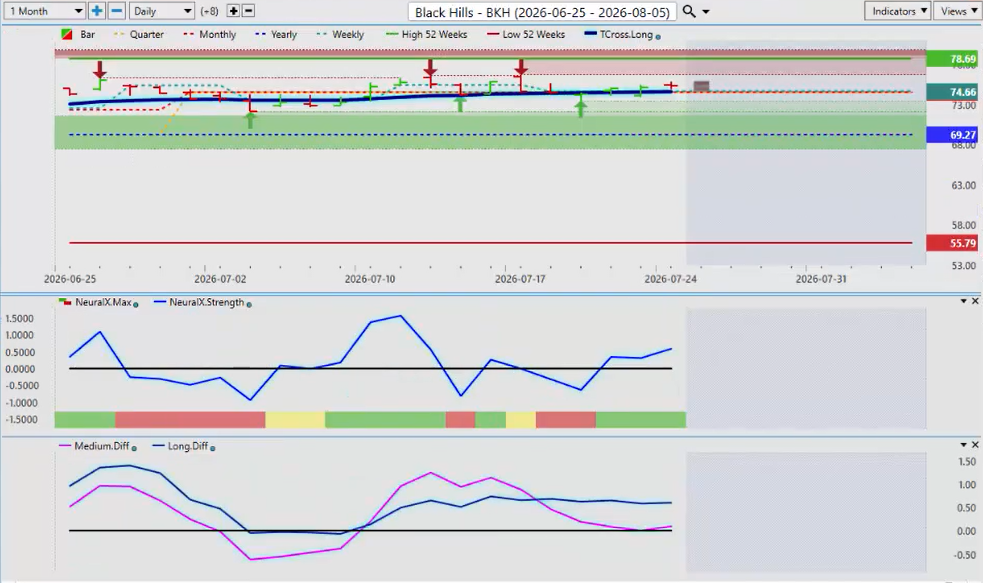
Now a little bit of a hedge bet here on the utility side would be the BKH.
So this particular stock, as you can see, looks very similar to some of the other ones.
So if the stock market is struggling, then we may have a decent trade here.
So right now, our indicators are turning back up to the upside. Our medium-term and long-term predicted differences.
Again, this is a corrective move, guys.
The pink line over the blue line while the market is above the T Cross Long is corrective in nature, not a new trend.
Right?
So the crossover to the downside did not complete here and we’re starting to bounce back up.
So a reasonable entry, the T Cross Long 7466.
Nothing wrong with that with an entry point there whatsoever.
So once again, a more balanced AI outlook.
I always enjoy your feedback.
Please do feel free to put anything into the queue that you would like to see in the future or any variations because I’m certainly open to forecast anything using a very powerful software like the VantagePoint software.
So with that said, this is the VantagePoint AI Weekly Outlook for the week of July the 27th, 2026.