Welcome to the Artificial Intelligence Outlook for Forex trading.
Okay, hello everyone, and welcome back.
My name is Greg Firman, and this is the Vantage Point AI market outlook for the week of July the 7th, 2025.
PowerShares DB US Dollar IDN Bullish Fund ($UUP)
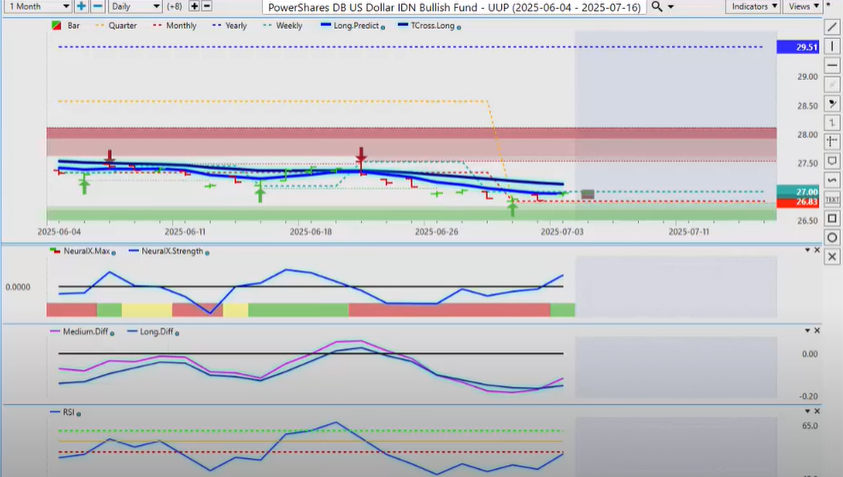
Now, to get started this week, we’ll begin with the dollar index UUP ETF fund. Now, there is a corrective buy signal on the dollar, but at the current time, that’s all it really is.
Now with the tariffs coming into play, Iran talks are really breaking down to some degree. It is somewhat of a risk-off environment building here. So, the signal we can see with Vantage Point—the one positive that the dollar has going for it—is it’s above its monthly opening price, 26.83.
Now, the problem is that, again, we are firmly negative on the year, but—and there is a fairly large “but” coming here—the dollar usually fares better in its fiscal fourth quarter. So again, that would be leading into July, August, and September, and then October.
So, I don’t think there’s going to be a big upside move in the dollar this coming week, but there could be some further corrective move. Again, we’re firmly below its current yearly opening price, but the indicators in Vantage Point are bullish. But unless we can clear that TCROSS long at 27.13, very little has changed in the primary trend in the dollar.
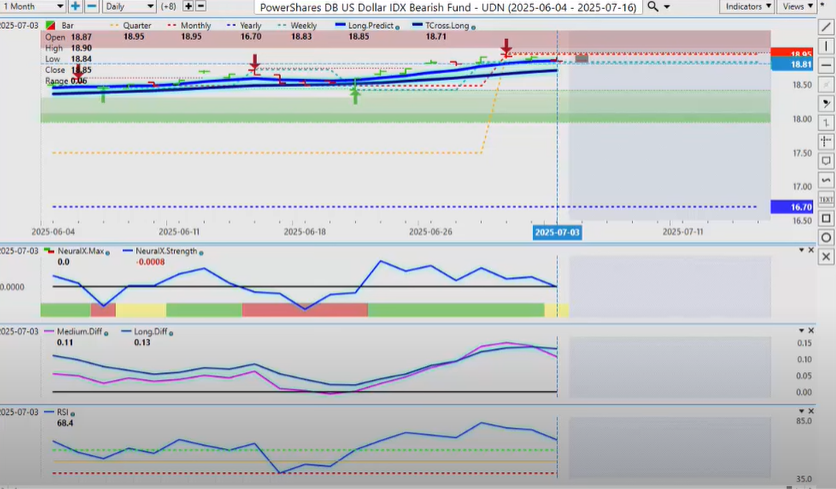
Now, the UDN—the dollar bear fund—you can see the inverse signal here pointing to the downside, but that too would be corrective in nature unless we can break 18.71.
So again, what we really want to know is we want to understand our levels—what they are. So, we’re below the monthly opening price, but we’re still above the calendar yearly opening price and, more specifically, the TCross long.
So, it is pointing that the bear fund is going to move lower for part of this coming week. But, in my respectful opinion only, that is simply corrective in nature at the current time.
Gold
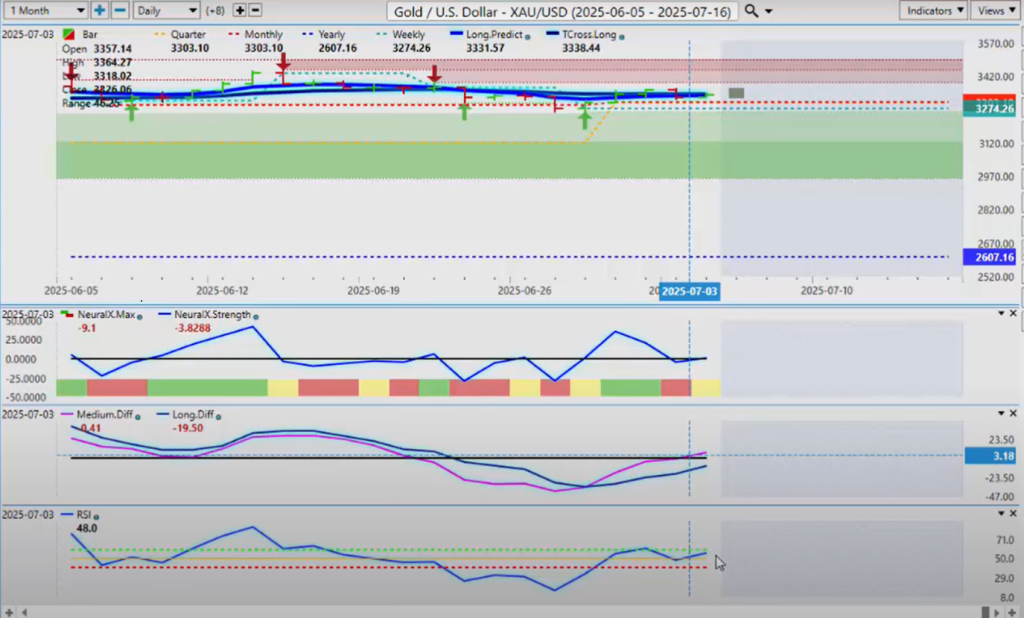
Now, when we do a comparative analysis to gold, we can see that gold here is firmly above its yearly opening price. That level is 3303.
Now, we could see some downward pressure on this if we see additional U.S. dollar strength, but that would be very unlikely here, guys. When we look at XAUSD—this applies to gold futures, gold stocks—we do have a fresh medium-term crossover. We can see the MA diff cross has broken the zero line. The long term is still down, but again, we’ve got momentum building with the predicted RSI.
And as long as we’re holding above the new quarterly and monthly opening price, then gold remains very bullish.
So again, a little bit of dollar strength for the first couple of days of the new week, and then that’s likely going to push gold down a bit, but that would be a buying opportunity.
SPDR SPY ETF ($SPY)
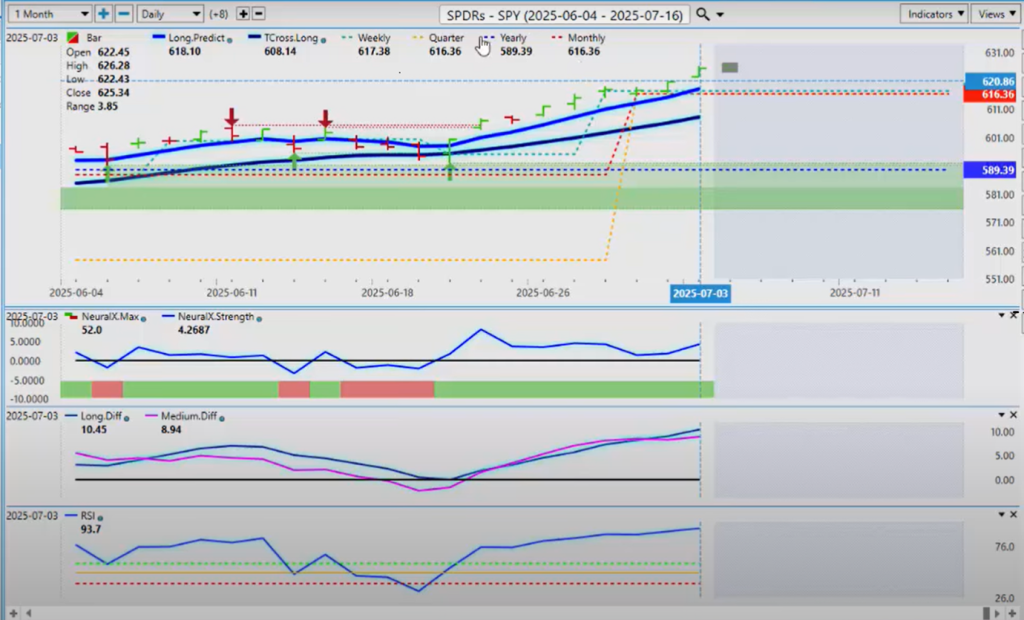
Now, with the stock market—this particular house of cards—I’m not sure how much longer we can extend higher here. There are a number of different things on the fundamentals that are on the table that could push stocks lower, but we also don’t want to fight the trend.
So, for now, our monthly opening price—which is also our new quarterly opening price (very important that I point that out)—is 6163.6. As long as we can stay above that, there is still a bullish tone, even at these all-time new highs.
But I will remind everybody: last time we got up into these all-time highs, there was a significant corrective move—about a 6% drop, I believe. So, be careful with this one. We do have an MA diff cross—the pink line over the blue line.
Now, structurally, this setup means the medium-term trend is weaker than the longer-term uptrend. So again, we could see a corrective move coming.
The predicted RSI has been in overbought territory for a considerable period of time, and we can assess here that the market continues to extend higher. When we look at that neural index staying above the zero line—the neural index strength—we’re not seeing any real selling on this.
So, is this the week when we do? Well, I think the fundamentals of the Iran-Israeli war and the Trump tariffs will play into that. But the market is really banking on Fed rate cuts coming. And while they aren’t necessarily wrong, rate cuts alone are not enough to continue to prop these equity markets up.
So, be cautious with this, but be very mindful of that Tcross long at 608, and the monthly opening price at 16163.6.
Volatility Index ($VIX)
Now, when I’m looking at this, I also want to make sure that I’m looking at the VIX and how this plays into everything.
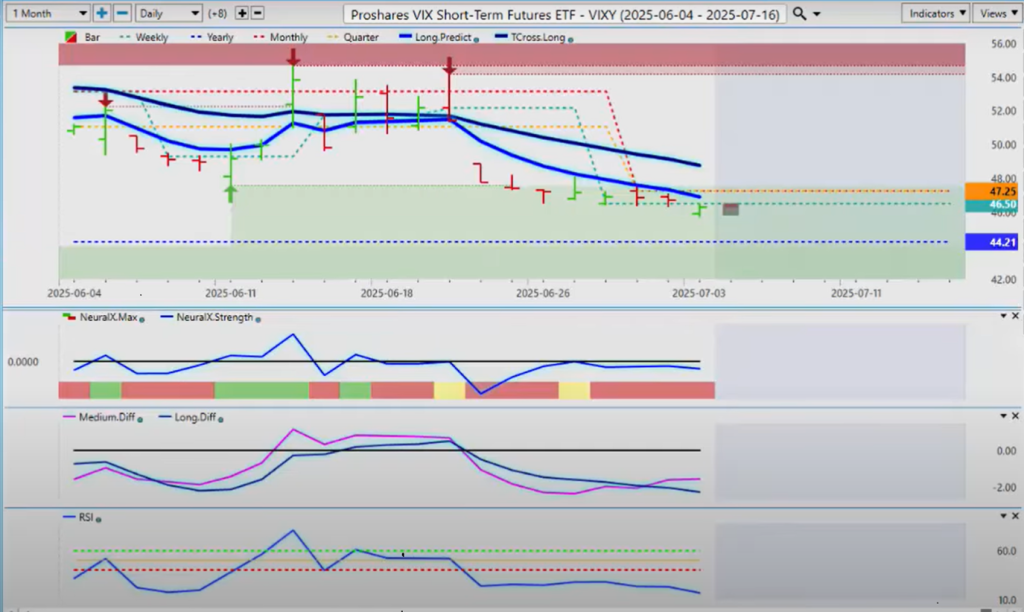
Now, the VIX ETF, the VIXY, remains positive on the calendar year, but we’re below the monthly and the quarterly opening.
We’re below our Vantage Point long predicted and our TCross long. So, the VIX does have a bearish tone to it, but again,
the primary trend on the VIX—on this short-term VIX futures—is still up until we break down below 44.21, if we do.
And I will point out—we have a clear corrective move in progress here—the pink line crossing over the blue line.
So, this pink line represents the medium-term trend. The dark-colored blue line is the longer-term trend.
And this is inverted—suggesting we are going to get a corrective move up on this particular short-term VIX futures.
So again, be mindful of that.
But the 47.25, the new quarterly opening—that is the area you really want to keep your eyes on, guys,
to see if we can get back above that. And for now, the neural index still is below the zero line.
So again, there isn’t a lot of upward momentum on this particular ETF.
DAX
Now, when we’re looking at global equities too, we also want to make sure we’re taking a very close look at the DAX.
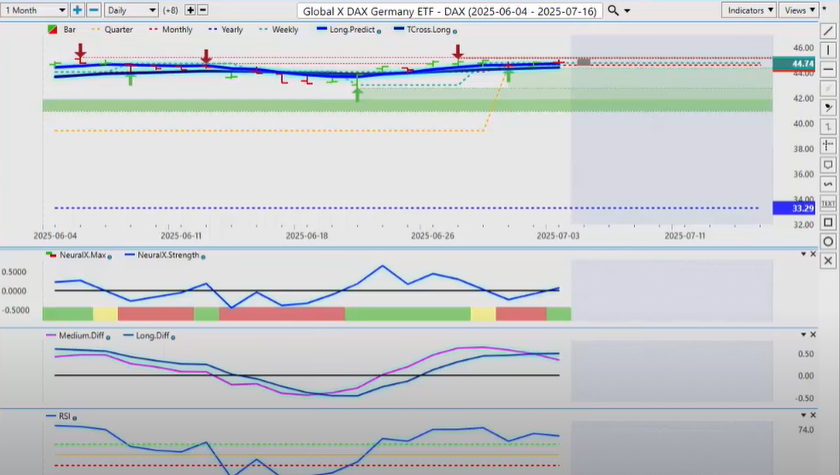
So the global XDAX view ETF—a very, very good way to trade the DAX or get a feel for it. So, we are positive on the year.
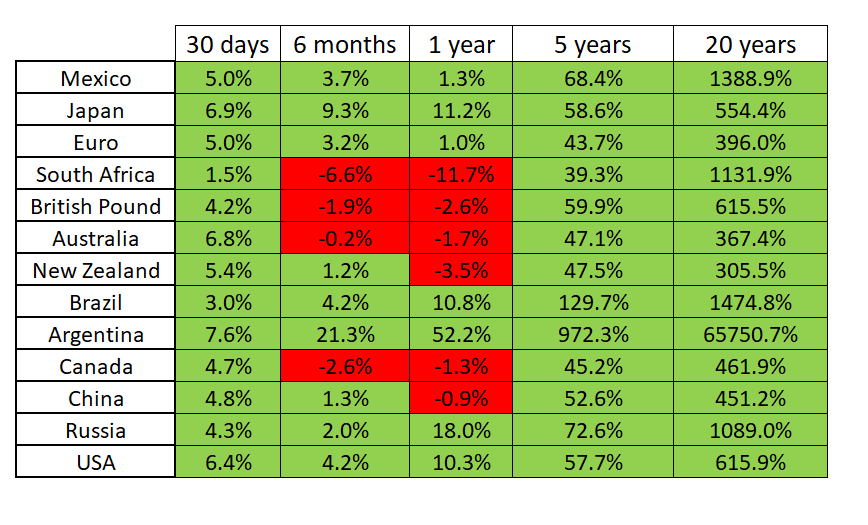
This has been a very, very strong market here. And just to remind everybody—proper performance should always be measured off of that current calendar yearly opening price so we know exactly where we are in the year.
So right now, the DAX is grossly outperforming the NASDAQ and the S&P 500 by 34.46%.
Now, when we’re looking at global equities too, we also want to make sure we’re taking a very close look at the DAX.
So the global XDAX view ETF—a very, very good way to trade the DAX or get a feel for it. So, we are positive on the year.
This has been a very, very strong market here. And just to remind everybody—proper performance should always be measured off of that current calendar yearly opening price so we know exactly where we are in the year.
So right now, the DAX is grossly outperforming the NASDAQ and the S&P 500 by 34.46%.
Now, this is a mixed bag going into next week. The neural index strength looks pretty good.
The predicted RSI looks pretty good. We’re above the monthly and the quarterly opening and the Vantage Point Tross long—
that level coming in at 4436.
The problem—slight problem here, guys—is this: the pink line again, the medium-term trend (which is clearly—
and the long-term trend is clearly up)—but you can see that medium-term trend is losing momentum here.
So, I think a corrective move is in the works here, back to at least the Tross long.
If we can hold above that, then longs are still more than reasonable.
Bitcoin
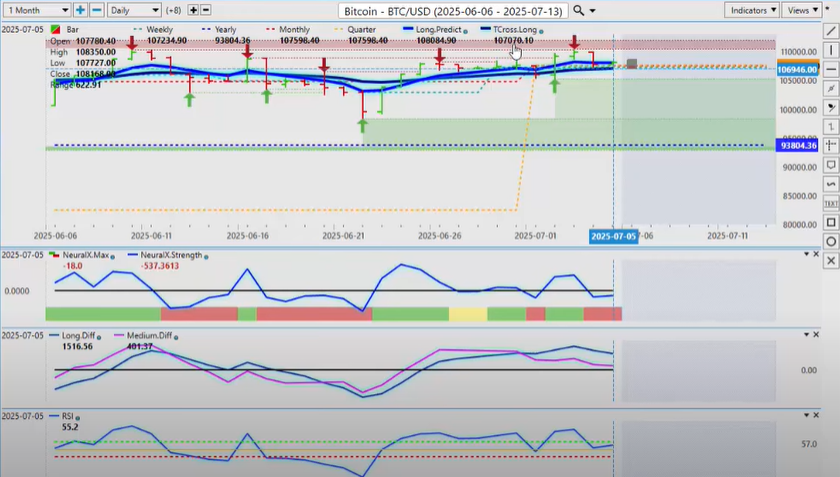
Now, when we look at Bitcoin going into next week, Bitcoin is edging closer to September, where I’m confident it will have a very good September and October.
So right now, we’ve had a big push this past week, but just very little momentum to keep it up above 110,000. So for next week, our TCross long—107070—that is the critical level.
But remember the new quarterly opening—measure things on a year-to-date basis, on a month-to-month, even the weekly calendar weekly opening price. It is very, very important to me to see if the bulls or the bears are in control here.
But starting a new quarter—that is very important. So, 107598—we need to hold above that level for Bitcoin to remain bullish, but I suspect we’re going to have a deeper pullback first before we get that really much bigger rally into mid-August through mid-October.
United States Oil ($USO)
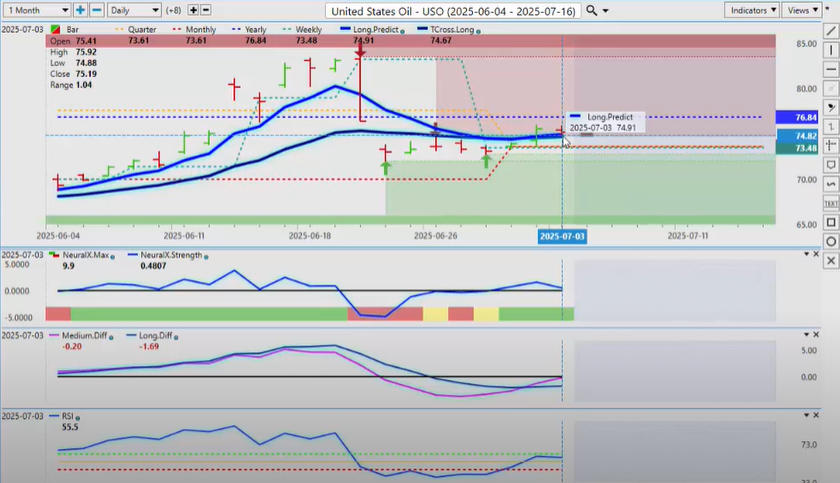
Now, with oil prices—again, oil prices taking a rebound this week. Currently, guys, we’re going to be trapped between the Vantage Point Tcross long, which is coming in at 74.67, the quarterly opening price—that is 73.61—and the calendar yearly opening price, 76.84.
So again, we’re probably going to go back and forth between the quarterly opening and the yearly opening,
but we’re looking for a break of either the calendar yearly opening or the new quarterly opening to gauge momentum in the market.
The indicators in VP are suggesting, with that MA diff cross, that oil will move higher.
So again, be very cautious around 76.84, but if we can break through that level,
we should be able to return back to the 85 level before the end of summer—potentially before the end of July.
So on the main mark, that covers our main markets. Now let’s look at some of our main forex pairs going into next week.
Euro versus U.S. Dollar ($EUR/USD)
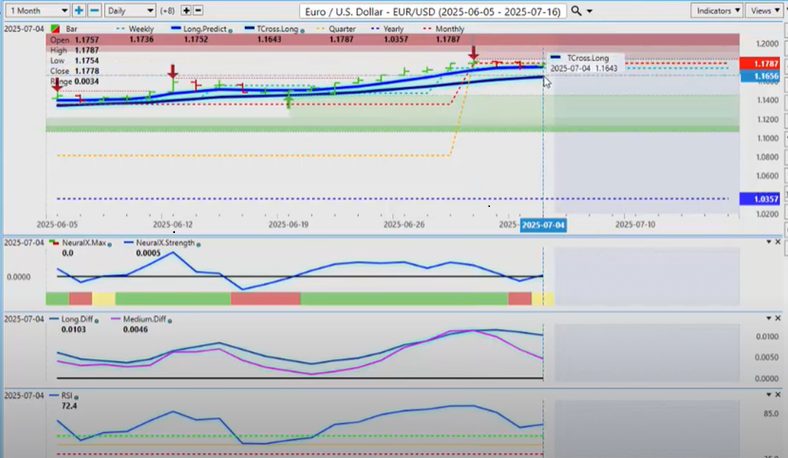
I believe all eyes will be on Euro US. So currently, with the Euro US, the VP indicators were dead on this past week—there was simply no momentum.
Now, the euro responded softly, I would say, to that slightly better payroll number out of the US on Friday, but when you scratch the surface of that and look underneath, the payroll number was just okay. It wasn’t great.
Is that going to be enough for the Fed to cut rates or hold? I believe he’s going to hold until September.
So, that should put additional pressure back on the US dollar—at least for July.
So, probably a push to the downside Monday, Tuesday, and then Wednesday we start to recover.
So, as long as we’re above the Vantage Point TCROSS long, that’s our corrective area—1.1643.
That would be a premium long at that particular price because, again, the indicators in VP are not suggesting a new downtrend in the euro.
They’re simply saying it’s a corrective move lower, which is consistent with the period of known US dollar strength at the beginning of the month.
U.S. Dollar versus Swiss Franc ($USD/CHF)
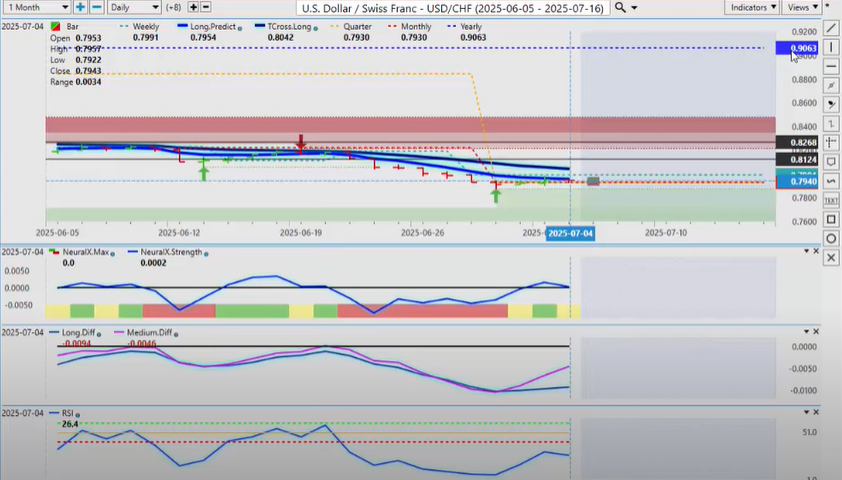
Now, the counter to Euro US would of course be US Swiss Franc.
Now, with the US Swiss Franc pair, it has pushed up a little bit higher this week, but we just can’t get any momentum here.
So, the monthly opening price here—0.7930—that’s the one to keep an eye on whenever you’re trading, guys, or investing.
The easiest way to make a determination in the month whether the bulls or bears are in control is if you take the calendar monthly opening price of that particular month.
Don’t co-mingle months together. Say, “Okay, well, this is what it did in June, so this is what’s going to happen in July.”
No, guys—June and July couldn’t be more polar opposite in their trading months.
So, right now, this is still suggesting the dollar is under pressure, and any move to the upside is a selling opportunity.
So, our TCROSS long there is coming in at 0.8042. That would be the area potentially for shorts.
So, the monthly opening price here—0.7930—that’s the one to keep an eye on whenever you’re trading, guys, or investing.
The easiest way to make a determination in the month whether the bulls or bears are in control is if you take the calendar monthly opening price of that particular month.
Don’t co-mingle months together. Say, “Okay, well, this is what it did in June, so this is what’s going to happen in July.”
No, guys—June and July couldn’t be more polar opposite in their trading months.
So, right now, this is still suggesting the dollar is under pressure, and any move to the upside is a selling opportunity.
So, our TORS long there is coming in at 0.8042. That would be the area potentially for shorts.
Now, another alternative strategy you can do is put a buy stop order above 0.8042 and a sell stop order below the monthly opening price at 0.7930 and see which one breaks. That way it doesn’t really matter here, guys. You win either way, right?
But for now, I believe this to be just corrective in nature.
British Pound versus U.S. Dollar ($GBP/USD)
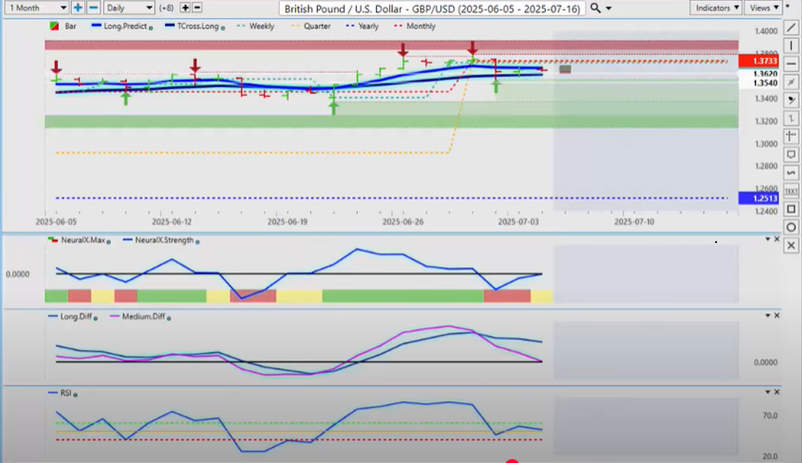
The British pound US dollar didn’t fare too well this past week. But again, as I’ve talked about this for many years now on these VP outlooks, there is a period of known US dollar strength at the end of the month into the first week of the new month.
Usually, the dollar sells off by Wednesday—Tuesday, Wednesday—after the non-farm payroll number. Is this payroll number enough to boost the US dollar? I don’t think it is, to be perfectly blunt. But again, I could be wrong. It was not as great of a report as maybe some would say. So, there’s that risk the pound could reverse back to the upside.
Our Tcross long—1.3614—keep a very, very close eye on that. If that level holds, we go back up to our current monthly opening price at 1.3733, and potentially we could break.
Now again, the MA diff cross is pointing down, but we have little to no momentum on the predicted RSI.
U.S. Dollar versus Japanese Yen
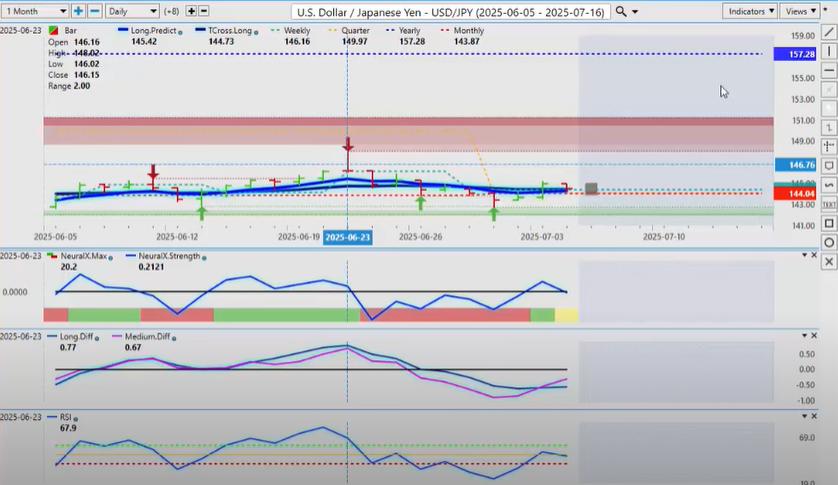
Now, with the dollar yen going into next week, I believe selling the dollar yen will be the reasonable play.
We have a verified resistance high—148.02. That is a critical resistance point.
Shorts into that area, I think, will work very well with the primary trend clearly down—opening up the current calendar year at 157.28.
We are well below that. The Japanese yen is doing just fine this year.
It’s the carry trade that clearly is in jeopardy here, meaning the interest rate changes between the Bank of Japan and the US Federal Reserve.
So keep an eye on those right now.
But it’s a very mixed signal. I believe we go up for a day or two on the dollar yen,
but if we have a big rally on Monday on the dollar yen, then Tuesday is your day to sell, guys.
So keep an eye on that. Very, very mixed bag on the indicators, but again, the primary trend is clearly down.
U.S. Dollar versus Canadian Dollar ($USD/CAD)
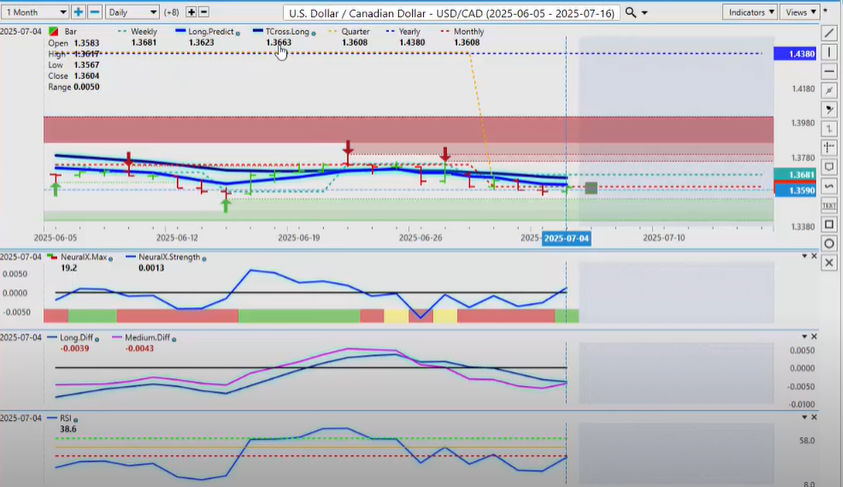
Now, with the US Canadian pair—very, very high correlation to the equity markets and oil.
So what we’re looking for here is oil to extend and equities to extend,
but I believe both could be in a little bit of trouble this month, but we shall see.
But for now, the key thing, guys—know your levels. TCross long 1.3663.
That’s the level that needs to hold on the upside. If it can’t hold, then we are going to break higher on dollar strength.
So again, our neural index is turning up. It looks like an MA diff cross is trying to form here.
If that pink line does cross over the blue line, that’s a huge warning sign that we are potentially getting ready
to move back into the 1.37, 1.38—maybe even the 1.39 area.
Certainly, looking at the Canadian economy, that is entirely possible.
So, we’ll watch our indicators, but as you can see also, the predicted RSI is coming up from oversold territory.
The trick with an RSI—whether predicted or otherwise—is not buying because it’s oversold,
but buying when it’s coming up from oversold and breaking the 50 and the 60 level. That’s trading momentum.
We are in a momentum-based environment in all market conditions here, guys.
So if that predicted RSI can break above the 50, chances are the Tcross long will succumb to dollar strength.
Australian Dollar versus U.S. Dollar ($AUD/USD)
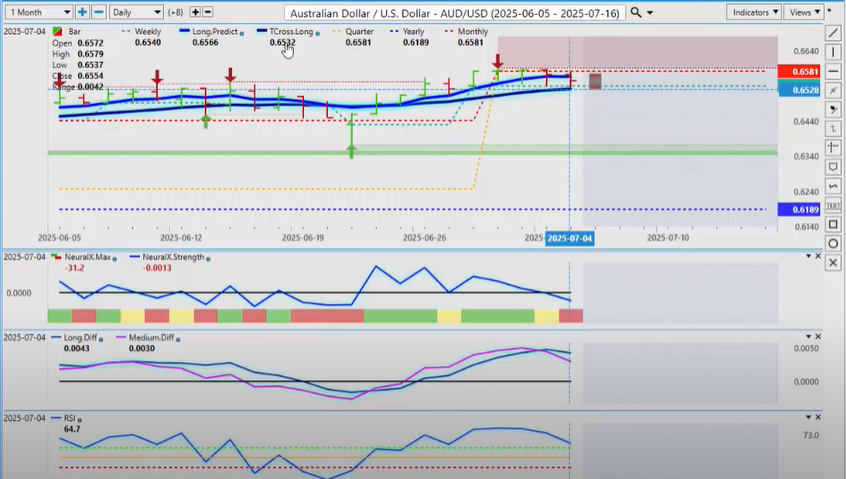
Now, with the pound—or excuse me—with Aussie US next week, Aussie and the Kiwi are basically the same trade as the CAD.
If CAD breaks to the upside, Aussie US and New Zealand US are likely going to push to the downside,
meaning that the dollar is strengthening, the equity markets are in trouble, and gold’s going higher.
They’re moving out of risk-based assets like the Aussie, the Kiwi, and the CAD.
So, for now, we’re holding above our TCROSS long, but these indicators in VP are warning of a potential breach of that TCross long at 0.6532.
So, that is the line in the sand here, guys.
Okay—and again, another way, two ways you can play this: when you know your levels,
you can put a buy stop at 0.6532, but you can also have a sell stop below 0.6532 if it breaks,
and then we look for a run down lower—say maybe 80, 90, maybe even 150 pips on the week potentially.
But the main thing is—can we hold above this level? If we do, then the Aussie’s primary trend will remain in place,
which is clearly to the upside. And the Kiwi, the same trade here, guys. Absolutely the same trade.
New Zealand Dollar versus U.S. Dollar ($NZD/USD)
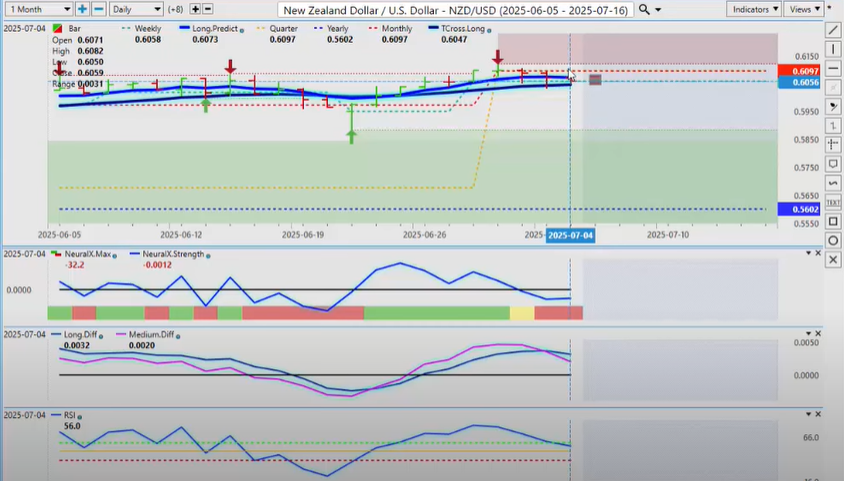
And you can see the Kiwi is being pressured. Now, we’re underneath our monthly and quarterly openings.
So, to start the quarter—very easy to determine again—I don’t want to co-mingle my months.
I’m starting a brand-new quarter. We are starting a brand-new quarter here, guys.
So right now, the indisputable fact is this is bearish because we can’t close above the new monthly and quarterly opening price.
But on the overall primary trend on the year, I would absolutely agree it’s up. We opened the year at 0.5602,
but we have a significant gap between where we are now and that calendar yearly opening price.
And the only thing holding it up currently is that Vantage Point TCross long, which comes in at 0.6047.
So I am confident there will be no shortage of volatility again next week, guys.
But with that will definitely come opportunity—provided we know our critical levels.
So, with that said, this is the Vantage Point AI market outlook for the week of July the 7th, 2025.