


Welcome to the Artificial Intelligence Outlook for Forex trading.
VIDEO TRANSCRIPT
Okay, hello everyone and welcome back. My name is Greg Firman, and this is the Vantage Point AI Market Outlook for the week of June the 16th, 2025.
PowerShares US Dollar IDN Bullish Fund
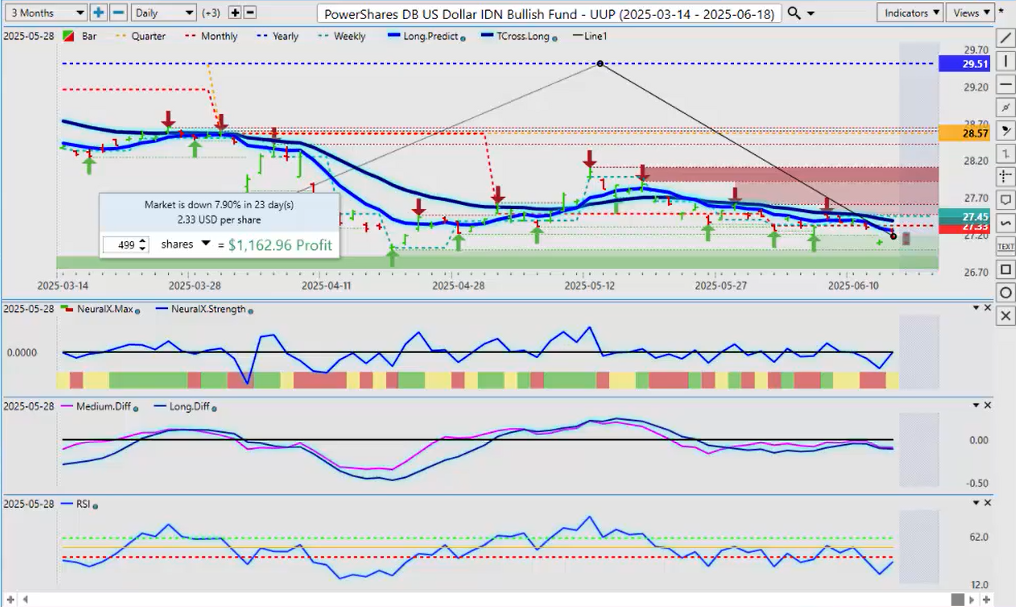
Now, to get started, this week we’ll begin with the US dollar — uh, bull and bear funds on the ETF, ETF side to measure performance of the US dollar. Now, there will be no shortage of volatility coming up next week as the war between Iran and Israel escalates.
So let’s see where the dollar is currently at. The bull fund, the UUP, has been grossly negative on the year, down 7.9%, which mirrors the dollar index. Now, we could see some dollar strength on a risk-off scenario coming into the market. But for now, again, we remain below the monthly opening price, below the yearly opening price, the quarterly at 28.57 — so a very bearish picture building on the dollar index.
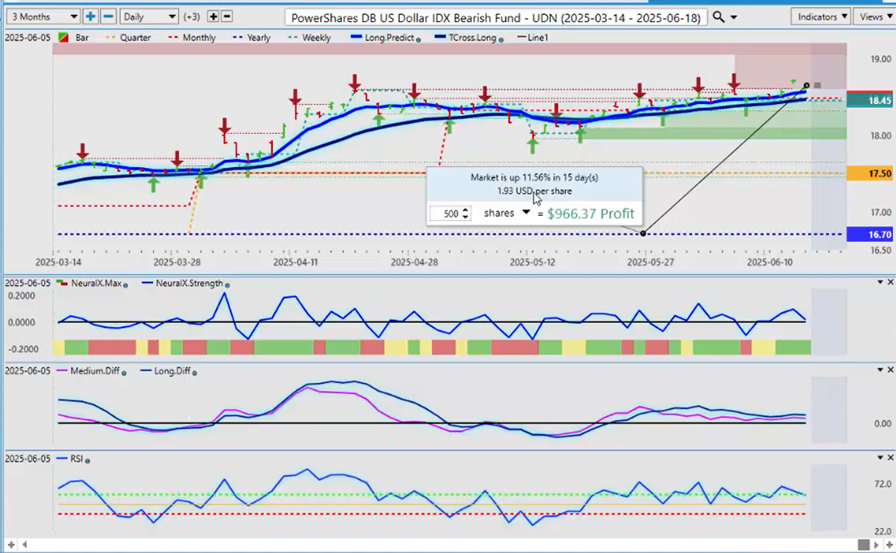
Now, you can see that from the UDN, the dollar bear fund. It remains net positive on the year, up 11.56%. Now, the key levels to watch here in this coming week are that T-cross long and the long predicted that starts at 18.56 and goes down to 18.46. These are the two key levels.
Now, our monthly opening price is also sitting right there at 18.48. The bear fund, the UDN, this trend will remain intact, providing we can hold above those critical VP levels.
SPY SPDR ETF ($SPY)
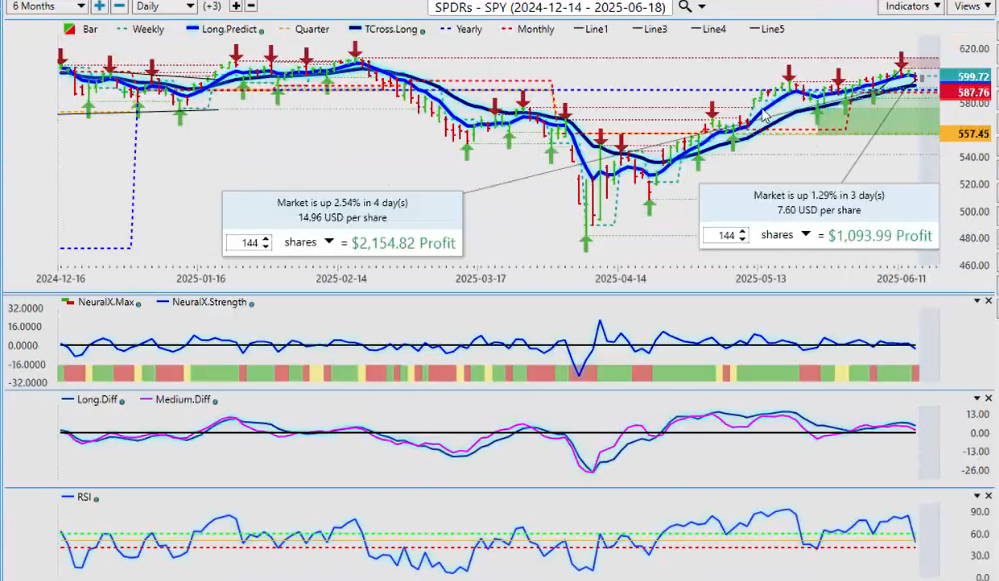
Now, when we look at the SPY, a little bit of confusion, I think, around the actual real performance of the SPY. We’re up a mere 1.29%. At best, this week we’ve been 2.54%, not 3.25%.
When we look at the SPY on the calendar year, it’s actually a very bearish picture. The last time we saw over a 3% gain on the SPY was all the way back in February of this calendar year. And then when we hit just over that 3% mark, we had a significant failure, breaking down below the yearly opening price.
We’re now retracing back up, but we’ve made a lower high — that coming in at 6.05. But again, measuring performance accurately is very, very important. Not using a rolling performance model like an annual basis — annually from where we were last year carries very little relevance. A random 30 days? No guys.
The current monthly opening price is what we would look for. So that level is 587.76. The calendar yearly opening price on the SPY, that would come in at or about 589.39. The probability that we hit that level next week is very high.
Now, if things settle down — which doesn’t look like they’re going to right now — if things settle down between Iran and Israel, then you could have a relief rally. So you always have to be mindful of that. But looking at the accurate performance of the SPY this year, it’s largely followed the dollar index up and down. Just wanting to point that out.
Again, real performance or accurate performance on a year-to-date basis and a monthly basis using the current calendar month is critical to your success — or understanding what the real trend is.
So as you can see, we’ve only managed to retake the yearly opening price back here on May the 19th, and we’ve really been struggling to hold above this particular area. And now, with potentially a global risk-off environment coming in, that is not going to benefit any of the indexes.
$DAX
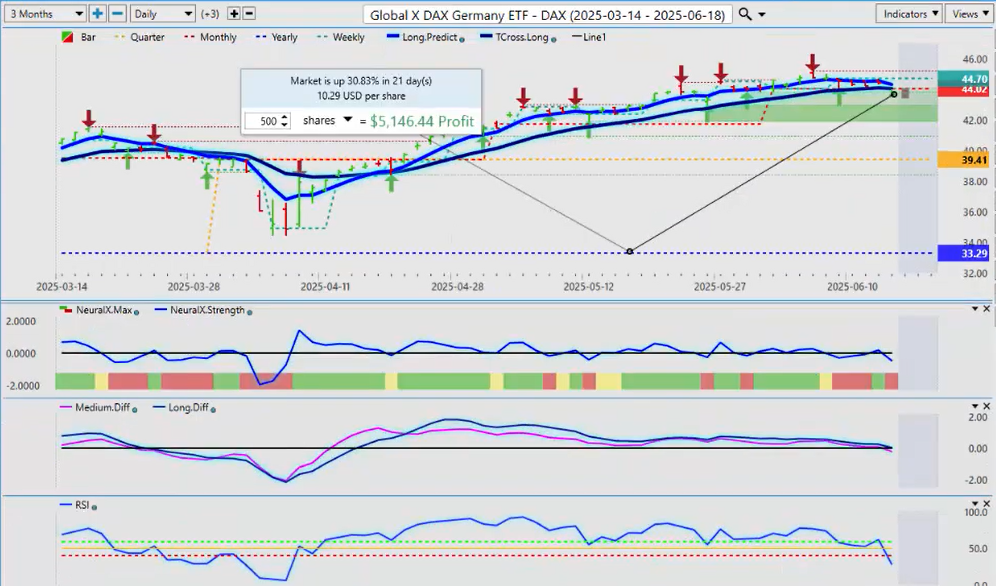
Now, when we do a comparative using the global XDAX, this is the only version I’ll be using going forward. I will not be using DAX futures. Again, it is outlined in Vantage Point’s position on futures versus ETF — me being a third-party contributor, this is the way they are making the decision to do that, so please direct those questions to Vantage Point.
So the DAX, unlike the SPY or the S&P, a very, very strong performance — up 30.83%. The European equity markets, potentially because of the tariffs, etc. — this is where the market has been focusing.
When we had that dip, the volatility in the DAX, pushing below the yearly opening price — again, in my respectful opinion, I don’t need hedges for the euro. I don’t need to check the correlation between this and the S&P 500, because I know that it’s currently to some degree inverse. And the DAX has been following a stronger euro — excuse me — but a lot of people moving out of the US equity markets for the European and some of the other global indices.
But this dip here in the Global X ETF, I believe, was far more accurate in this case than the DAX. With the DAX trading after hours — the tariff news, a lot of volatility — but it’s had a nice retracement back here in April, and then we’ve moved back up.
Now, the difference here between the SPY and the DAX is that as you can see, the SPY moved up from grossly negative territory on or about the same date. But we can’t cherry-pick performance numbers here, guys. They’re two very different-looking charts.
And that’s why, in 2025, I’ve been a strong advocate of buying the DAX — for that particular reason.
Volatility Index
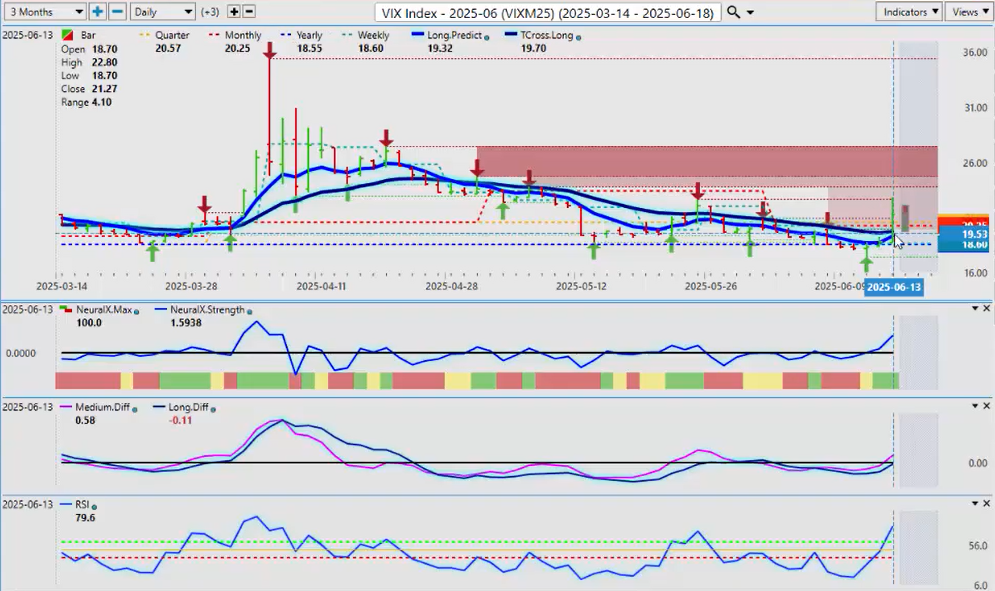
Now, when we do a further comparison between both of these using the VIX index and the ETF side — the VIXM — we can see that obviously it has reacted to the global conflict.
So, what we really need to be careful of — if there’s any ceasefire next week (I don’t think there will be, but there might be, you never know), if it calms down and both sides come to the table and lay down their arms — then this could reverse very quickly and the global indices could rise. So be careful of that.
But in my respectful opinion, we had put a bottom in on this back on June the 11th before this conflict started. So again, the core indicators in VP on this particular ETF are saying there is more upside potential here. And I believe that — because if we look at the calendar yearly opening price, this is yet another excellent way to measure real performance and whether something is bullish or bearish.
And this particular ETF, again only in my respectful opinion, is smoothing out what’s going on with the S&P, the SPY, the NASDAQ, and it’s basically showing weakness in the US indices or in some of the US stock markets.
So right now, that yearly opening price — $18.55 — we want to make sure we’re keeping a very close eye on this particular level. We’ve overtaken the Vantage Point T-cross long. So coming down from our close of 21.27, our support levels for re-entering this particular ETF: 19.32 followed by 19.70, and of course that yearly opening price at 18.55 — very, very important.
So, when we look at this particular ETF over the last six months, you can see that this has really never been negative on the calendar year — which is the polar opposite of the SPY. And for that matter, it’s showing us how strong that DAX actually is.
So when we combine the intermarkets, we have a very different viewpoint of things — let’s just say that.
Bitcoin
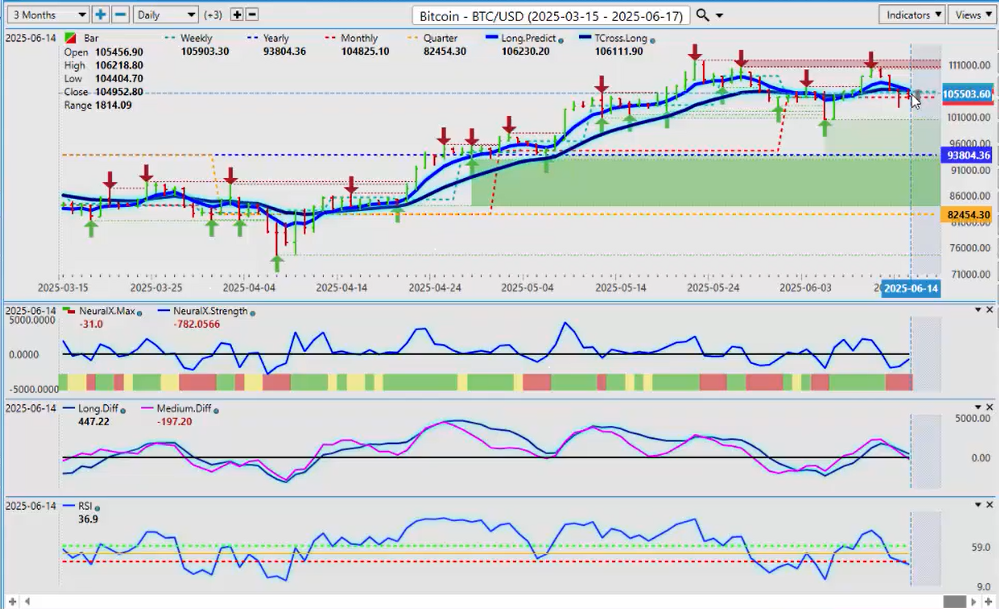
Now, when we look at Bitcoin, going into next week, once again under pressure. My view is that this is not — normally, the month of June is not predominantly a strong month for Bitcoin. I believe we have a top in place, at least for now, and we likely — in the weeks and months ahead — will retest the 93,804 level (the calendar yearly opening price), and I also believe that will be a very good buying opportunity.
So likely a very choppy week coming next week. We’re holding above the monthly opening price — 104,825 — but our T-cross long has been breached: 106,111. That is now our retracement point on the upside.
So unless the conflict begins to resolve itself, then there’s likely going to be further downward pressure on Bitcoin going forward.
Gold
But I think that the clear winner in this particular scenario is going to be gold contracts.
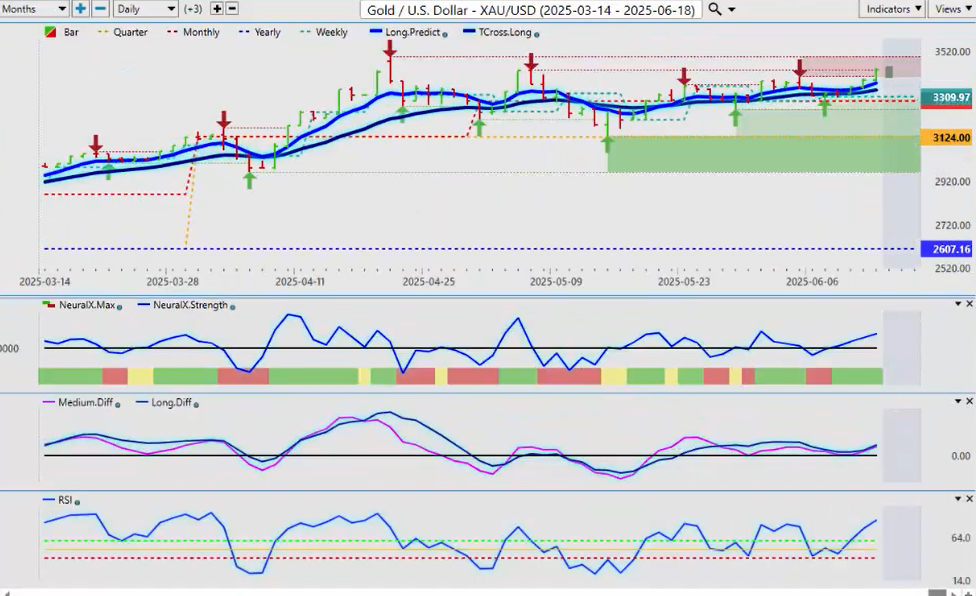
Now, when we look at gold, using the XAUSD — one of my favorites here — again, looking at the cash price, gold is moving up here, guys. But gold was already starting to move up at the beginning of the week — this previous week.
Now, the previous week, we were sellers of gold, warning that gold would likely start to move higher near the end of last week into this particular week that we’ve just had. So again, holding above the monthly opening price, gold extending higher — but always remember that gold is sensitive to risk-on/risk-off.
So if the conflict does see any kind of resolution at all, that would push this back down. But for now, the indicators remain firm, and I do believe gold goes higher this year anyway. But it’s knowing what weeks to buy it and what weeks not to buy it.
This is likely a week where gold will do fairly well. So we identify our T-cross long: 3,340 to 3,373. We’re having a very strong close here — 3,433. But these are our retracement points.
We have multiple verified resistance highs coming in this week. I believe 3,495 will be tested — that is the area to keep your eye on. If we get any conflict resolution between Iran and Israel, then this level will hold. But be very, very cautious around buying near that particular area.
Again, we’ve got momentum on this particular trade on our side. But in my respectful opinion — again — this started earlier in the week, this move. Or the conflict that we’re dealing with — global conflict — we’re dealing with right now. Again, Vantage Point was well out in front of this, as we expected gold to rise regardless of this particular conflict.
United States Oil ($USO)

Now, with oil contracts going into next week, you get a lot of players jumping on the bandwagon of how bullish this is now. But in this particular AI Weekly Outlook, we started looking at longs on this in mid-May, following that seasonal pattern in oil going up in June and July.
That’s the pattern that I’ve discussed week after week in here. And what will happen in most cases is retail traders will see this as super bullish going in here now — which it very well may be. But here are the key levels you want to watch going into next week:
The calendar yearly opening price — make sure we can stay above that: 76.84. If that is breached, again we follow the long predicted down to the pivot area of 75, and then the critical T-cross long of 71.41.
Now, in most cases, when the blue line heavily separates from the black line, that actually isn’t showing a stronger trend — it’s showing that the trend could be reaching the exhaustion point. So we’ve had a big spike up on this. I would respectfully submit to be very cautious with longs up here.
Now, I believe we can go higher. And when we look back on our charts for this particular year, you can see we have significant verified resistance high at 78. But I believe we potentially can target the verified resistance high at 84.58, and that will likely be the end of the rally.
So as you can see, this rally isn’t just starting here, guys. It started way back here at the beginning or middle part of May when I discussed it in here. But for now, what a lot of retail traders will do is they will jump in at the end of the rally instead of the beginning.
So I’m not saying we’re at the end of that rally now — I’m saying be very, very cautious buying up here is what I would suggest.
Euro versus U.S. Dollar
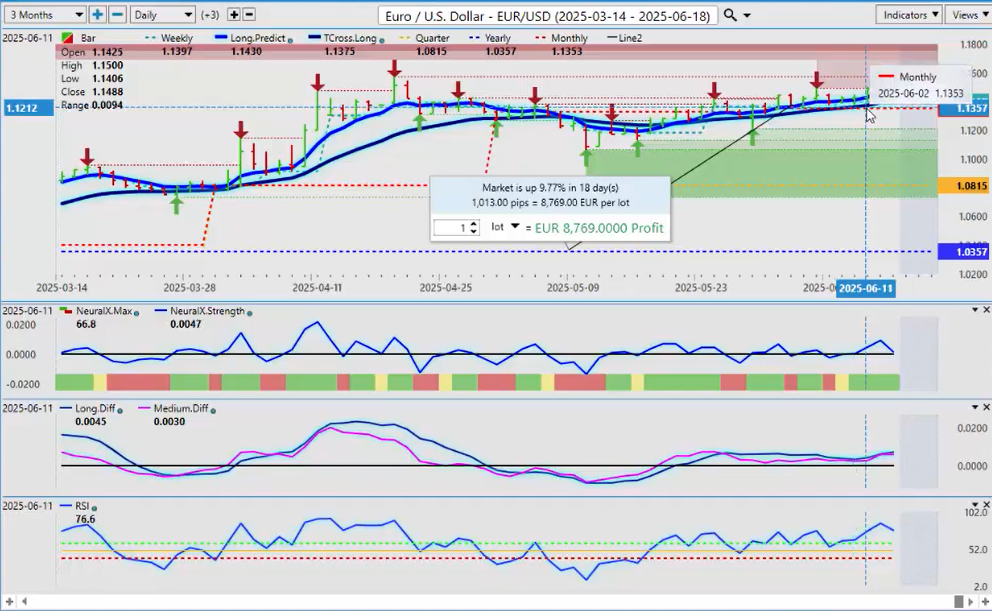
Now, going into some of our main forex pairs, starting with — of course — that very important Euro/US dollar pair. It broke out to the upside right out of the gate this past week off of the Vantage Point T-cross long.
Now, a relatively high correlation — about 75% positive correlation — to the DAX 30. So if the DAX starts to slip, that could see the euro coming down with it in a risk-off environment. But as soon as that risk-off ends, then the euro would likely go back up.
The euro having a very good year — up 9.77%. So don’t let anybody tell you that the euro is bearish or it’s having a bad year — because factually, it’s incorrect. It’s only when we bring in a rolling performance model — annually, 60 days, 90 days — it’s year-to-date from the beginning of January 1.
It’s the beginning of the month — which is, of course, June the 1st — and you can see that the euro is doing quite well right out of the gate at the beginning of the month.
And then we’ve had the retracement points to our T-cross long. So yes, there are signs of weakness going into next week in a risk-off environment — because risk-on does not always favor the euro. It usually favors the US dollar, the Swiss franc, and the yen — those three currencies.
But the euro is holding up very well, and it remains very highly correlated to gold contracts.
So our three main supports to buy from: Monthly — 1.1353, the yearly — 1.0357 (I don’t think we’re coming down there), but 1.0815 can’t necessarily be ruled out. But the T-cross long and the long predicted — these are the two key areas we want to watch: 1.1493 and 1.1411.
With a slight bearish undertone, I believe we will get down to between the T-cross long and the monthly opening. But that’s where we would look to potentially target longs.
U.S. Dollar versus Swiss Franc
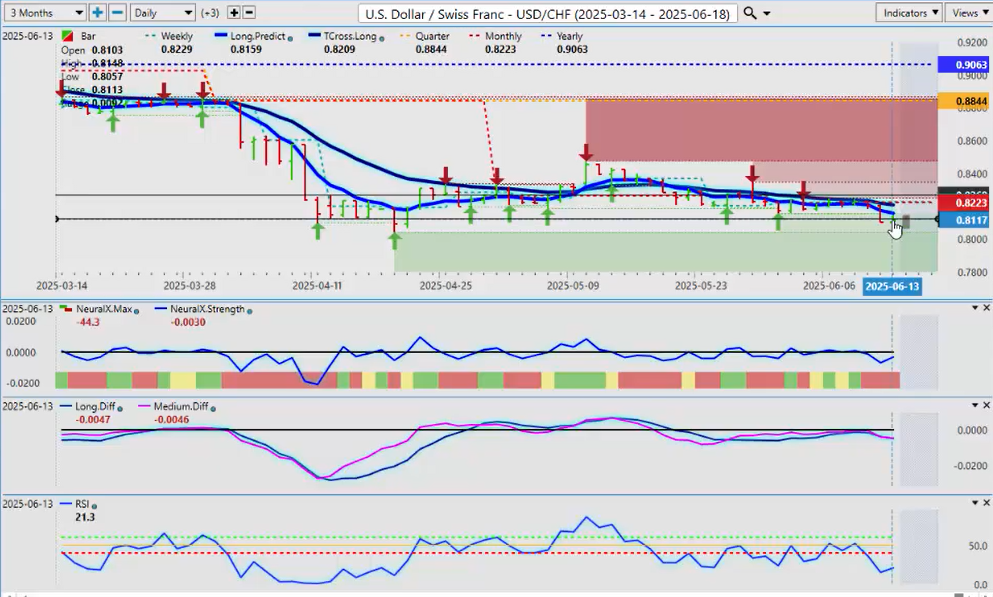
Now, the US/Swiss franc — this is strictly a risk-off trade here. When we have this kind of risk in the market, the Swiss franc will strengthen right across the board, as will the Japanese yen. So watch those two currencies.
But again, if there’s any resolution of this current conflict, those two currencies will also turn and weaken very quickly.
So right now, the primary trend is very clear on this — we’re down at 0.9063. When you measure that performance on a year-over-year basis, you can measure it like this in the VP software and say, “Okay, as of Friday, here’s where we’re at. This pair — for a currency — the US dollar has given up 10%, almost 11%, against the Swiss franc.” It clearly tells us which currency is stronger.
So again, just watch this verified support low — that will come in at 0.8040. We may see some kind of a bounce there, but again, we’re going to need some kind of resolution in the current conflict.
British Pound versus U.S. Dollar
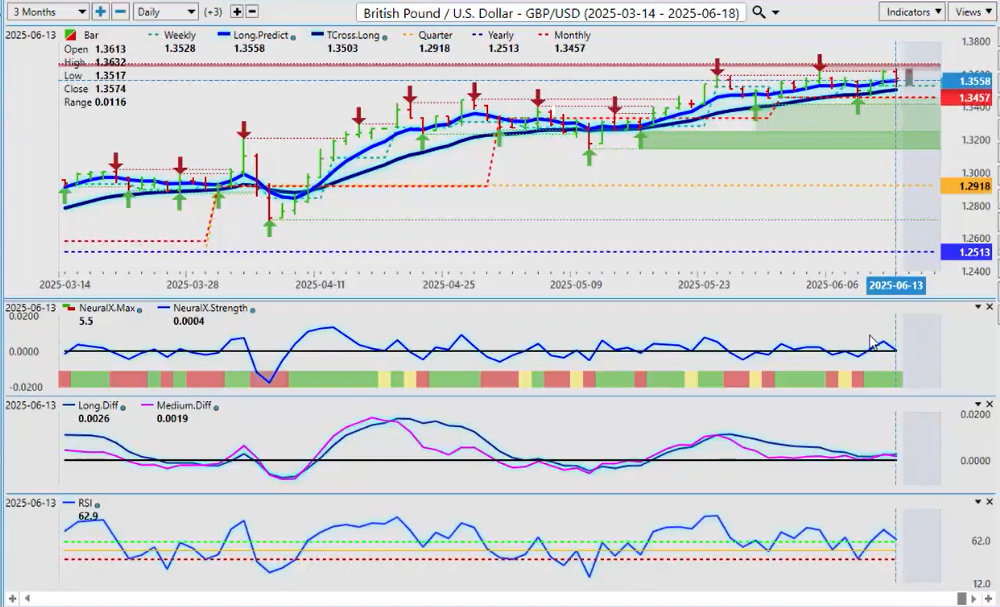
Now, the British pound/US dollar — once again, as soon as risk-off comes into the market, it immediately starts to move lower. The indicators here are pointing down, but it’s all based on headline news, in my respectful opinion only.
Again, I would not jump into the market on Monday. I would wait until Monday evening or Tuesday morning — let all of this stuff shake out. Probably a very choppy, volatile start to the market again this coming week. So be careful.
But I think that a retracement point back down to the monthly opening price — 1.3457 — is imminent. Then we reassess from there.
But having that hard anchor point to measure real support that’s price-based is critical — is paramount, I would argue — to your success. It’s knowing what the real trend is in the month of June. We’re not interested in January, February, March, April, or even May — because we’re not in those months. They’re behind us. We’re looking forward, not backwards.
So again, be very cautious of this one. But we could see a much deeper sell-off if the conflict escalates.
U.S. Dollar versus Japanese Yen
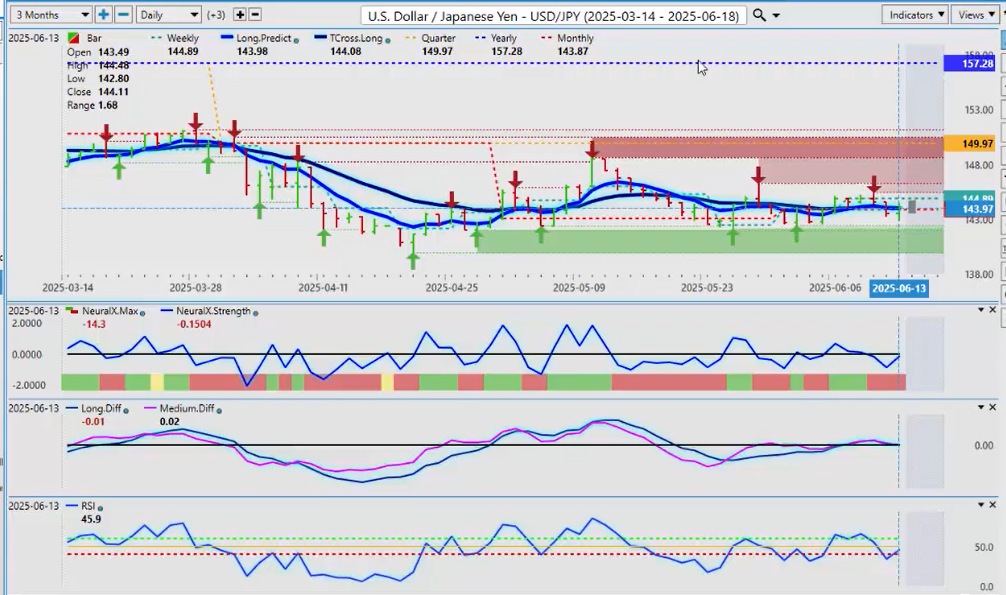
That, of course, would support the Japanese yen to some degree over the US dollar.
But the primary trend here, regardless of this conflict, guys, is heavily down — very, very similar to the Swiss franc. So again, this is measuring the US equity market — that is the correlation. There’s your approximate performance on the year, and they’re saying how weak the Japanese yen is. It’s just not factual, guys.
The yen is up 8.26% this year against the dollar. That’s the point to focus on.
Now, if we can break down below the monthly opening price at 1.4387, then we potentially have a much bigger move coming on this. So I believe, at the very minimum next week, we’re going to hit the verified low at 1.4240. If we can break through that, then we would go to our next verified support low — which is 1.3989. And even at 1.3989, I believe the yen is grossly undervalued against the US dollar.
But the indicators — bit of a mixed bag. That classic reverse checkmark here on the predicted RSI — yes, that’s concerning, absolutely. So the dollar could benefit from this conflict, to be clear. But we’ve got to see how far this escalates and what actually happens in the Middle East going forward.
U.S. Dollar versus Canadian Dollar
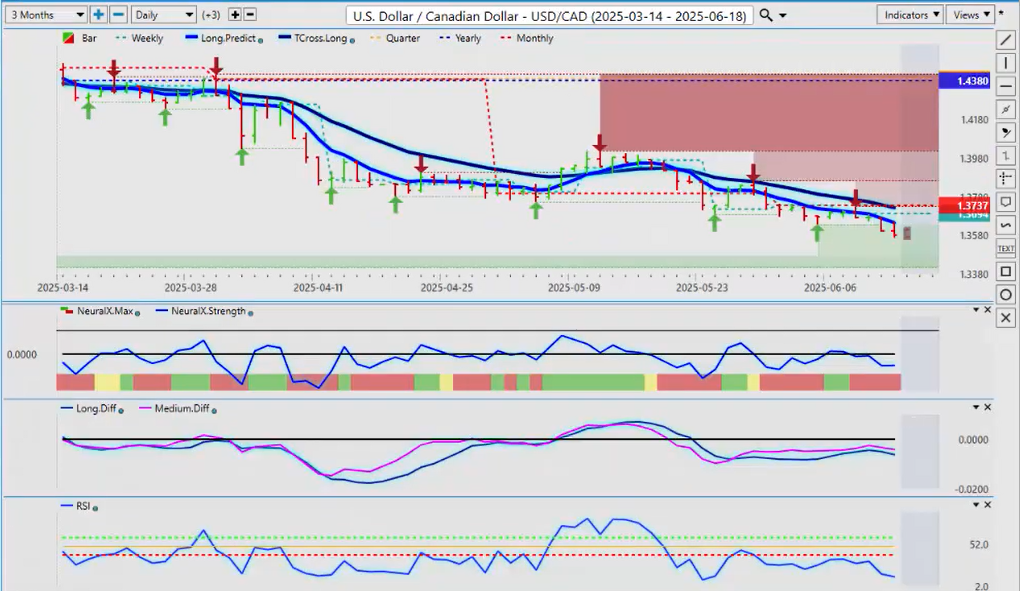
Now, the US/Canadian dollar pair — once again, the Canadian dollar has done fairly well. But again, we’re in that seasonal period of strong oil, which will start to weaken as we get into July, right?
So I believe that the US/Canadian pair will turn around and start moving higher soon — but it’s going to take lower oil prices, and we’re not there yet. When we’re talking about risk-on/risk-off, the Canadian dollar, the Aussie dollar, and the Kiwi do not like risk-off environments. But the Canadian dollar is supported by strong oil prices.
So that’s it for now — that looks good. What I really like about potential shorts here is the monthly opening price intersecting with the Vantage Point T-cross long at 1.3723. This particular level here — that’s where all of our resistance is.
So if you’re going to short this, that is the level. Now, the long predicted is at 1.3647. So I would respectfully submit that shorts are favorable between these two particular levels — the T-cross long and the long predicted.
But again, if we really get into a bigger conflict here, that isn’t going to benefit the Canadian dollar. Same thing for the Aussie and the Kiwi.
Australian Dollar versus U.S. Dollar
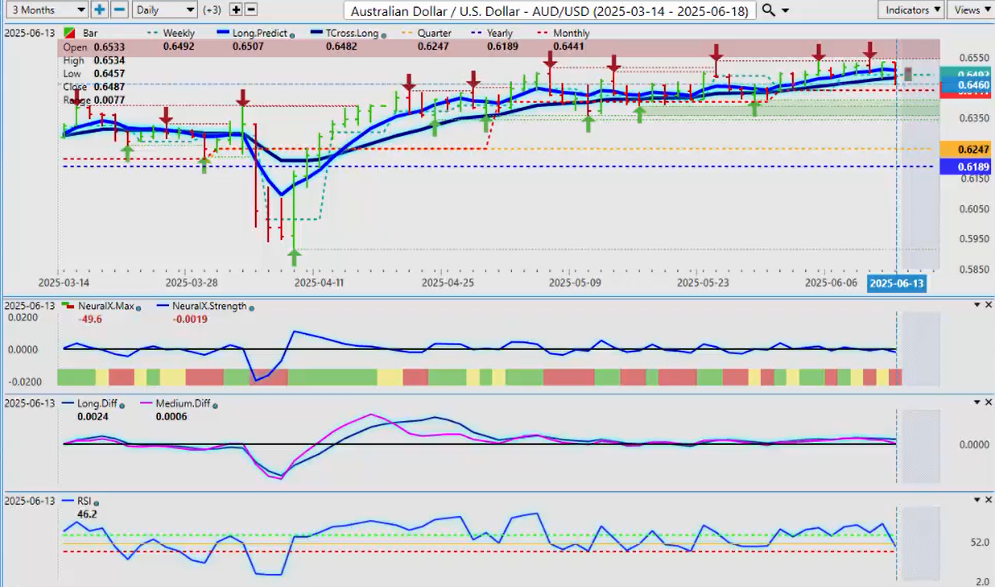
When we look at the Aussie right now, the structural bias of this pair is very strong to the upside. The yearly opening price: 61.89. Quarterly opening price is above the yearly. The monthly opening price is above both of these.
Again, this is the kind of structure you look for to identify a real trend — and that trend is up. But now we’re moving into a risk-off environment. There’s been some progress with the trade tariffs between China and the US — we’re not convinced that’s resolved yet, but it’s looking better.
But I also need to see what Russia’s position and China’s position is going to be on Iran being attacked by Israel. And I think we know which side they’re going to be on. So it could get very interesting here, and that would be a significant risk-off event. So be careful of it.
But for now, longs are still reasonable while above the monthly opening price. And I would further suggest it is still a buy — even down to the 61.62 area. But that’s for your more long-term traders.
New Zealand Dollar versus U.S. Dollar
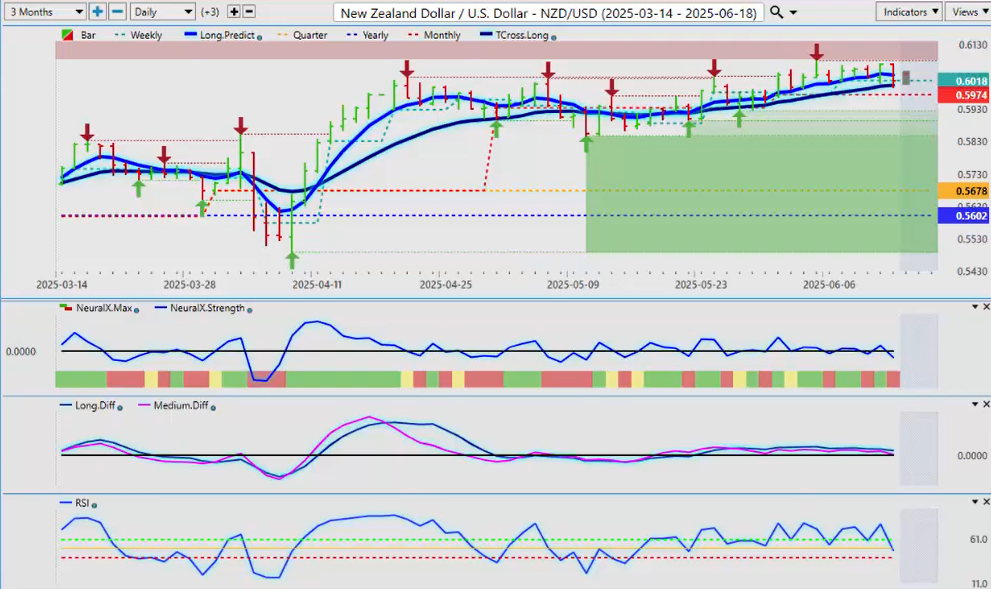
The Kiwi, once again, is going to follow the Aussie up and down. The Kiwi has done a little bit better in this environment, but it’s showing that there’s going to be more downward pressure on it.
But remember — if you have a relief rally in the equity markets, the DAX, the S\&P, the NASDAQ — they all turn around and go back up because there’s a settlement between Iran and Israel, then this goes screaming higher with it: the Aussie, the Kiwi, and likely the Canadian dollar, along with potentially the euro and the British pound.
And the currencies that will weaken will be the Swiss franc and the yen.
So it’s very, very important that we understand the risk-on currencies and the risk-off currencies so we can make a decision on what it is we want to buy.
So expect a very, very choppy, volatile trading session on Sunday evening and the entire day likely on Monday. And then by Tuesday, we should see some type of trend forming.
But with that will come opportunity.
So, with that said, this is the Vantage Point AI Market Outlook for the week of June the 16th, 2025.


