


Welcome to the Artificial Intelligence Outlook for Forex trading.
VIDEO TRANSCRIPT
Okay, hello everyone, and welcome back. My name is Greg Firman, and this is the Vantage Point AI Market Outlook for the week of June the 23rd, 2025.
U.S. Dollar Index
PowerShares DB US Dollar IDN Bullish Fund ($UUP)
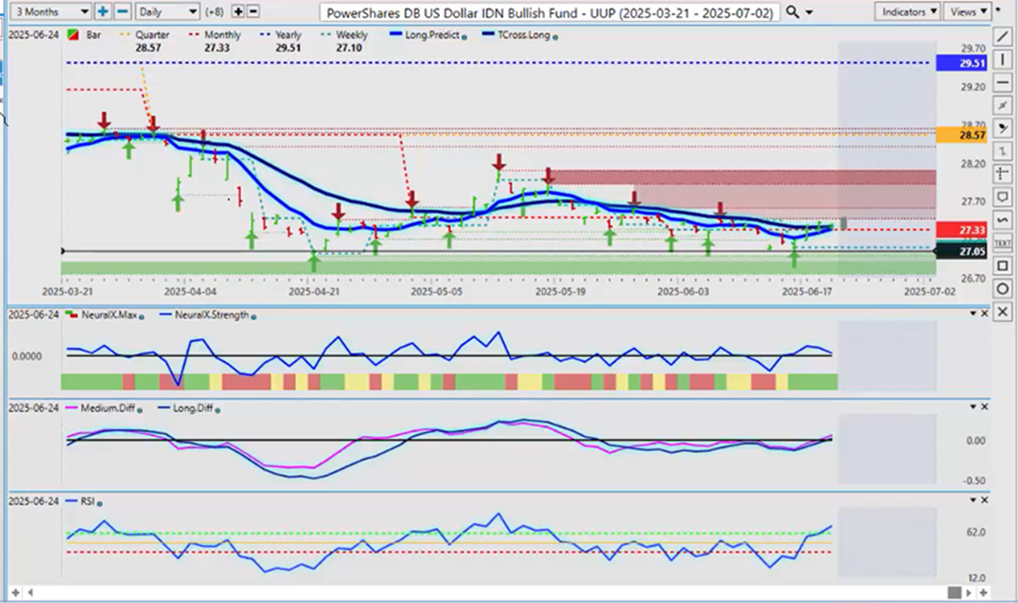
Now, to get started this week, we’ll begin where we always do—with the US dollar index. Now, I think we’re going to see a very, very choppy, volatile start to the week with everything that’s going on between the US, Iran, and Israel.
Right now, we can see that the US dollar was actually already starting to strengthen last week. Now, we’ve got a low end on the Monday bar coming in at about 2705, and we’ve been climbing all of this past week. We’re closing just a hair above the TCROSS long at 2738. You can see that we’ve closed at 2740.
In my respectful opinion only, I believe the events over the weekend should strengthen the US dollar, but always remember that, predominantly, the US dollar is strong at the end of the month and into the first week of the new month anyway. So this is just simply going to potentially sweeten the pot. But if we see a big move on Monday—which I believe we will—we want to be very, very cautious.
Again, in my respectful opinion, I would not touch anything on Monday. Wait until Monday evening or Tuesday until we see how all of this plays out.
Now, the predicted differences—the medium-term predicted difference and the long-term predicted difference—are breaking above the zero line. The predicted RSI is sitting at 60.1, which is showing momentum. That’s what we want to trade here, guys. We don’t want to be trading overbought/oversold—we want to be trading momentum. That is the key thing.
The only one that concerns me a little bit here is the Neural Index. It is green, but the Neural Index Strength is moving in the opposite direction of what the main price is doing. So that could suggest that maybe the US dollar could struggle at the beginning of the week. But either way, by the end of the week, the US dollar is likely in the driver’s seat.
So, uh, when we look at the UDN, the dollar bear fund, you can see that we’ve been under pressure this entire week on that. Now, I do have a reverse check mark here on the, uh, on the Neural Index Strength, uh, but there is definitely a medium-term crossover that has occurred.
But here is the big “however” that’s coming: with the predicted RSI, we’re looking to gauge momentum—not overbought and oversold. Is there downward momentum? This is saying no—uh, not currently.
So, to begin the week, I think it’ll be a very interesting start—uh, for Monday evening and Monday morning trading. But by Tuesday morning, I believe the smoke will clear, and we’ll have some idea what’s happening.
So again, always remember that dollar cycle at the end of the month—that’s when there’s real dollar demand, uh, for the currency. So again, we’ll monitor things, but be cautious.
Gold
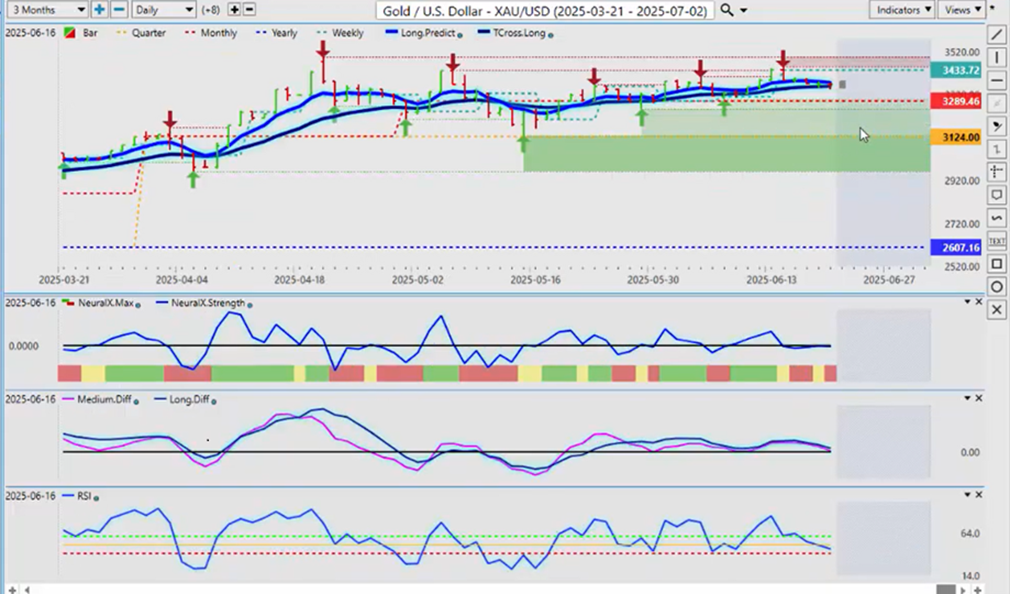
Now, with gold contracts here using XAUSD, we’re hovering right on that TCROSS long at 3358. I believe we’re on our way to the monthly opening price at 3289. And again, one of the reasons I’ll say that—even with everything that’s happening between the US and Iran—gold usually weakens at the end of the month.
So, in this particular case, it may not. But the predicted differences are pointing down. The predicted RSI is pointing down also. But we need to break down below the 40 level on the predicted RSI to say, “Look, we’ve got momentum building here.”
Certainly, it would be an easy argument for me to make that gold is going to go up next week because of what’s happening with the US and Iran. But in actual fact, here, guys, it doesn’t always work that way. Just because there’s a major risk-off scenario doesn’t necessarily mean it will automatically go into gold for the entire week.
So again, we’ll monitor this closely. But the monthly opening price is at 3289—that would be a natural retracement point at month-end anyway. And as you can see on a monthly basis here, the gold contracts have done fairly well for the month. But we are running in a rather tight channel here for an extended period.
SPDR SPY ETF ($SPY)
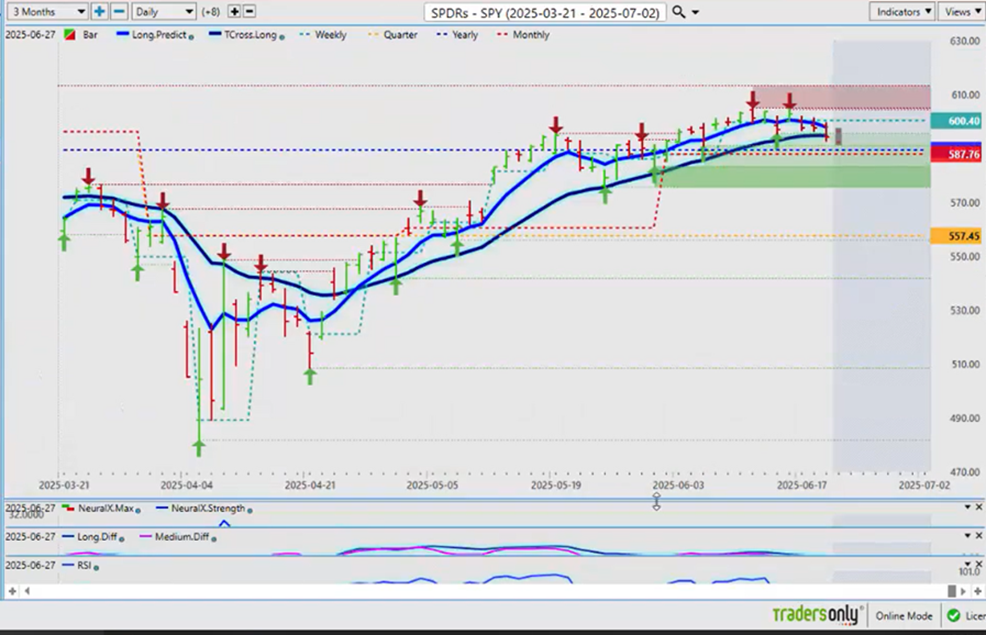
Now, with the equities going into next week, obviously there’s going to be a lot of volatility at the open tonight—on Sunday night. So, the argument that I made last week is: First and foremost, the previous week, we were not up 3.5% or 3.25% as I said in the video. Last week, we were up a mere 1.25%, and we’re not holding onto that. We’re down again this past week.
The critical level here on the SPY will be the calendar yearly opening price—that’s at 589.39. I believe, if nothing else, we will definitely breach that area unless something dramatically changes by Tuesday or Wednesday, which is possible I guess. Because again, at least for now, the US is not demanding regime change there—so again, we’ll see how this one plays out.
Regardless of all this, right now the SPY has been struggling at these levels for an extended period. I had showed previously in last week’s presentation and warned everybody that the last time we cleared the calendar yearly opening price, it was very short-lived. And this time, we’re making much lower highs also.
So again, never say never here. But the position of that predicted RSI is saying momentum is building to the downside. That is what it’s saying. So good or bad, right, wrong, or indifferent, it is warning us—before the events of this weekend—that it’s already struggling. And we can see that in the chart.
Bitcoin
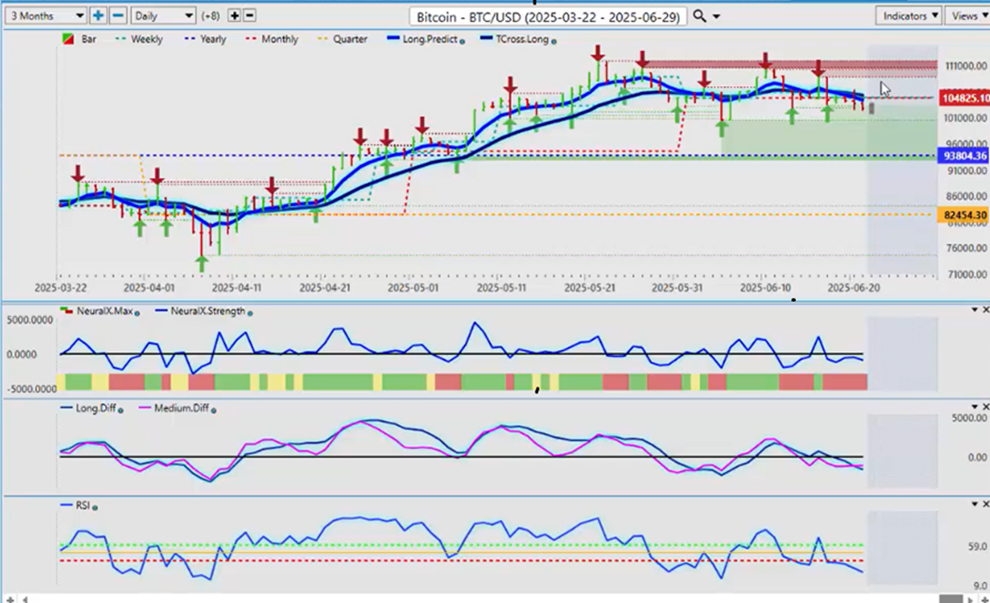
Now, Bitcoin this previous week also struggled. As I had mentioned on several of these outlooks, the primary demand for Bitcoin appears to be between late August, mid-September, into about mid-October or early November. So, we’re not going anywhere up here.
The verified zones have identified multiple failure points. I still very much like Bitcoin longs, but closer to September. I think we’re going to be moving lower this week. If the stocks really get hammered lower, then I can tell you that Bitcoin is likely going to follow those. And the winner of this battle between Bitcoin and gold will likely be gold.
So, we’ll see how it plays out. The only indicator here that’s warning there may not be any downside is the MA diff cross—you can see this pink line starting to turn back up. That’s a warning sign.
Again, we’ll monitor things closely. But your upside resistance on Bitcoin: the Tcross long, that’s going to be 105,345, and the long predicted at 104,414. That’s where all of your resistance is for next week, guys. And there is definitely a short bias here.
We do have momentum building on the predicted RSI. The Neural Index and the Neural Index Strength are below the zero line. And we’re also below the long predicted and the Tcross long. So, a bearish picture has been painted here.
Crude Oil ($CL)
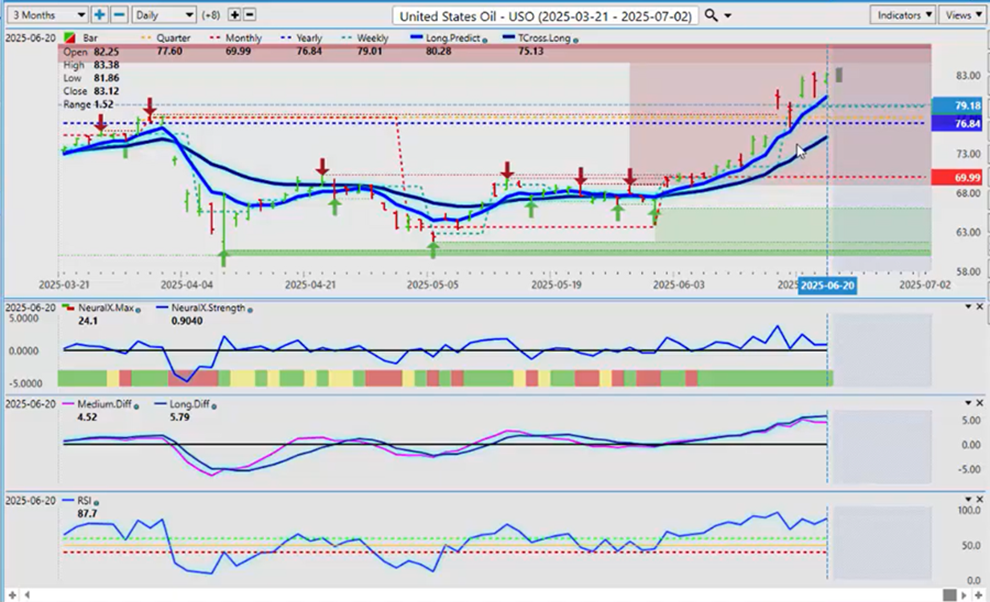
Now, with oil prices—this one is where it’s going to get very, very interesting going into next week. We’ve cleared the yearly opening price, and I think that the bulk of the market will automatically assume that oil is going to go through the roof because of what’s going on with the US, Iran, and Israel.
But in actual fact, that may not be the case. I think the US may try and control oil prices so the Middle East can’t get that oil money to fund terrorism and everything else. So, we’ll see how this goes.
The further we move away from the VantagePoint TCROSS long at 75.13, the less attractive this oil trade is to me. I need a significant retracement lower—either to the yearly opening price or the TCROSS long. And the VP indicators are warning: our medium-term strength is below our long-term strength. That is a bearish setup.
Now, it doesn’t mean a complete trend reversal, but it warns us that there may be limited upside here. So, let me give you a scenario of what I think will happen here:
You will have a big spike in oil on Sunday night or early Monday trade in Asia. That will continue into the North American session. And then on Tuesday, you could see a complete and utter reversal in oil—back to the downside. That’s what I suspect will happen because I’ve seen this week after week: a big major announcement on a Monday only to be completely reversed on Tuesday.
So be careful of that. There will be trouble there.
Volatility Index ($VIX)
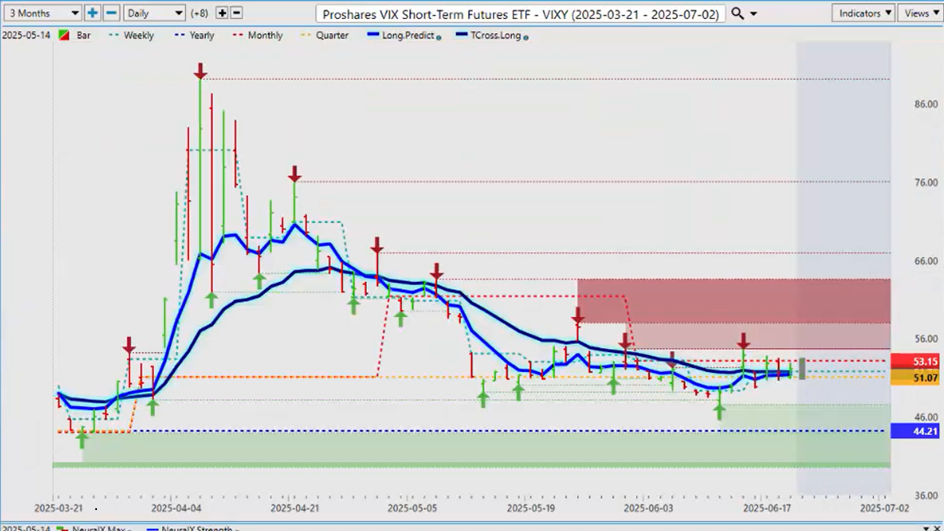
Now, using the ProShares VIX ETF to gauge that, you can see that the monthly opening price has been containing the short-term VIX futures via the ETF—the VIXY. So, we remain elevated—price actually above the calendar yearly opening price at 44.21.
When we look at this right now, this past week, the VIXY has actually done fairly well. Now, when we bring in our core VP indicators, the medium- and long-term predicted differences are saying that there’s upside potential here. And again, they were saying this on the Friday night update—before the US bombed Iran.
So again, the AI is already picking up on something odd going on here. And Trump was clear. He said, “Nope, not doing anything for two weeks.” Well, we know now that that was a setup to distract the Iranian military forces.
So again, I believe the VIXY can push through 53.15—and likely will on Monday. But can it hold above that? That current monthly opening price is key. But the calendar yearly opening price—unless we get below 44.21—then longs are heavily favored.
DAX
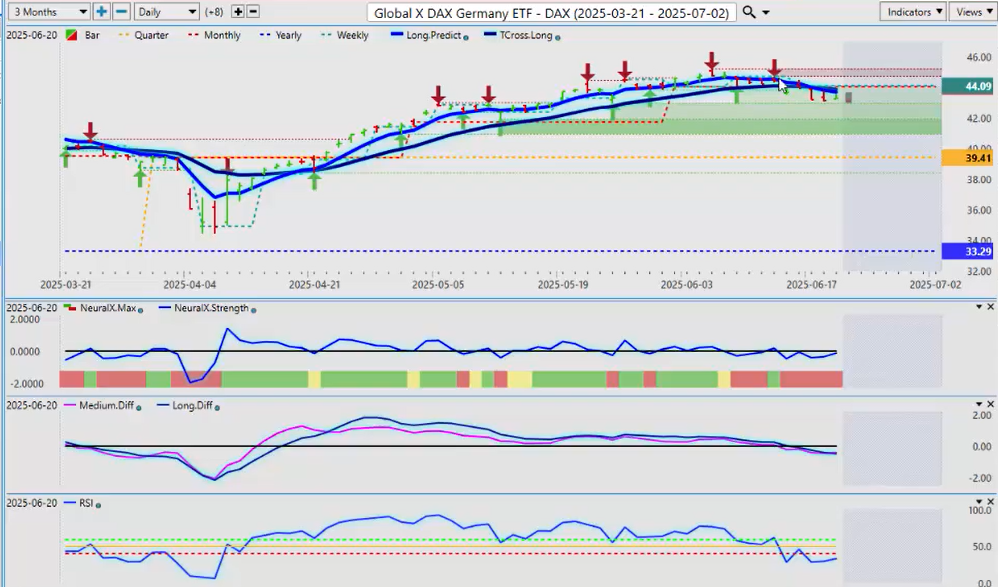
Now, it wouldn’t be an outlook without advising my good friends in Germany here. The Euro is under a little bit of pressure—and I’ll talk about that first out of the main forex groups.
Right now, a lot of the markets are responding to the risk-off. So, the DAX really has done extremely well this year compared to the NASDAQ, the S\&P, and the Dow. What I’d like to see it do is get back up above the Tcross long at 4386.
But it will be a very difficult week globally for the indices to do that. So, keep an eye on that. To identify our key levels: the monthly opening price at 4402—that’s a critical level. Very critical. But the Tcross long at 4386 and the long predicted at 4367—these are the two levels we need to get back above immediately, or it is very likely we’re going to return to the current quarterly opening.
Again, we always want to make sure we’re measuring the first quarter, second quarter, third quarter, fourth quarter—not comingling months. So again, if we break down below that, you can see we don’t have much support until the low, which is 4190. If things go the way I think they will next week, 4190 is likely in the cards.
Euro versus U.S. Dollar ($EUR/USD)
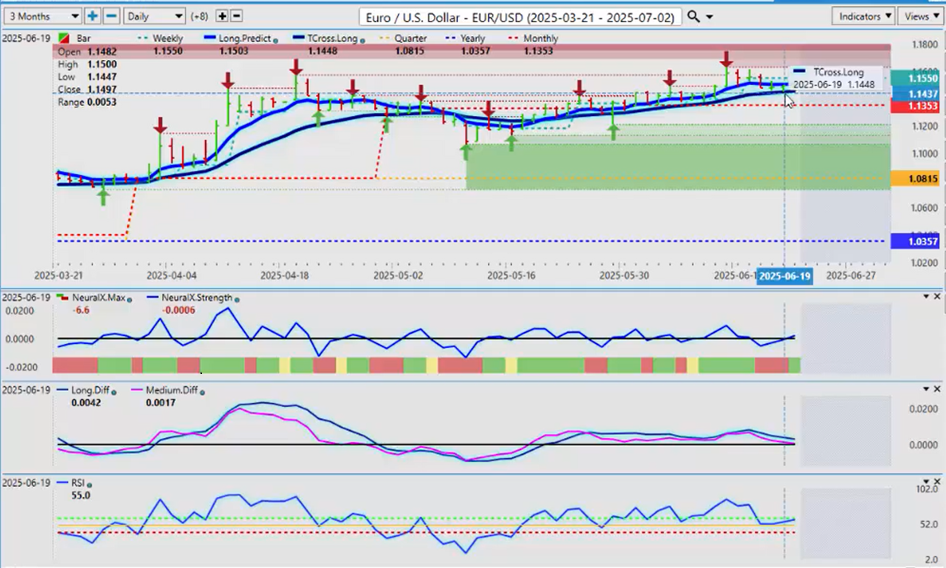
Now, when we look at the EUR/USD, we’ve come down, had a retracement off of the VPTcross long on Thursday, and rebounded off of that. Structurally, the Euro still looks very good—above the yearly opening price, the calendar quarterly opening, and that very important monthly opening price at 1.1353.
But the weekly opening price has contained it all week long. If the US dollar does significantly rise, then that would put pressure on the Euro. But I will warn everybody that the Euro has historically had a high correlation to gold, so that may indirectly support the Euro.
I think we have a very interesting week ahead of us. But again, I would not bite on anything until at least Tuesday morning or later Monday night—the second open in the Asian session. The Tcross long—that is the line in the sand at 1.1456.
So, an alternative strategy I can provide is setting up a sell stop below 1.1456. If and when we break down below that, we have a sell order sitting there ready to go. If the buy side remains intact, then we can pick it up off the long predicted at 1.15 or the Tcross long at 1.1456.
But I suspect that a sell stop below the Tcross long would be a reasonable play here, guys. Most people don’t have those levels—they’re not using VP software or similar tools. So it’s simply an alternative strategy I’m happy to provide.
U.S. Dollar versus Swiss Franc ($USD/CHF)
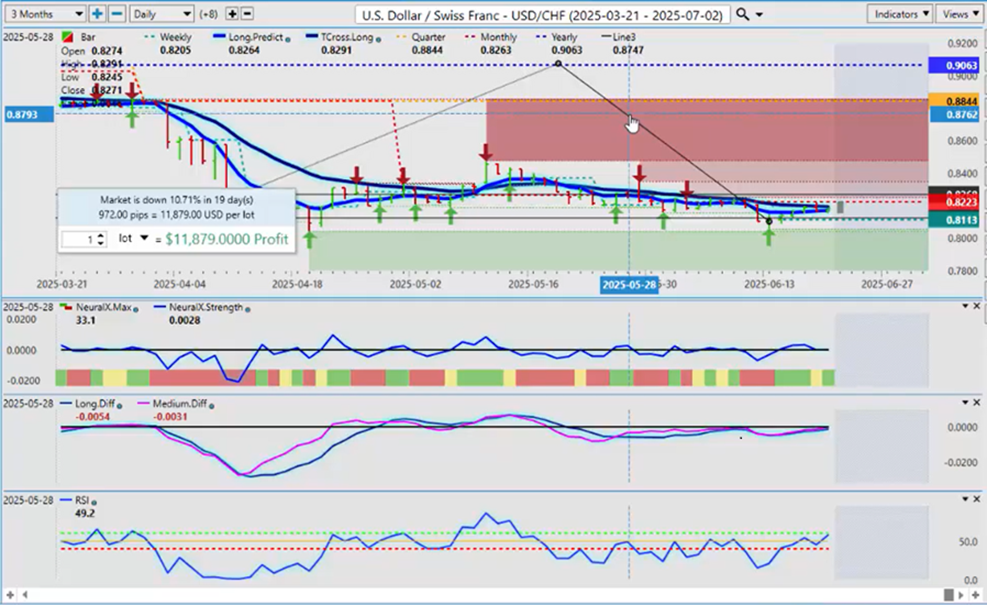
Now, the USD/CHF—the US Swiss Franc pair—is going to be interesting. If the equity markets tank, this is how it works: the US dollar will not strengthen against the Swiss Franc in a severe risk-off environment. Two currencies—particularly—the Swiss Franc and the yen will strengthen. So, this is 100% dependent on what happens next week between the US and Iran.
Watch this one very closely. I’ll point out again: prior to this happening, the US dollar had simply corrected higher back to the TORS long and has continually failed into that area. The monthly opening price is also sitting right there at 0.8223. We’d have to clear this area if we were thinking about longs.
But I believe we will be in a risk-off environment—at least at the start of the week. That’s where you want to keep an eye on things.
British Pound versus U.S. Dollar ($GBP/USD)
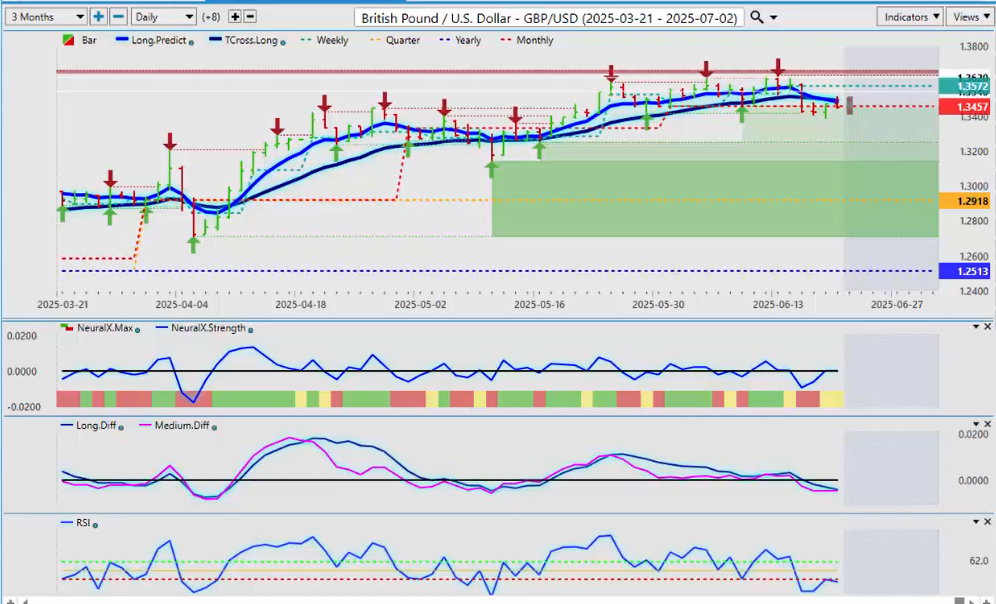
GBP/USD—the British pound—again, last week I said I didn’t think it would be a great week for the pound. We’ve had a significant move down. We have failed and are holding the monthly opening price. But again, it’s going to be a headline-driven trading week.
Make sure you have access to information, because it will make a difference. For now, structurally, the pound is positive on the year. But I don’t think the monthly opening price will hold—at least in the first couple of days—because we’re heading into a period of known US dollar strength as we approach the 30th of the month.
So, while the pound may recover on Monday or Tuesday, I think it struggles toward the end of the week. The indicators in VP are mixed. But again, the TCROSS long at 1.35—that’s the level. Shorts are absolutely valid for at least a week to a week and a half.
U.S. Dollar versus Japanese Yen ($USD/JPY)
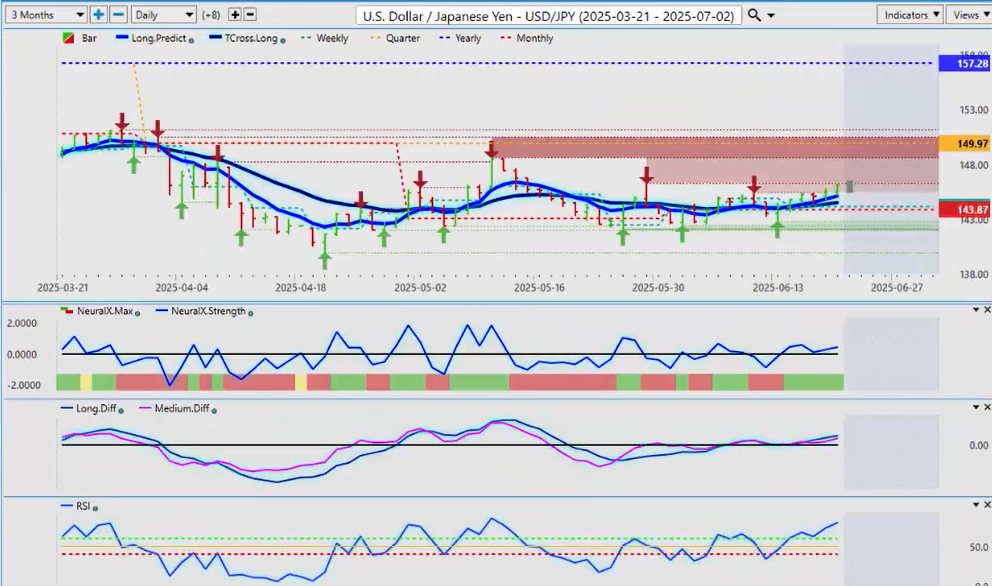
Now, USD/JPY—this is going to be headline-driven. Right now, it’s already picking up on US dollar strength, but this could reverse very quickly. In a risk-off environment, the yen could strengthen.
Be careful of that. We have a series of verified resistance highs starting at 145.46, with secondary resistance at 146.20 and 146.628. I believe selling into these two levels is very reasonable—data and news dependent. But either way, you may want to avoid this pair next week altogether until the real price shows itself.
U.S. Dollar versus Canadian Dollar ($USD/CAD)
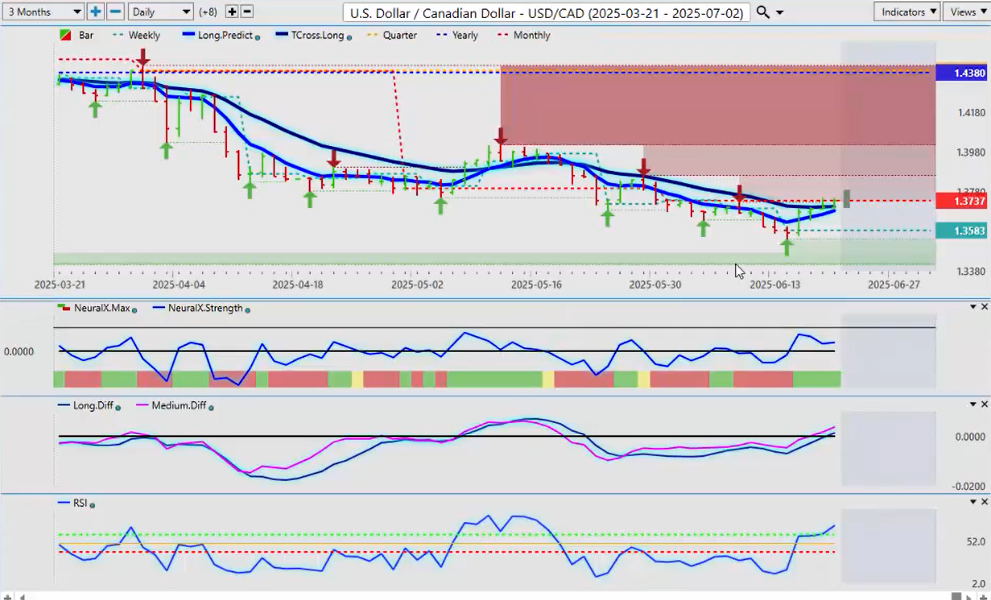
Now the USD/CAD—this is an oil-driven currency. But again, as I discussed with the oil contracts, I think it’ll be very interesting. In my respectful opinion, the easiest way to cut terrorism off is to keep those oil prices down. So I believe that’s what they’ll try to do.
We may see an initial spike, then a selloff. I could be wrong, but I’ve seen this movie before, guys. Right now, the pair is pressuring the upside.
The Canadian dollar also has a high correlation to risk. If risk is on, the Canadian, Aussie, and Kiwi do fine. But if we go into a risk-off environment and things escalate between the US and Iran, the CAD, AUD, and NZD are not currencies we’d think about buying—at least not immediately.
So, there’s a possibility that the USD/CAD breaks through the monthly opening price. That would set the TORS long as our support at 1.3704, with additional support at 1.3686—the long predicted. I’d say there’s a 60% chance it breaks through here on Monday.
Australian Dollar versus U.S. Dollar ($AUD/USD)
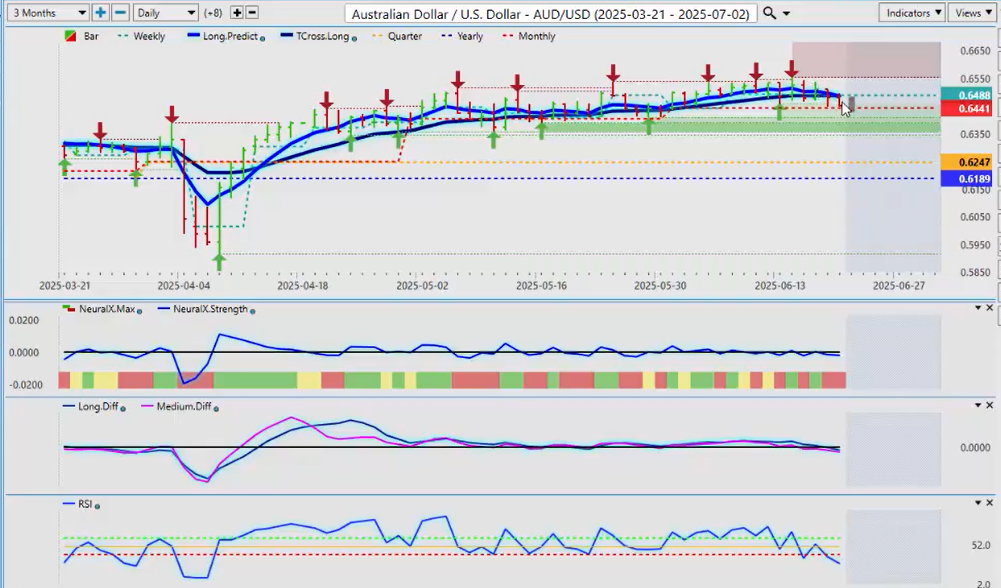
Same applies to the AUD/USD and NZD/USD. You can see they were under pressure last week—long before the strike occurred on Saturday. Much like the USD/CAD, these are pressuring downside.
The monthly opening price on AUD/USD is 0.6441. The VP indicators say this level will be breached. I respectfully agree. But we’d also be looking for buying opportunities once we get past here. Key levels: 0.6247 and 0.6189. As long as we’re above those two, the pair remains bullish.
I believe what’s happening with Iran and the US will likely pass—but I’m not convinced. I hope they come to an agreement, but we’ve been at it with Iran for a long time. I think it’ll escalate. That tells me the monthly level is likely to be breached.
New Zealand Dollar versus U.S. Dollar ($NZD/USD)
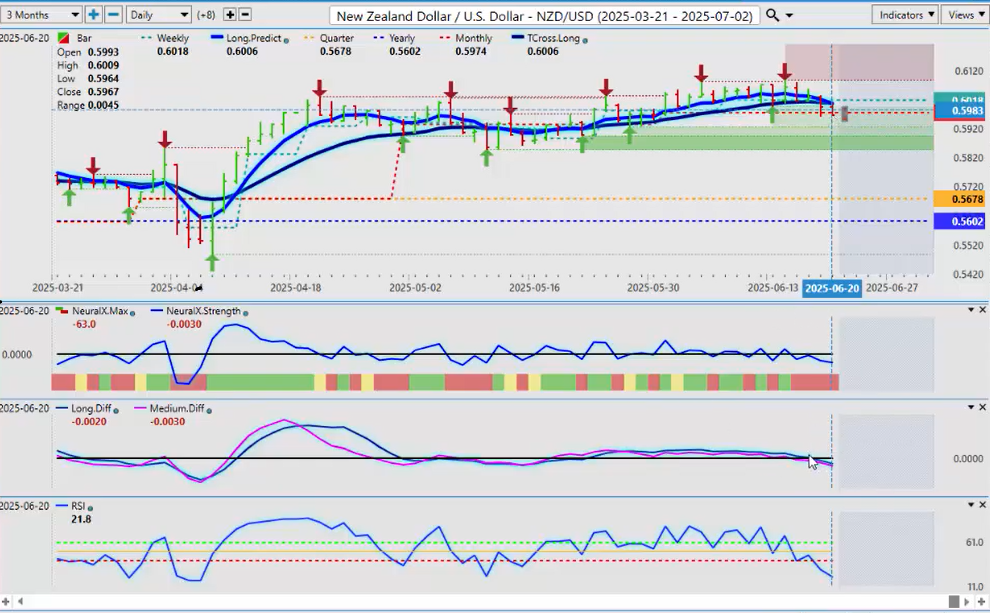
And when we look at the NZD/USD, it’s the same trade. It has already breached the monthly opening price. The VP indicators were ahead of this in Wednesday’s trading when the MA diff cross went down.
I don’t like to show things after the fact—I’m only pointing out that someone likely knew something was coming and started moving out of longs on the AUD/USD and NZD/USD.
But the one that shocked me—and really made me say “something funny is going on”—was oil prices going higher and the USD/CAD screaming higher. That was a warning sign. That, by definition, guys, is intermarket technical analysis.
So, be very cautious to start the week. And in my respectful opinion, I’d wait until Tuesday morning and let the smoke clear.
With that said, this is the Vantage Point AI Market Outlook for the week of June the 23rd, 2025.