


Welcome to the Artificial Intelligence Outlook for Forex trading.
VIDEO TRANSCRIPT
Okay, hello everyone and welcome back. My name is Greg Firman and this is the Vantage Point AI Market Outlook for the week of June the 9th, 2025.
Powershares DB US Dollar IDN Bullish Fund ($UUP)
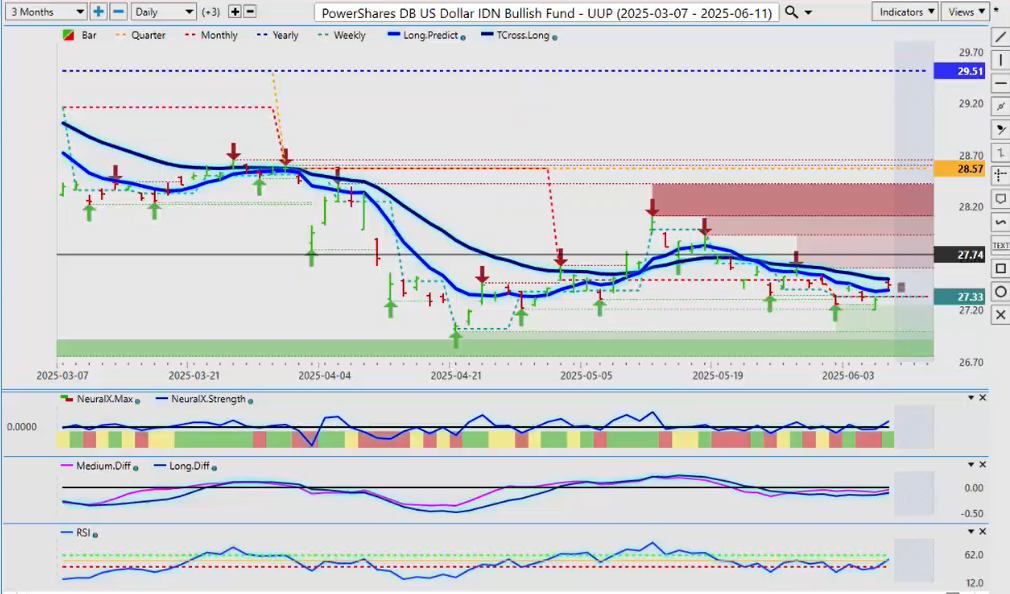
Now, to get started this week, we’ll begin where we usually do—with the US dollar. Now, coming off that payroll number, slightly better than expectations but nothing great. Uh, but it is holding.
So right now, we’ve had a full retracement on the UUP, the dollar bull fund, and we’re pausing right on the T-cross long at 27.50. Now again, in most cases, the US dollar is fairly strong at the end of the month into the first week of the new month and predominantly struggles after that. The Tuesday after the non-farm payroll number is usually when we see dollar weakness.
Powershares DB US Dollar IDX Bearish Fund ($UDN)

So on a comparative analysis to the UDN, the dollar bear fund, it remains firmly above the VPT cross long. Now the indicators are somewhat mixed, but the simple way of looking at this is—we’re above the yearly opening price, 16.70. We’re holding above our TCROSS long, so it has a more bullish tone to it, meaning selling dollars.
The neural index to start the week is still down—uh, is down somewhat—but again, that’s coming off that payroll number. But we have no medium or long-term crossover and little to no downward momentum.
Gold/US Dollar ($XAU/$USD)
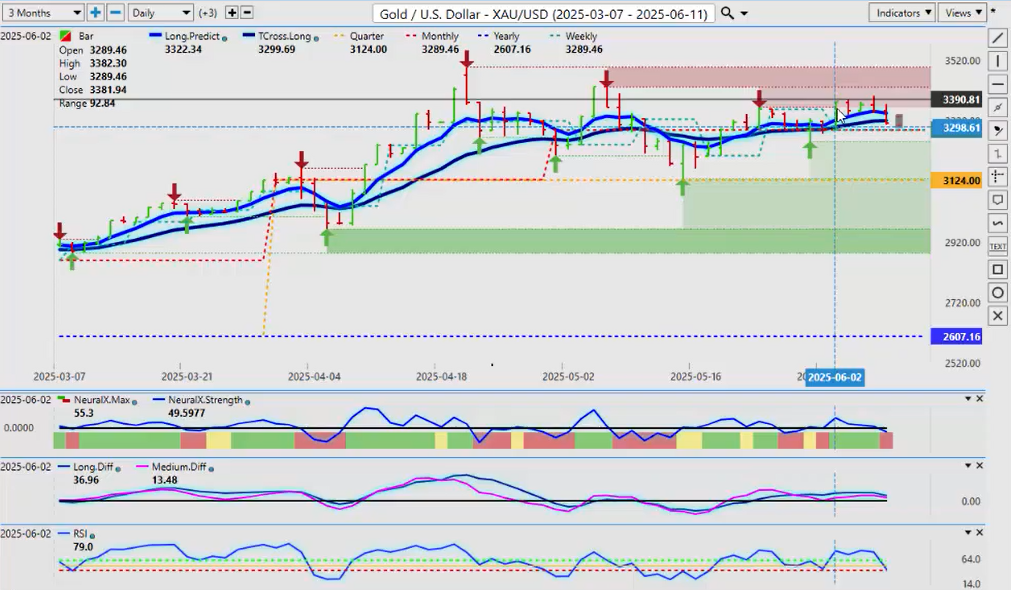
So when we look at that and do a comparative analysis to this past week, looking at gold contracts—as I had stated last week—that again, not a week for buying gold but a very good week for selling it.
We have a spike in gold on Monday, which is a fake price. And then we have multiple selling opportunities off the top end of that Monday bar. Very, very good shorts all week long. And again, in most cases, Monday is not a true price, so we’re failing up into this area, making shorts very easy.
The neural index strength, as you can see, very different than the neural index itself—the red and green inside the neural index—we can see weakness in gold starting right at the end of the day on Monday. And as the neural index strength slides, gold is unable to break above the Monday bar high. That’s precisely what we’re looking for.
But the main thing we look for is understanding that if we’re in a period of known US dollar strength, it’s not the week to be buying gold. But next week, we could see that turn around. My only concern is we are closing slightly below that T-cross long, 33.20. That’s the area to keep your eye on. But we’re firm—we’re still holding above the monthly opening price. So if we see extended US dollar weakness, that would put downside pressure on gold.
And most participants in the market are buying silver this past week—not gold. So again, the charts don’t lie here, guys. It’s just identifying the area of where to sell and the time of the month that you’re in.
So for now, for next week, I believe gold will come under a little bit of additional selling pressure to begin the week. Then, towards the latter part of the week, we could see that shift. We would need that predicted RSI showing momentum breaking down below 40, and I’m not convinced at this particular time we’re going to get that.
SPDR SPY ETF ($SPY)
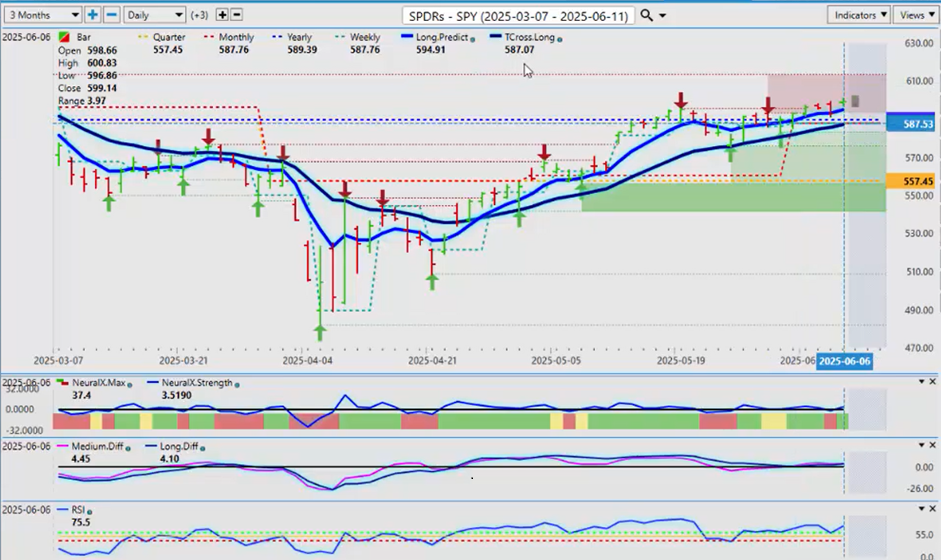
Now with the equity markets—more specifically the SPYs—they’re doing well. Certainly doing a lot better here, but still, still some—uh, I would argue—still a bit of a problem area. Again, around that yearly opening price. We really do need to break through that particular level, stay above this particular area—excuse me—that yearly opening price that’s coming in at or about 589.39.
Now to be clear, I’ve been very vocal on this—that the inverse correlation between the S&P 500 and the US dollar index is not really there at the current time and hasn’t been since about November 2024. And right now, it seems that they’re buying the euro, and they’re buying the DAX. They’re buying the US dollars, and they’re buying the S&P. So there’s a different intermarket correlation occurring right now.
So we kind of need that US dollar to get moving here. But if it moves lower, that indirectly tells us we could see the S&P and the SPY move lower too. But for now, the critical area that you want to keep your eye on would be the TCROSS long at 587 and that yearly opening price at 589. If we cannot hold above these levels, guys, you want to basically think about maybe moving toward the DAX or some of the other global indices.
But again, we’ll monitor things. The indicators here are still looking pretty good for the start of the week. But again, keep a very close eye on that US dollar.
DAX

Now when we do a comparative analysis—and this is what I will be using—for the DAX, not the futures contracts that are outlined in the description of this video. This is the position Vantage Point has taken. It is clearly outlined there. I’m a third-party contributor. So if you do have questions about that, please direct them to Vantage Point directly.
So with the DAX, using the Global X DAX ETF—again, I’ve been very vocal on this one too. When the markets were absolutely certain that the DAX was done back here in April, I took a very different viewpoint based around intermarket correlations—noticing that when they’re buying the euro, they’re also buying the German and the European equity markets.
So we’ve had a very strong recovery off of here and a very different looking chart from the S&P 500. The Global X DAX or the DAX futures—again, same thing, guys, right? We can see we are firmly above the yearly opening price, and we’ve really never been below it. It’s a very strong year for the DAX right from the beginning of the year.
This retracement lower was an excellent buying opportunity. When you do a comparative analysis to the DAX and the euro—and there also used to be an inverse correlation there too, where they would buy the DAX when they were selling the euro—but now, buying euros and buying the DAX is very similar. And that’s what led to this significant rally—very, very significant rally in the DAX and in the Global X.
So the indicators here—a little bit mixed. But once again, buying on a dip is the preferred strategy. The trick here, guys, is keep a close eye on either euro futures, or I would prefer to use the EUR/USD forex pair. If it’s declining, then that could pull the DAX down with it. That’s what you’re looking for.
And it’s difficult for standard indicators to tell us that. But knowing that that positive correlation between the two is quite an edge—in my respectful opinion only. So the TCROSS long here, 4387, the monthly opening price, 4402—that’s where all the support is. So we would be buyers at that particular area. But if we cannot hold that area, then we could see a bigger problem. And that would tell us that the EUR/USD forex pair would also be moving lower.
Bitcoin ($BTC/$USD)
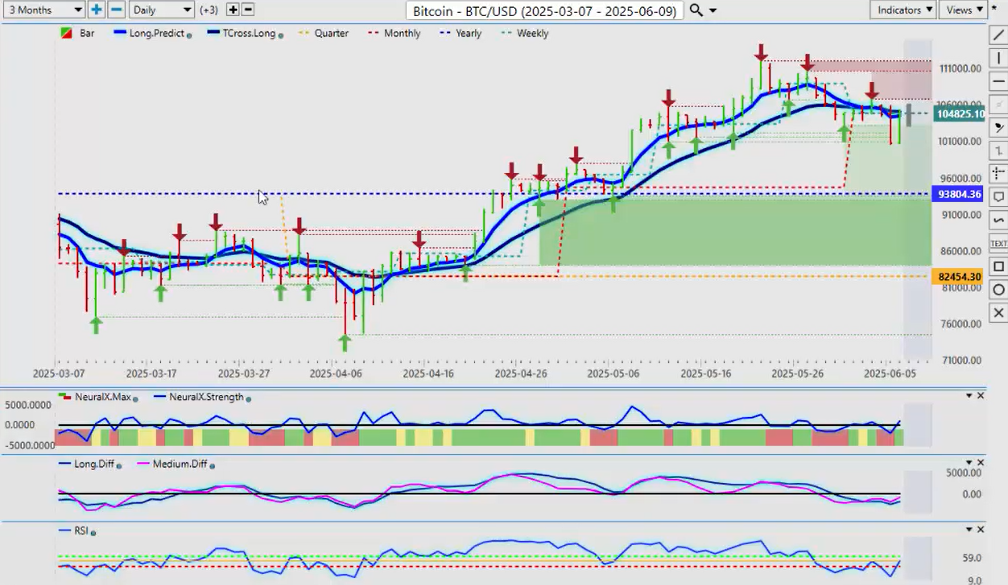
Now, Bitcoin this past week—really struggling here. I suspected this, as I discussed in the last several outlooks—that this is likely a bull trap up here, because it’s not really the time of year that we would see Bitcoin have a big rally like this. It’s more towards September–October. But for now, Bitcoin has tried to recover, but we stalled and finished the week right on the TROSS long, 105,400.
That’s the key level to begin the week. Whether the US dollar is stronger or weaker, I believe that Bitcoin is starting to show that it can rally on its own. Whether it be a risk-off environment or a risk-on environment—they’ve been buying it in either scenario.
So for now, for next week, we can see a little bit of bullish momentum here. We are above the yearly opening price. I do anticipate that we come down and test this level before September 15th when the main rally occurs. But for now, we would have to break through this particular area. We need to turn positive on the month, which is 104,825. We’re closing 104,571, so it’s still struggling here. Bitcoin is definitely struggling from these tops.
But again, I’m okay with buying it—but it has to be above the T-cross long at 105,054. If we can’t get above that, then we have a significant problem and we would likely be heading back—over the weeks and months ahead—to the 90,000–94,000 mark.
Crude Oil United States Oil ($USO)
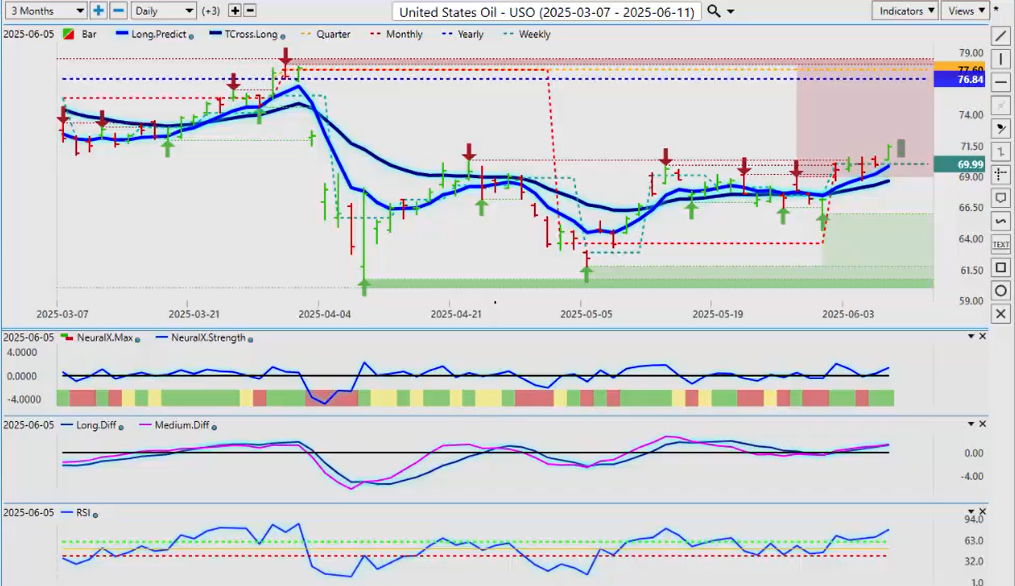
Now, lightweight crude oil, or USO—excuse me, ETF. I’ve been a very strong advocate for buying oil this month. Actually, in the Vantage Point live training room, we started looking at this in early to mid-May, knowing that this seasonal pattern is very repetitive.
So right now, USO doing very well. The indicators are quite bullish here. Now, the key support levels you want to watch here—the T-cross long: 68.63, and our monthly opening price at 69.99. This is the one we want to keep an eye on. But we’ve had a very good close—71.38.
I believe we can start to make a move toward 76. It’ll likely be a slow grind on the ETF side and potentially on the futures side. But in the month of June, usually oil does very well—along with arbop gasoline contracts and Brent Light. As I showed in last week’s outlook—same thing, guys.
The USO covers all of those bases, predominantly. So we’re looking pretty good there. And I think we can potentially move higher over at least the next month. I would be looking again toward that 76 area because there’s not a lot of resistance in here to stop us.
But the main thing is—know your levels on the downside, where potentially there’s always going to be pullbacks in the market. We just need to know where those areas are. And with this particular custom setup in the VP software, that starts at 69.81, then 68.63, our monthly at 69.99—but the yearly is still a problem area. Definitely. But I think the quarterly opening at 77.60 is a reasonable target along with the yearly opening price.
Now, when we look at some of our main forex pairs—all your G7 pairs are basically very similar—either buying or selling US dollars. But there are a couple that are showing they are breaking away from the pack—more specifically, the CAD, the Aussie, and the Kiwi.
Euro versus U.S. Dollar

But let’s start with the EUR/USD pair. The euro holding on to its gains. Now, the other thing the euro has a very, very high correlation to is gold. If gold is moving lower, or if the EUR/USD pair is moving lower, it’s putting that additional downward pressure on gold.
So right now, the euro—basically same thing—if we count back 1, 2, 3, 4, 5, we put a line on there on Monday, you have a fake price on Monday. You can see that the bar on Monday is identical to gold. Literally identical. And that’s what we were looking for—to short both the euro and to short gold this past week.
But next week is a different week. And again, always remember guys, this is a weekly outlook—not a monthly or a daily. It’s for one week. So when I look at this right now, our TCROSS long, 1.1347—that will likely be tested on Monday morning. But that’s not what we’re looking at—we’re looking at Tuesday and the rest of the week.
So we have a Monday–Tuesday reversal which is crystal clear here. Big push up on Monday—we know like gold, we know that’s a fake price—and then we sell it on Tuesday. So if we have a big push down on the euro on Monday, on Tuesday longs are likely viable. So we’ll watch that area.
But the monthly opening price here—1.1353. TCROSS long—1.1347. Know your levels, guys. That’s the line in the sand between the bulls and the bears. The indicators in VP are still moderately bullish on this, so keep that in mind if you’re trading this pair.
U.S. Dollar versus Swiss Franc
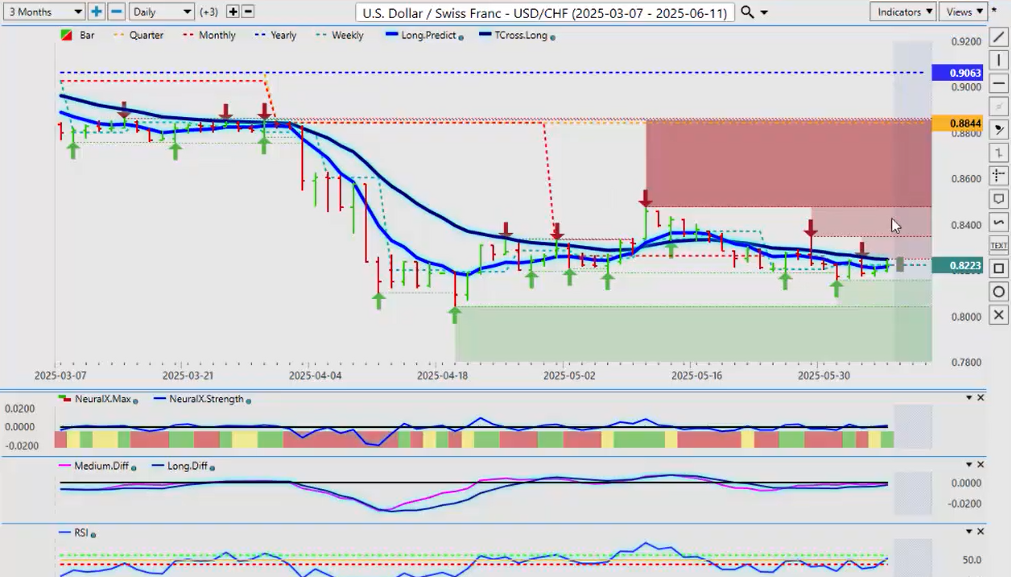
When we look at the USD/CHF (US Swiss franc), we had again a pretty big push down on Monday—or excuse me, down and then we turn around and go right back up on Tuesday. This is an anomaly that happens almost every week in 80% of the markets—that Monday is not a true price.
So your people that are buying gold and they’re very bullish on gold—gold’s going higher—they buy into this on a Monday and then on Tuesday they’re getting stopped out. Wednesday, they’re stopped out. So again, it’s never about being right or wrong in a trade. It’s about understanding the rhythm of the market and key levels to buy and sell from.
So our TROSS long here basically stopped the USD/CHF dead in its tracks at 0.8247. Multiple failures this past week. So if we can break above this T-cross long at 0.8247, then we can extend higher—but it’s very unlikely that we get past the high of 0.8347 next week either way. But it would show signs of life if we can clear the Vantage Point TCROSS long and stay above it.
So that is left to be seen. But right now, there’s still a bearish undertone. The Swiss franc has a very high inverse correlation—particularly to the S&P 500. The S&P 500 drops, the Swiss franc and the Japanese yen strengthen across the board. But if equity markets keep going higher, that will weaken the Swiss franc and weaken the Japanese yen.
That’s what you need to keep an eye on.
British Pound versus U.S. Dollar
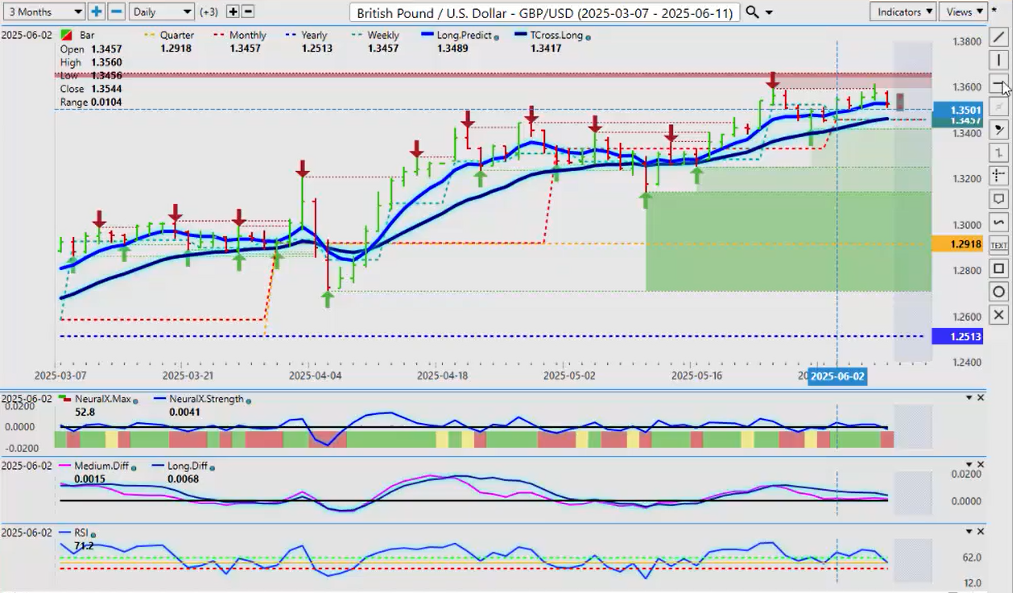
Now, the British pound this past week—very similar, almost identical to the EUR/USD pair. You can see when we count back five days here, we can put a line on here just to show that as soon as we go up hard on Monday, then we’re down on Tuesday again. And then we start to slowly climb for a few days and then fail near that Monday bar high again.
So the pair still remains bullish. Our T-cross long there—1.3462. The indicators are moderately bearish. But again guys, if we’re talking about US dollar strength or weakness in the forex market, in most cases we’re either buying or selling the US dollar, right? So the pound remains firm.
What I like about the GBP/USD here and the areas that I would target for long is that the monthly opening price here at 1.3457 is right on the VPT cross long. So I would argue we may come down to that Monday or Tuesday, but that would be a buying opportunity. We’re firmly up on the year, starting the calendar year at 1.2513.
Once again guys, we don’t want to be looking at a rolling performance model. We need to lock down our areas—the start of the year, the start of the new quarter, the start of the month, weekly opening price even—to confirm based on price, not based on a bunch of variables, particularly headline news.
Because you’ll notice that there’s a lot of headline news and nonsense every single Monday, guys, and it’s used to push the market in the opposite direction of what we should be trading. It is, in my respectful opinion, only. So the pound still, I think, will carry some bullish undertone, but it depends on the next direction of these tariffs and everything else.
U.S. Dollar versus Japanese Yen ($USD/$JPY)
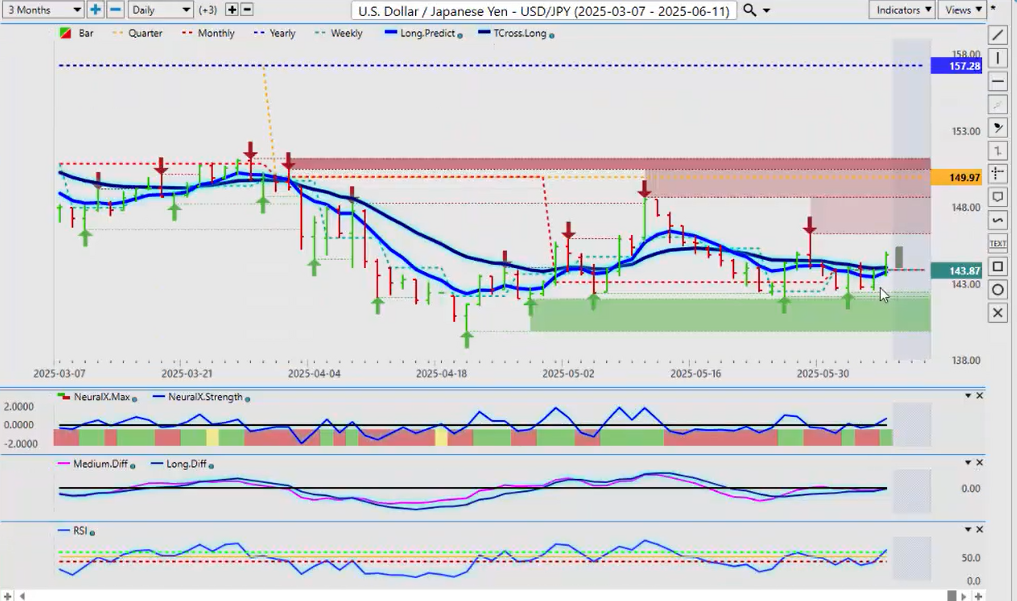
Now the USD/JPY—again having a pretty good size spike here. 1, 2, 3, 4, 5—we can do this in reverse for this particular pair. Basically what it does is it goes down hard on Monday, and you can see it goes flying higher on Tuesday.
That is a Monday–Tuesday reversal that occurs almost every week, guys, and most market participants don’t see it because it’s buried in the media and the headline news to trick you into going the other way. Right?
So the USD/JPY recovers. But again, the carry trade is going to be in trouble this year. I believe the Fed will be cutting whether he likes it or not, so we’ll see. But the USD/JPY, to be clear, is very bearish on the year. Very bearish.
So any move lower in the S&P 500 would immediately put this back into its predominant downtrend. Now, the downtrend I’m referring to is 2025. We’re not in 2022, 2023, 2024—we’re in 2025, guys. I don’t care what happened back then. This is what we’re dealing with today, right?
In 2025, the USD/JPY is very bearish. Do not let anybody tell you differently. If you take it from the yearly opening price—the calendar yearly opening price—and you measure this, it’s very difficult to say that this is in a big uptrend or that it’s bullish. It’s down almost 8% on the year.
The yen is doing very well this year against the dollar. Or, you could just say the US dollar is doing very poorly across the board—which it is.
So again, the indicators are moderately bullish here for the yen, but I suspect maybe a push toward the most recent verified resistance high at 146.28. Then we turn back down.
Now the Aussie, the Kiwi, and the CAD—very, very similar trade. The unemployment numbers out of Canada on Friday—far worse than the US. The US numbers were much better. But the Canadian dollar has a strong correlation to oil.
U.S. Dollar versus Canadian Dollar

Oil—this is going to be, already is, a good month for oil this month. That means it should be a decent month for the Canadian dollar too. But that is likely to be short-lived. But for June, the Canadian dollar does carry an edge.
So our retracement points here—1.3782. Yearly opening price—1.4380. The Canadian dollar is doing surprisingly well. Looking at the Canadian economy—it is doing actually very well considering. So again, we’ll continue to monitor this.
The retracement points—they start at 1.3712 (this is the F8 on your Vantage Point software), then 1.3782 (the T-cross long). We come up to our quarterly, monthly, and yearly opening price. So we have—and even the weekly—very, very stiff resistance in these areas.
But right now, the only thing I would warn of is this MA diff cross that occurred back here, and it’s been flatlined as the market is moving lower. This kind of divergence and a rising neural index strength—that’s usually a warning sign of a potential reversal. But I think that reversal will be limited to the TROSS long and the long-predicted at their respectful levels.
Australian Dollar versus U.S. Dollar
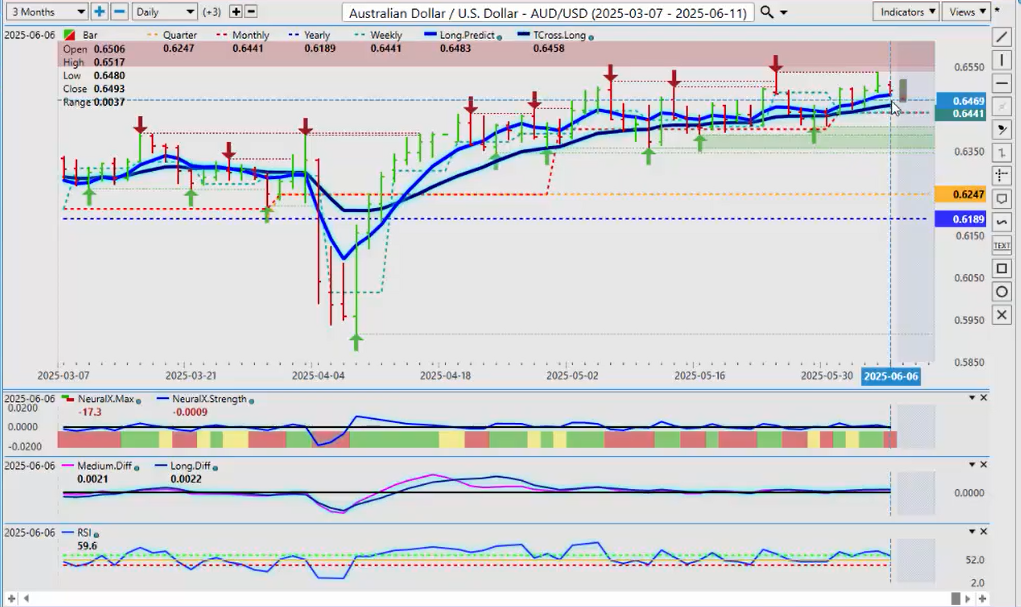
Now the Aussie—in most cases here guys, most cases, nothing is 100% in any type of trading or investing—but in most cases the Aussie does very well in the month of June. Actually, very well.
And you can see it’s come out of the gate swinging, right at the monthly open. And this is another reason why we avoid rolling performance models or comingling months. The start of the month is where all the action is, guys.
So that’s where we need to say, okay, are we getting into this thing? A lot of people will sit on the fence, and they’ll catch the rally late—where the beginning of the month is really where you want to focus on it.
So if I’m holding above the monthly opening price, and I know that historically based on seasonal patterns that, for whatever reason—and it could be a million, we could debate this all day long what that reason is—but the fact of the matter is the Aussie is usually pretty strong in June. And it’s showing that already.
Now there are significant headwinds up here around 0.6537, but I believe we can break through that area. Potentially these tariffs are a concern, but structurally—0.6189, 0.6247—structurally this thing looks really good.
You’ll notice that retracement point is almost identical to both the DAX 30 and the S\&P 500. So that very quickly tells us our intermarket correlations and what to watch for.
Most people will throw 50 different indicators at something—where I will throw core indicators, and then I will look at seasonal patterns and intermarket correlations. That’s the basis of what I’ve learned from the Vantage Point software and apply it to my trading and investing.
So again, we’ll monitor this. But I would argue it would be very helpful if the equity markets kept going up, and that would support this. But structurally, it looks quite good.
New Zealand Dollar versus U.S. Dollar
And so does the Kiwi—very, very similar trade. I would argue the Kiwi may be a little bit stronger. Maybe warning us that the Aussie is going to play catch-up a bit here.
But the Aussie—same thing. We look at our downside retracement points from where we are now before we enter—not after. So 0.5975. The yearly is pretty much a nonissue right now, but the monthly is the one you want to keep a very close eye on—0.5974.
As long as we’re holding above that monthly opening price and we’re positive on the month—well, we know we’re positive on the quarter, we know we’re positive on the year. So if we make a price-based assessment and say, okay, what is the real trend here—not in 2023 or 2021—in 2025, where are we sitting?
Well, we can easily draw a performance model from the calendar yearly opening price and tell us exactly where we are. There’s no arguing with this, guys. It’s price-based. It’s not subjective—it’s objective.
So if I look at that and say, hey, the Kiwi and the Aussie are having a very good year this year—but what about the month? This is where people tend to get all discombobulated with throwing in different performance models.
But the reality is—even if we look at the close from Friday—then we can quickly assess on the month, the Kiwi is up 6.7%. That’s actually very good for a currency, because we’ve also had multiple retracements to buy off the Vantage Point long-predicted every single day this past week.
So, likely more choppiness coming next week as the tariff arguments heat up. But with that, there will always be opportunity.
So with that said, this is the Vantage Point AI Market Outlook for the week of June the 9th.


