


Hot Stocks Outlook for the Week of
April 10, 2020
The Hot Stocks Outlook uses VantagePoint’s market forecasts that are up to 87.4% accurate, demonstrating how traders can improve their timing and direction. In this week’s video, VantagePoint Software reviews forecasts for Boston Beer(SAM), Bank of New York (BK), Electronic Arts (EA), Arena Pharmaceuticals (ARNA) and Treehouse Foods(THS)
Register for a Free Live Training
This Week’s Hot Stocks Outlook
Hello again, traders. And welcome back to the Hot Stocks Outlook for April 10th, 2020. Hope y’all are having an excellent week out in the financial markets. And as always, plenty to cover in this week’s outlook. So we have a nice cross section of stocks here. We’re going to start here with Boston Beer, Sam Adams. We’ve got financials here, with Bank of New York. Technology with Electronic Arts, Arena Pharmaceuticals, and lastly Treehouse Foods. So starting here with Boston Beer, what we have here as always this daily price action. So each one of these candles represents a full and complete trading day. So we’re looking at a few weeks of price action. And right up against that price data you’ll see that there is a black line and also a blue line in addition to some other indicators that we’ll go ahead and cover shortly. Now, the black line that you see against the chart, that is a regular old, simple moving average, very common technical indicator.
Boston Beer (SAM)
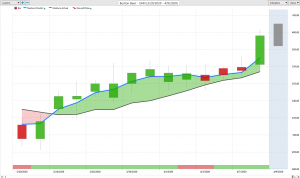
We refer to it as the actual simple moving average. And the problem is with an indicator like that is that it’s only looking at past prices, right? It’s only able to look at previous closed prices, add them all together, divide by that number and sort of roll that forward. But, that tool acts as a very good measure of where market prices have been. But, obviously as traders we need to know where are prices going moving forward. So what we want to do is actually compare that black value on the chart to this blue line value. And for this number to be generated each and every night, VantagePoint is performing what’s called intermarket analysis and utilizing the technology of artificial neural networks to do that. So what that means is rather than just looking at shares of Boston Beer, we understand that there’s important market relationships between markets.
And what this technology is able to determine is where are those significant market relationships? So this can be in things like individual stocks, this can be in ETF groups, right? This can be in global indices like the S&P 500 or global currencies, global interest rates. And it’s able to utilize that information and actually generate predictions for the market in question. In this case, Boston Beer. And that predictive data that’s then generated is actually built into the value of these indicators. Turning what was a lagging indicator that’s only based on the past into a forward looking predictive tool. So whenever this blue line value crosses above the black line, it’s suggesting that average prices are going to start moving higher. And you would therefore want to look to go ahead and take a long position in the market. Now, in addition to that predicted moving average, it gives you the overall trend direction.
There’s a couple of other indicators here. You’ll see at the very bottom of the chart you have this line that can go from green to red. And again, this is updated every single trading day. And how this indicator works, this is what’s called the predicted neural index, is it’s also utilizing that intermarket data and that technology. But what it’s doing is only forecasting 48 hours ahead. So you can think of it as very short term strength or weakness in the market to help you with those trade management decisions while you’re involved in an opportunity. And lastly, to really round out the forecast is you’re also provided with a predicted high and a predicted low before each and every trading day. So when you’re looking and deciding, okay, well where should I get involved in the market? Where should I set my limit orders or profit targets?
You have that intraday level, again, derived via the neural network technology pointing out those intraday levels for you to go ahead and take action in. So once you have the overall trend direction, short term strength or weakness, and also a prediction for the next day’s range, you can utilize all of those tools to take positions and manage your opportunities. So you see that once that crossover move to the upside, we can see exactly how accurate each one of these daily predictions are. And when you’re buying at or near the predicted low, you’re getting a really great entry. Assuming of course, that the overall trend is up as well in a trending nice opportunity here, right? So in shares of Boston Beer we see we have this crossover move to the upside and we’ve seen just a lot of markets, when we talk about correlation and relationships between markets, what we’ve seen a lot of the market turnip together as far as the S&P sort of bottoming out and a lot of these different areas in the market start to turn higher.
And this gets very evident when you have a tool like this because we can actually utilize this scanning feature to scan the entire market and understand when are new crossovers coming into the market, when is the overall trend direction shifting and changing so that we can act accordingly. So really nice opportunity, shares up about 20% just in the past 11 trading days there in Boston Beer, it’s only a couple of weeks in a market time here. Wanted to bring in Bank of New York, just again, highlight really what’s happened here. So we had this situation where all of these crossovers moved to the downside towards the tail end of February. And it was very clear that, look, if you want to make money in this market, you’ve got to go ahead and look to get short. Buy some put protection, whatever it is, and we had multiple opportunities here to be shorting a market like this and making a lot of money as the market declines.
Bank of New York (BK)
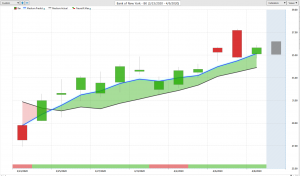
But, we want to stay aware of how things change. And again, that IntelliScan feature really bringing in a lot of markets around this same time period. Here, we see a March 25th, in this case as far as shares of Bank of New York and a lot of the other financial stocks as well, getting that crossover to the upside. A lot of strength from the neural index coming through and suggesting you want to go ahead and look to take a long position, utilize those predictive tools of the predicted highs and lows to get a good entry, right? So if you’re going to take that shot and say, “Okay, well now I want to get long.” Well, what prices should you accept? And you see this being a very great entry price to go ahead and start taking positions, not only as far as the price you’re getting, but on a daily timeframe that that’s the day that you really want to come in and start recognizing that, hey, there’s some opportunity here to the upside. Shares up already about 15% just in the past 10 trading days.
Obviously, these declines though very significant. What’s so important as a trader is recognizing not only that area to go ahead and start shorting the market, but when to cover those positions and take that 32%. And just think about it, if you’re going ahead to shorten the market, making 32 plus percent of the downside, now you’re already up plus 10% to the upside and can trail stops and make money as the market recovers. Here in shares of Electronic Arts. So an interesting opportunity here where you see that these lines are really on top of each other, but I wanted to bring this through to really highlight how the scan is only going to look and say, “Look, that blue line is crossed above the black line.” You see it remains above the black line during the duration of this move and you’ll notice that even with this huge range as far as volatility as the market bounces up and tries to find a direction.
You’re never breaking down to new lows, right? So VantagePoint’s doing its job here in suggesting, look, the trend has reversed. The overall trend is now to the upside. Use those shorter term VantagePoint tools again to manage the opportunity. And you see that even with this big range coming through, those predicted highs and lows are doing a good job of saying, “Okay, well let’s get back on track, make sure we’re pointing these things out.”
Electronic Arts (EA)
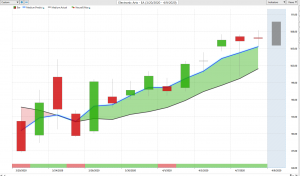
And where there’s a really great benefit of this is you see with all this volatility, you get this big up day, well then you get that analysis from the software to say, “Okay, well what’s happened not only in Electronic Arts, but all of those related markets?” And therefore, let’s get these predicted highs and lows back on track so that every single day you have this good guidance to go in and say, “Okay, well where should I be looking to take a position? How should I be managing my current positions?”
Whether that’s adding to the position or taking profit along the way. But again, really nice opportunity here. Shares up over 12, almost 15% here since these crossovers came through and started rolling things to the upside. So really nice opportunity there. But, you see very similar opportunities, right? The broader markets have recovered and that’s what the IntelliScan really helps you identify, right? So when we look at really the hot stocks outlook from two weeks ago, what were we starting to do? Say, something’s going on alongside of this market. Let’s look at shares of Amazon. Let’s look at shares of these other companies that are actually starting to move up. And therefore, you want cover those short positions and really transition the portfolio to not 100% short, but actually taking long positions and now benefiting as the bull-ish side of the market takes hold and things move higher in that case.
So really, pretty much perfect time over the past couple of weeks to sort of transfer that portfolio or modify it a little bit as far as the types of positions involved here. Here’s Arena Pharmaceuticals, exact same thing here. We get this crossover to the upside around the same period of time. And what I really love pointing these things out is you see the accuracy of these tools as a group here, right? So the overall trend is clearly to the upside with that blue line crossing above the black line. But, look at this neural index highlighting that, hey, there’s some weakness over the next couple of days. As a trader, that’s very important to understand that because you can say, “Okay, well if I still want to be a buyer here and the overall trend is up, well I should try to get some reduced prices on my entry.”
Arena Pharmaceuticals (ARNA)
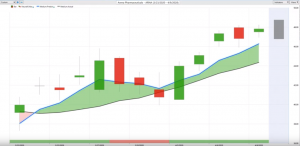
Understanding that, hey, there’s weakness over the next couple of days, but the trend is up. Well, what does that have you doing? It has you buying at a reduced price right before that uptrend is ready to continue. So you see within a day market immediately moving to fresh, new highs, and that overall trend continuing. And again, as long as that blue line, in this case remains above the black line, the overall trend is still in place. You actually see some really nice entries all the way back here to get involved. Market’s up 15%, really since these crossovers came through, even more so. Yeah, about 15% rally. And a lot of these pharmaceutical stocks, again, have rallied just about that same degree, about 10-15%, just in the past couple of weeks here. So again, covering those short positions, getting out of the way and really getting some of that portfolio to the long side.
Treehouse Foods (THS)
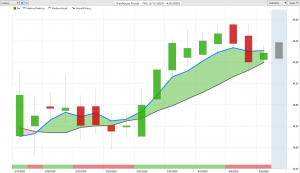
Here in Treehouse Foods, again, very similar situations in really almost all of these charts. And that’s just what you’re seeing is so much of the market is correlated. So if we’re going to speak to those intermarket relationships that you can see how Treehouse Foods are Boston Beer, these things are related to those ETF groups, those individual stocks, the S&P 500, and the broader markets are going to have an impact on all of these individual shares. So here in Treehouse, I see a lot of volatility, but again, that blue line remaining above the black line suggesting the overall trend is to the upside. You’ll see you get those periods where you want to be aware that, hey, there’s likely some weakness over the subsequent 48 hour periods. Once everything goes back to green, you see this overall trend moving higher and a better opportunity to trade more of the breakout in that situation.
Again, you see it happens again here towards the tail end of the move. Neural index gets bearish here, some more weakness over the next couple of days, but the overall trend still very much to the upside. So Treehouse Foods, another one of these great opportunities here where over the past couple of weeks we’ve seen a really nice moves higher, about 13% just in the past 13 trading days, or about $5 a share. Again, 500 shares, you got about $2,500 a move.
Whether you’re buying options, it became very clear over the past couple of weeks if you want to buy some call options, if you want to get that bullish exposure, really the good time to do it is over these past couple of weeks where all these crossovers come through IntelliScan and really get you alerted to, hey, something’s going on there. Let’s start transitioning the portfolio away from that completely sort of bearish outlook that we had when all the markets started to turn lower. So once again, this has been our Hot Stocks Outlook for April 10th, 2020. Thank you all for watching. Best of luck and bye for now.


