


The Hot Stocks Outlook uses VantagePoint’s market forecasts that are up to 87.4% accurate, demonstrating how traders can improve their timing and direction. In this week’s video, VantagePoint Software reviews forecasts for LockheedMartin(LMT), Autozone(AZO), Home Depot(HD), Ford Motor Company (F) and Northern Oil and Gas(NOG).
Register for a Free Live Training
Hello again, traders, and welcome back to the Hot Stocks Outlook for April 2nd, 2021. Hope you’re all having an excellent week out in the financial markets. And as always, plenty of opportunities to cover here.
And really just continuing on with the theme over the past several weeks here, we’re going to take a look at Lockheed Martin. We’ve got AutoZone, Home Depot, some stocks doing really well. And then we’ve got Ford Motor. Starting to see some cracks in the overall stock indices, and a lot of different areas of the market starting to weaken, and things that have just straight up reversed lower. So we’ve seen oil and gas, energy stocks, energy, the commodity crude oil start to turn lower. And that’s opened up opportunities to short the market and hedge your overall portfolio here.
LockheedMartin (LMT)
But starting out with shares of Lockheed Martin, a really good example of how all of this works, regardless of which market you might be trading here. So, what we have is daily price action. So each one of these candles represents a full and complete trading day. All of these predictive indicators work off of that end of day approach as well. But what you have right up against that end of day data is a black line and also a blue line. Now, the black line that you see there, that’s actually a regular simple moving average. So a very common technical indicator. And in this case, we use that really just to smooth out the price action and let us know where market prices have already been over a given period of time. But obviously, a trader needs to understand, well, where are market prices likely to go moving forward.
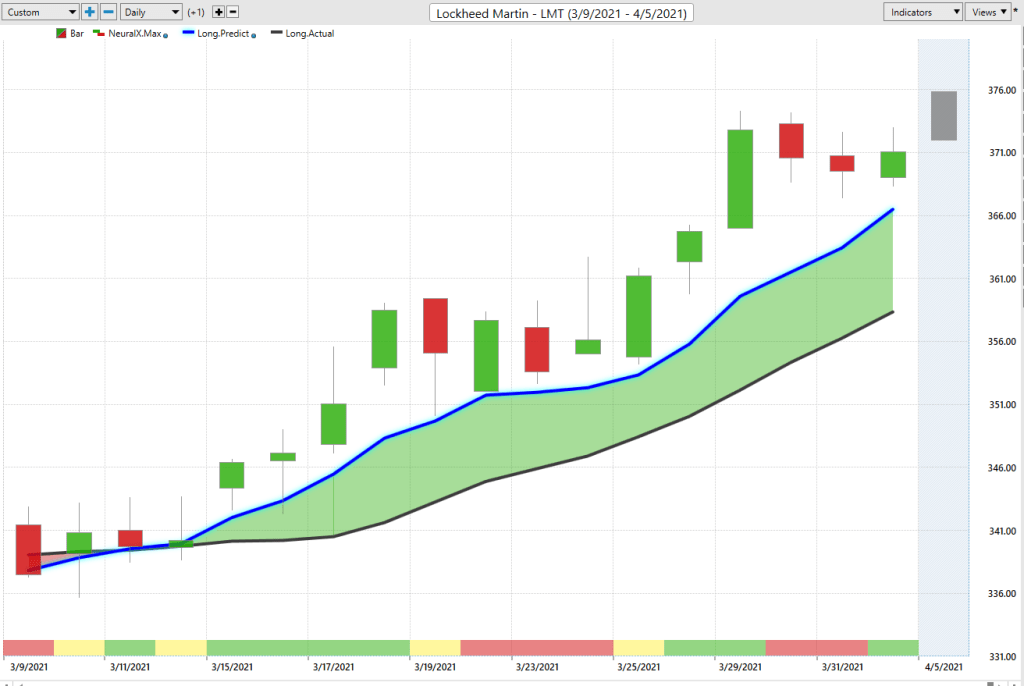
And so to make that determination of where the average price is likely to move up or down, we compare that black line to this blue line. And that is actually VantagePoint’s proprietary, predicted moving average. And so for that number to get calculated and plotted against the chart every day, VantagePoint is doing what’s called Intermarket analysis and it’s utilizing the technology of artificial neural networks to do that. So what that means is, specifically for Lockheed Martin, VantagePoint has identified Intermarket, so that’s ETF groups, futures and commodity markets, currencies, global stock indices, individual stocks, how they all specifically affect this target market that you might be trading. So again, that’s like the S&P 500, ETF groups, stocks, currencies, interest rates. And it understands, whether it be positive relationships, inverse relationships, leading or lagging relationships, how that affects future prices. And it uses those relationships to actually generate future price predictions. So what’s going to occur in the next few days as far as average price, short-term strength or weakness in the market, and also a predicted high and a predicted low candle here.
So whenever we see that blue line cross above the black line, it’s essentially saying, “Look, VantagePoint is saying average prices are going to be higher than where they’ve been. Therefore, look towards getting long in the market, or taking out long positions.” Now, as long as that blue line remains above the black line, the overall trend is determined to be up. And you, therefore, want to go ahead and look to get long.
Now, at the very bottom of the chart you see this bar that, at the very right-hand side, that’ll get updated each and every trading day as well, after the end of the trading day. And this is tuned to look ahead very short-term, just 48 hours into the future, is for a short-term strength or weakness. I tend to look at this indicator and say, “Okay, well, over the next 48 hours, should I expect higher highs relative to the close, higher closes, or higher highs, or lower lows relative to the close?”
And so that can be really helpful with trade management. So it also has a extremely high level of accuracy, over 80 plus percent accuracy on average, across really all markets here, at getting that very short-term strength or weakness part of the equation correct. So whenever we see that blue line cross above the black line, neural index bullish, you’ll see here it does get bearish. You get a little bit of the sideways price action over the subsequent 48 hour periods. But overall, you then want to look towards VantagePoint’s predicted highs and lows. And so what we can do is actually look back, this being the most recent prediction for actually today, and we can see how accurate have actual market predictions been against the actual price data.
And so going into a directional trade, we’ll say, “Okay, well I want to go ahead and get long,” you’ve got this roadmap that gets updated each and every trading day to say, “Okay, well, how have things shifted?” You see after this trading day occurs, the software comes in and says, “Okay, expect the predicted high and low range to be higher tomorrow. If you want to be a buyer, look towards at or near this predicted low.” And same thing here, right? Predicted low, expect the market to trade down here and also expect some overall weakness from this point forward. And this is what’s going to let you be able to get involved in a position, add to that position where appropriate, but also potentially take profit on the upside with the help of those predicted highs.
And you see overall, this isn’t a hugely volatile stock here with Lockheed Martin. So you see overall, we’ve gotten about a eight, almost 9% rally here, but there’s also been ample opportunity to be buying, taking some profit, and potentially using those profits to get more aggressive as that overall trend continues. So over that 9%, potentially you can pull a little bit more out of that with taking some profit, buying back in at lower levels, and managing that overall trend.
Autozone (AZO)
Here in AutoZone, again, very similar. Really strong crossover to the upside. Neural index bullish. See, over the course of the forecast, you’ll get these periods where neural index will go bearish, but over the entirety of the forecast here, this being very accurate as far as forecasting, the overall trend is up. Neural index is very bullish over this time period. There may be little bouts of weakness here. But generally look towards values like VantagePoint’s predicted lows to guide you every single trading day.
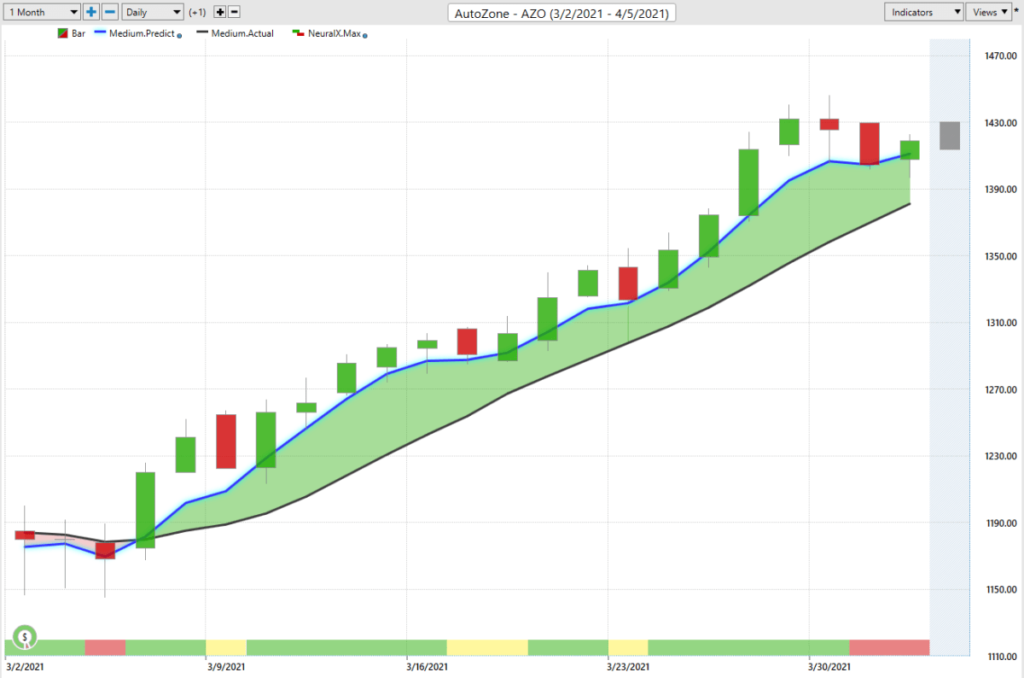
So what happens here and what’s really helpful is you get the close of the trading day. So let’s just say we come into here. It’s like the market closes down here and that’s where VantagePoint looks at those intermarket relationships and says, “Okay, well, how are those affecting future price action in the very short term just tomorrow?” And then keep updating that. All right, now things have closed again. Let’s look at those up to 25, 30 intermarket relationships that are known to affect the target market and understand, okay, how is that affecting future price so that you can keep adapting and staying up to currently what’s going on in that market, and helping you pull the most out of that opportunity.
So overall here, we got a nice move in AutoZone. Again, not enormous moves or anything. But certainly if the market moves up 15% in just the past 16 trading days, you want to be a buyer in that market over that time period and have those levels to help guide you as far as getting involved.
Home Depot(HD)
And then of course, taking profit. Or whether just hold the position and let that overall trend continue. Home Depot. So the thing with these opportunities on the bullish side that are doing well, they’re doing obviously well, right? There is very clear crossovers as far as the overall trend, as far as that distance between the blue and the black line. A little couple of blips here where neural index goes bearish. But overall, extremely bullish forecast here for shares of Home Depot.
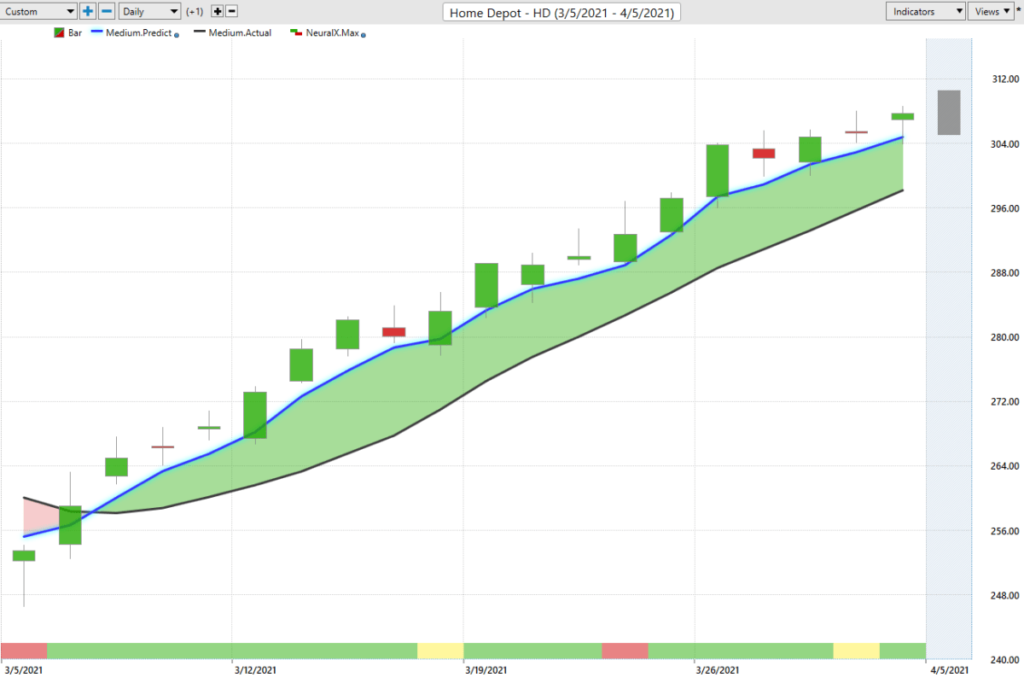
Again, we can look at those predicted lows and we get these pretty nice levels coming in, a little bit of choppiness here where… Even like days like this are actually great when you’re using a tool like this, because you come in and say, “Okay, well, I’m willing to buy down here if I’m going to be a buyer.” And you just get filled at the open, and the market almost immediately from that point forward trades in your favor. Again here, you see we opened pretty much that price. A little bit of swings in price action. But just closed higher, move higher, and meander on there. But really nice opportunity there. Pretty straightforward, very similar to Lockheed, very similar to AutoZone.
But what’s been more interesting is the potential weakness in the market. And so getting long, it’s very clear as far as those forecasts where’s the strength, what sectors are showing strength. So a lot of that has been like consumer staples we looked at last week. That’s another area as far as like the cereal companies and McCormick brands and Johnson & Johnson, things like this doing fairly well.
Ford Motor Company (F)
But here, Ford Motor Company, and a lot of stocks over the past couple of weeks, this is very similar to where crude oil started to show some problems. But seeing that crossover to the downside. A lot more choppiness here as far as the neural index. You see you get bullish here, you get then just a really aggressive move lower. Bullish again here, bullish again here. The overall trend very much bearish here. And this has now been really two full weeks, as far as overall trading here.

Very straightforward that all you want to be doing in a market such as this is look towards those predicted highs, look for those moves higher to go ahead and get short. So you see again days like this where you come out of the range a little bit. Those updates letting you know that, “Okay, well, expect you can trade up there.” So don’t have your stop sitting in the wrong place or anything like that. But again, getting those forecasts, helping you along the way, whether it’s getting short or taking profits on the downside, and hedge that portfolio as far as having some areas where you’re short, potentially some stocks out there. So if the bottom really starts to fall out, have some things that potentially really pay off.
Northern Oil and Gas(NOG)
And a big part of this has been energies. And this is just a perfect example of the VantagePoint software here. So what VantagePoint’s able to understand is, specifically for the stock that you might trade, whether it’s Northern Oil and Gas or any other energy stock or crude oil, the commodity itself, what are these other markets, whether they be oil sector, ETF groups, whether they be the commodity markets, whether they be just the value of the currency itself, the commodities traded in. And it looks at these intermarket relationships and understands that, okay, well, these things are going to weigh heavy on the future price of a stock like Northern Oil and Gas.
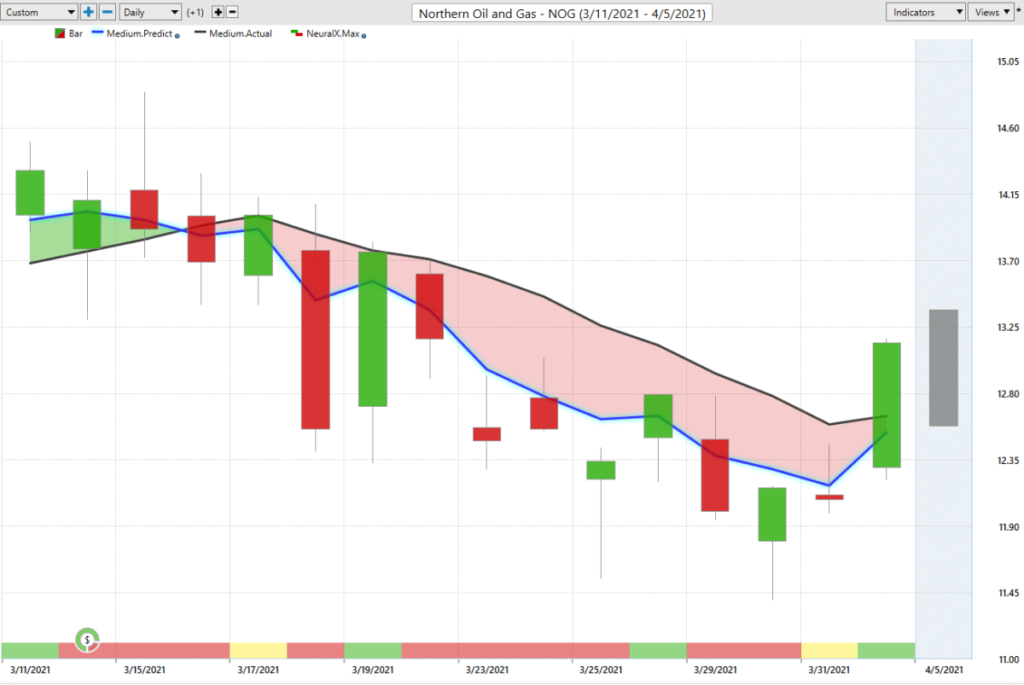
And so as that crude oil contract starts to roll over, what’s going to help this forecast get a very early detection of that trend reversal, but not only that, once it detects that reversal, give you those updated predicted high and low levels, truly help you manage the opportunity as it progresses. So you see here, we get this crossover really towards the midpoint in March. And again, with those shorter term levels, as far as those predicted highs and lows, those are going to help you say, :Okay, well, you can really only short and take profits on shorts in a market such as this,” and nothing much has really changed here.
So it’s actually really interesting currently what’s going on with crude oil. You’ve had a move higher to some very important levels, but the overall trend is still down. And that’s what you want to be prepared for, to have just the right levels on a consistent basis intraday to make some good trading decisions, get some good entries, and see more of your trading style and approach, as far as timeframe or strategy, pay off with some more accurate forecasting. So once again, this has been our Hot Stocks Outlook for April 2nd, 2021. Thank you all for watching. Best of luck out there. Thanks again, and bye for now.


