


Register for a Free Live Training
The Hot Stocks Outlook uses VantagePoint’s market forecasts that are up to 87.4% accurate, demonstrating how traders can improve their timing and direction. In this week’s video, VantagePoint Software reviews forecasts for Nvidia ($NVDA), Fiserve ($FI), Humana ($HUM), CleanSpark ($CLSK), United Health Services ($UHS), Lululemon($LULU)
Hello again traders and welcome back to the hot stocks outlook for August 22nd, 2025. I hope you all have had an excellent week out there in the financial markets if you’re doing any trading. Uh, and of course, we’re here to take a look at the most recent Vantage Point AI predictive forecast. So, if you haven’t already, be sure to go ahead and click on the link down in the description below, and you can get yourself signed up for a live demonstration, learn all the specifics about how these predictive technologies and tools are helping traders navigate the markets and make much better trading decisions.
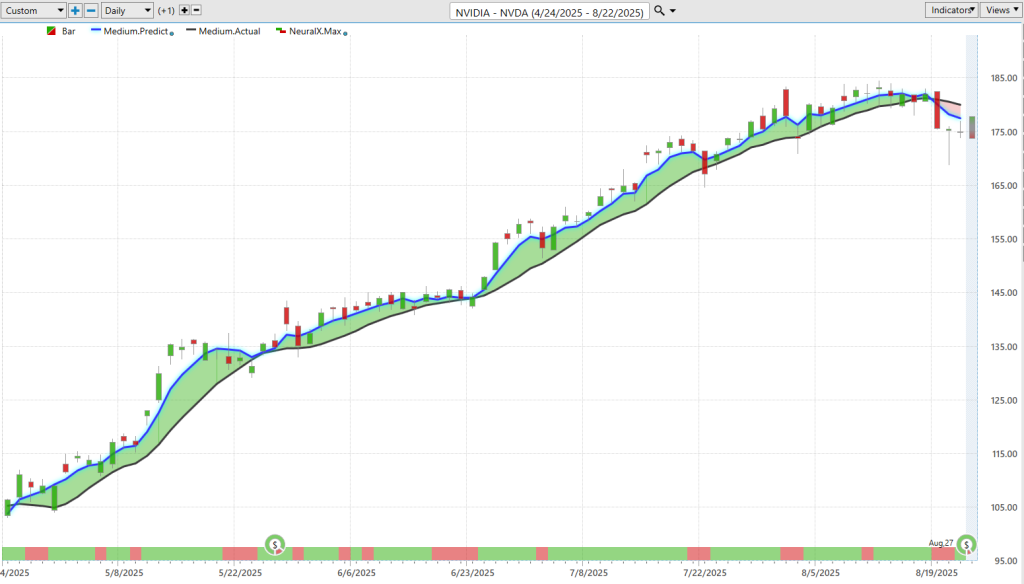
And so, uh, we’ll go ahead and start out with a very popular stock here, shares of NVIDIA, and really highlight how all of these predictive indicators work together to round out this predictive forecast. And so, what we’re looking at here is daily bars and candles, right? So, each one of the candles that you see on the chart is going to represent a full and complete trading day. And it’s right up against that price data that the first thing that should jump out to you is this black line and also blue line value.
And so, what we have with the black line value is a simple moving average. So, a very common technical analysis indicator. Um, in this case, it’s a 10 period. So, it takes the previous 10 close prices, adds them all together, and divides by that number. But one of the weaknesses with traditional technical analysis like this is that all the data comes from the past. So, it’s really just reconfiguring what’s already occurred in the market. And additionally, it only looks at one market in isolation, right? So, it has no predictive capability. It has no way to look at other markets and how they might drive future prices of NVIDIA.
And so, what Vantage Point traders are able to do is use that as our baseline, right? Letting us know again where market prices have been. But what we want to focus in on is the value of this blue line value. And for this number, which we can think of as a price, for it to get calculated and plotted on the chart every evening for traders, well, this is where that technology of artificial neural networks step in and they’re performing what we would call intermarket analysis.
And so, what that means is that rather than just reconfiguring past prices, neural networks are looking at other markets that share valuable price relationships with NVIDIA, whether they be leading or lagging relationships, positive or inverse correlations, and it’ll really look at dozens of markets, taking in huge amounts of data and looking for those relationships to generate its prediction. Now, it can look at things like ETFs. So, we have like things like the XLK technology ETF. It can look at specifically individual stocks which share these important market relationships. But it really takes this global, right? So, it can be looking at things like the value of currencies are very important for stock performances. Uh, we got the value of global interest rates and even, where applicable, certain commodities. So, if you’re trading a gold mining stock or oil refinery, these things all become very important and offer some very valuable price clues on what is happening next.
Uh, and so, as these neural networks take in this huge amount of data, they use that information to generate predictive indicators. So, whenever we see that blue line cross above the black line value, it’s letting us know that average prices are expected to start going higher, and traders may look to want to take a long or bullish position. And we see here that really crossover to crossover here for the past, uh, 78 trading days, NVIDIA has risen 68%. Very clearly this market in an uptrend.
But more recently, we’re seeing things shift. And that’s what I want to highlight is how these shifts are happening, how Vantage Point can potentially get you ahead of these opportunities, whether it’s taking profit on something like NVIDIA or identifying new opportunities in the marketplace. Uh, and so, in addition to that predicted moving average, you’ll see at the very bottom of the chart, you see this bar that goes from green to red, back to green. Well, this is also being updated every trading day, but it’s tuned to solve a different problem.
So, it’s utilizing those artificial neural networks, but tuned to solve a problem just in the short term, looking for short-term strength or weakness over the next two trading days or 48 hours. And so, you’ll notice here that as that neural index goes bearish, you sometimes get sideways or declining price action. But in the context of that blue line remaining above the black line, we know the overall trend is still bullish here. Uh, and so, traders can use that to help with very short-term, uh, trading decision-making and really know what to anticipate over the next couple of trading days and not get kicked out of their position, uh, on temporary weakness here.
Now, lastly, to really round out the entirety of these forecasts, you’re provided the Vantage Point predicted high and predicted low. And so, this is where things get very exciting for, uh, day traders or just managing a position or swing trade. This gets down to intraday, uh, levels identified via those neural networks. And so, uh, as we go back and look at all of these predictions knowing that look, NVIDIA is in an uptrend, where do you want to be looking to accumulate a position? You see that there is going to be numerous opportunities here. I’m not going to go back and count, uh, because we’re probably looking at 20 plus situations where you move down to that predicted low and then the uptrend resumes very, very quickly.
And so, uh, again, to capture that 67%, well, it’s often good to get a nice position on, but you can potentially get more aggressive when you don’t have to risk a huge amount because you’re getting exceptional weekly price levels to participate in the market. Uh, and then, of course, more recently we see after that crossover to the bearish side, well, we’ve scooted up to the predicted high and you see how the market responds from that level already shifting to the lower side here. And so, uh, we’ll see what happens here. We’re going into earnings. But it is pretty interesting that last earnings report, well, the blue line remained above the black line and the uptrend continued, uh, as we had a lot of tech stocks really looking very bullish over that time period.
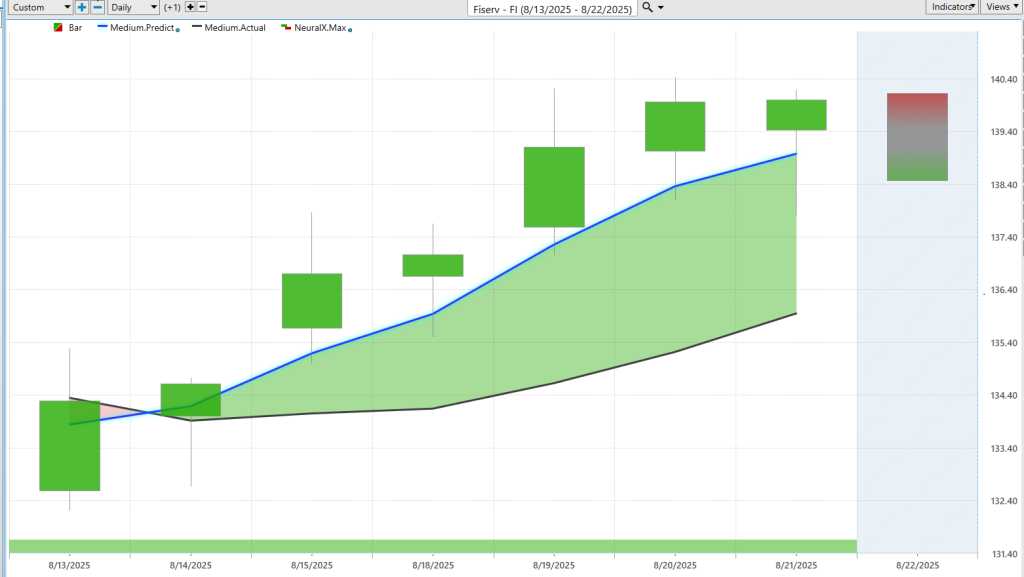
Now, uh, more recently, well, there’s new opportunities. So, here’s Pfizer stock that’s been beaten down over the past few months. Uh, but here we see blue line crossing above the black line, neural index very bullish here, and we see we get this nice persistence as far as momentum and trend in the market. Uh, and of course, we can look at those Vantage Point predicted highs and lows. Uh, and you see how this works. You get very great short-term levels. Uh, and even just yesterday, the market scooting down to the predicted low, trading up about 1 and a.5% or so. Uh, and very clearly, trend-wise, things look to be in pretty good shape. So, uh, pretty nice move here on the bullish side here.
Uh, we’ve got, uh, 4% move just in the past six trading days, uh, from those predicted moving average crossovers.
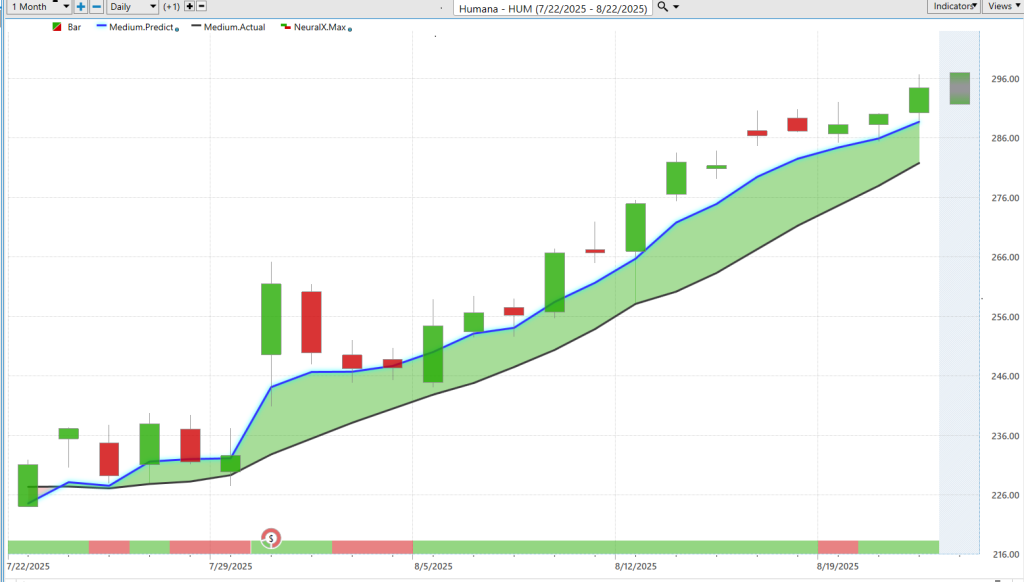
Uh, here, shares of Humana. And I just wanted to actually bring this through to highlight really the updated forecast. Right? So, we understand that hey, healthcare is doing well. We looked at United Healthcare last week. Uh, but here we see Humana, that blue line above the black line. You get a little bit of a, a, you know, conflict here as we go into earnings, but very clearly again that blue line above the black line. And once you get post earnings, you’re pretty much right on target here.
A little dip from the neural index, then that momentum kicks in, and really things pick up in the marketplace. And so, we can take a look at, well, in the short term, how have these predicted highs and lows performed since last hot stocks outlook? Well, you see here we’re getting a gap up, uh, last Friday. Uh, here’s Tuesday, here’s Wednesday. Uh, and the trend persisting to the upside. So, pretty exciting stuff there in shares of Humana. And again, just highlighting managing an opportunity, right? If you want to potentially add to a position or just do a short-term day trade, these tools are very exceptional at getting you those nice entry prices, uh, and not having to risk a huge amount to participate in an opportunity.
So, now we’re up about 28% here just over the past 21 trading days.
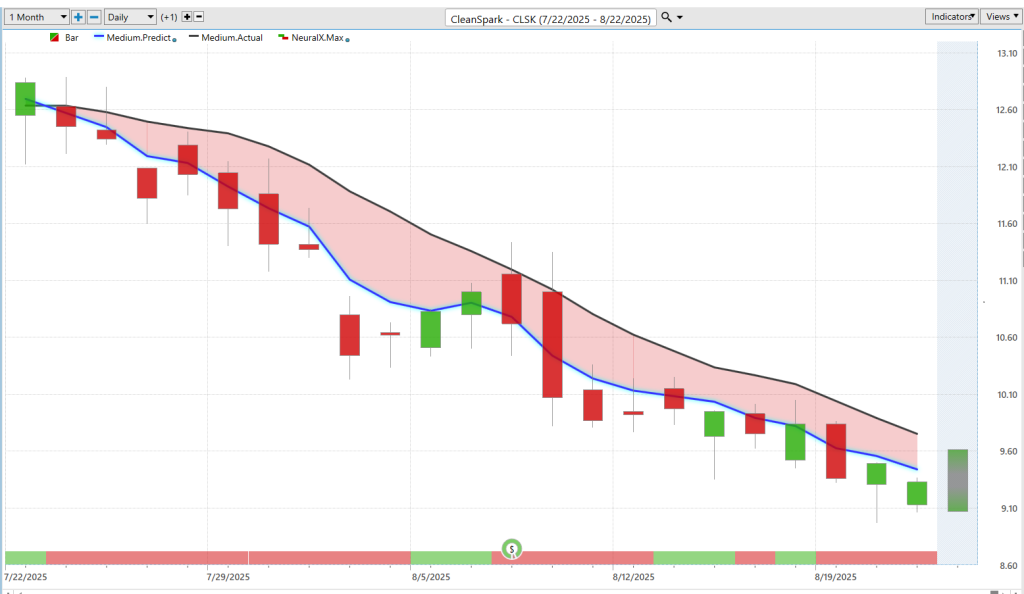
Uh, we also took a look at CleanSpark, and so this is interesting because it involves the, you know, cryptocurrency space and we’ve seen some weakness out of Bitcoin this week. Very early, actually Sunday evening, we moved up to the Vantage Point predicted high and that falls in line with what we already understand as far as Bitcoin miners.
Here in CleanSpark, that blue line crossing below the black line, neural index very bearish. We see a bearish response around earnings and again, just over the past five trading days from last time we took a look at this market, well, we see how is the market performing here? Well, it’s scooting up towards predicted highs. This would have been Monday’s predicted high and you see all week, uh, some depressed, best price action there. So, uh, nice opportunity potentially, you know, take profit on some of those, uh, long positions and potentially actually short, uh, and take advantage of some of this weakness that we’re seeing here.
Shares off about 26% now just in the past 21 trading days.
Universal Health Services ($UHS)
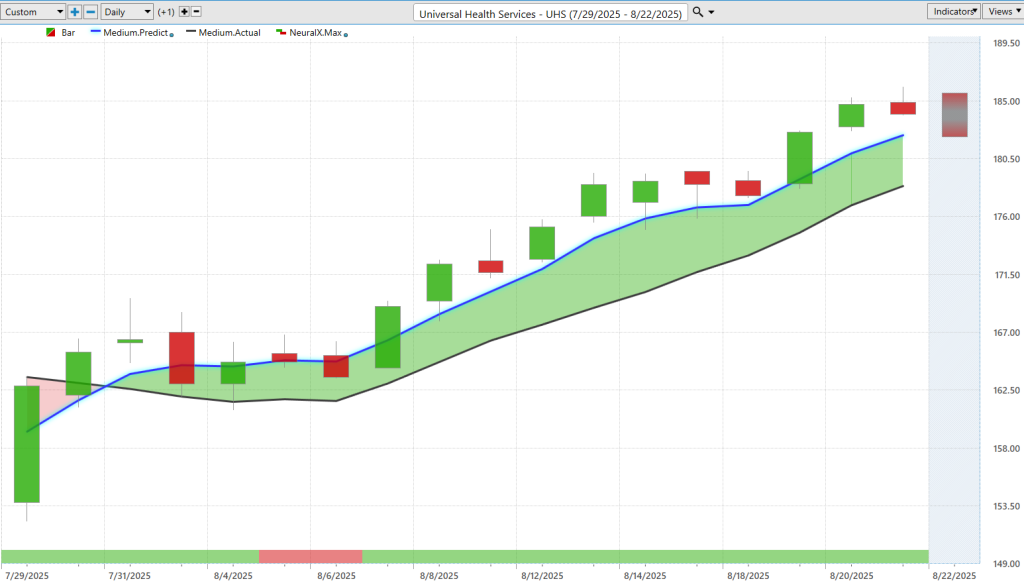
Uh, next, we have United Health Services. So, back to the healthcare space where we’ve seen a lot more persistence as far as trend, uh, a lot of strength in the marketplace. Here you see that blue line crossing above the black line. You already know this is a place to look. Uh, we have features like the Vantage Point Intelliscan that has really skewed a lot of these healthcare forecasts to the bullish side.
And again, we see how this works where a lot of distance between that predicted moving average. You see as the neural index gets bearish you get a couple days of sideways price action, little gap down in the market, but very clearly a strong uptrend. And as we look at those predicted highs and lows since this opportunity came through, really see how this works. Really getting excellent entry levels early on and then the momentum really picks up, that neural index getting bullish, uh, and the trend resuming to the upside. So, pretty exciting stuff here in many of these healthcare stocks.
Uh, but again, you are seeing some pretty important shifts that you certainly want to account for, potentially some new opportunities opening up. About a 12% rally here in just the past 15 trading days.
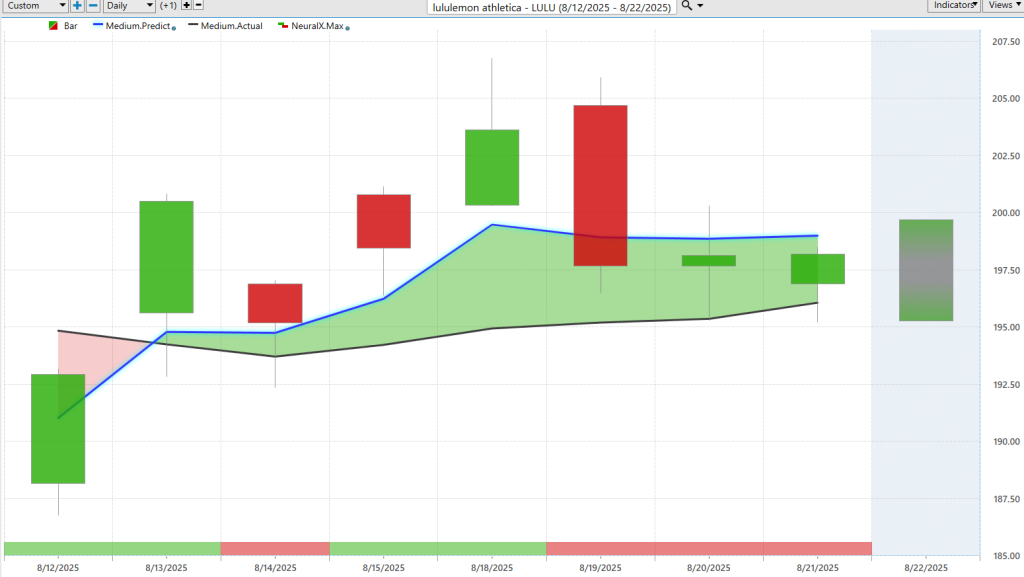
Uh, and lastly we can take a look at Lululemon. So, this is again more recent opportunity but seeing these fresh crossovers to the bullish side. Uh, you see the neural index has been bearish last couple of days, just running sideways, but a lot of distance between that predicted moving average and the actual moving average.
And of course, again we can look at those Vantage Point predicted highs and lows. Uh, and you see how this works. Really getting an excellent entry early on and even yesterday moving down to the predicted low after through some of this volatility here. We’re clearly getting a very nice entry to potentially take a shot and see if we get some nice reversals here in the market.
So, uh, just wanted to go ahead and highlight some of these opportunities. Some pretty exciting things going on. Uh, but of course, you want to be ahead of those moves in the market, then really have the short-term tools to really make the most of those opportunities, really navigate the markets effectively.
So, we’ll go ahead and leave it there for today, but once again, this has been the Hot Stocks Outlook for August 22nd, 2025. Thank you all for watching. Best of luck out there and bye for now.


