


Hot Stocks Outlook for the Week of
August 23, 2019
The Hot Stocks Outlook uses VantagePoint’s market forecasts that are up to 87.4% accurate, demonstrating how traders can improve their timing and direction. In this week’s video, VantagePoint Software reviews forecasts for IBM(IBM), Lennar(LEN), Mosaic(MOS), Pfizer(PFE), and Sarepta Therapeutics(SRPT).
This Week’s Hot Stocks Outlook
Good afternoon traders, and welcome back to the Hot Stocks Outlook for August 22nd, 2019. I hope you all are having an excellent week in the financial markets and as always plenty to cover in this week’s outlook.
IBM(IBM)
We’re going to start here. We got shares of IBM, Homebuilder, Lennar, Mosaic and also a couple of pharmaceutical stocks to ahead and round things out, but starting here with shares of IBM. What we see here is the daily price action, so each one of these candles represents a full and complete trading day. All of this works off of the end of day data, and against those candlesticks, you see that there is a black line and a blue line. At the bottom of the chart, we have another indicator here, and also shadow candles. Actually, that’s a predicted candle that’s generated really before each and every trading day.
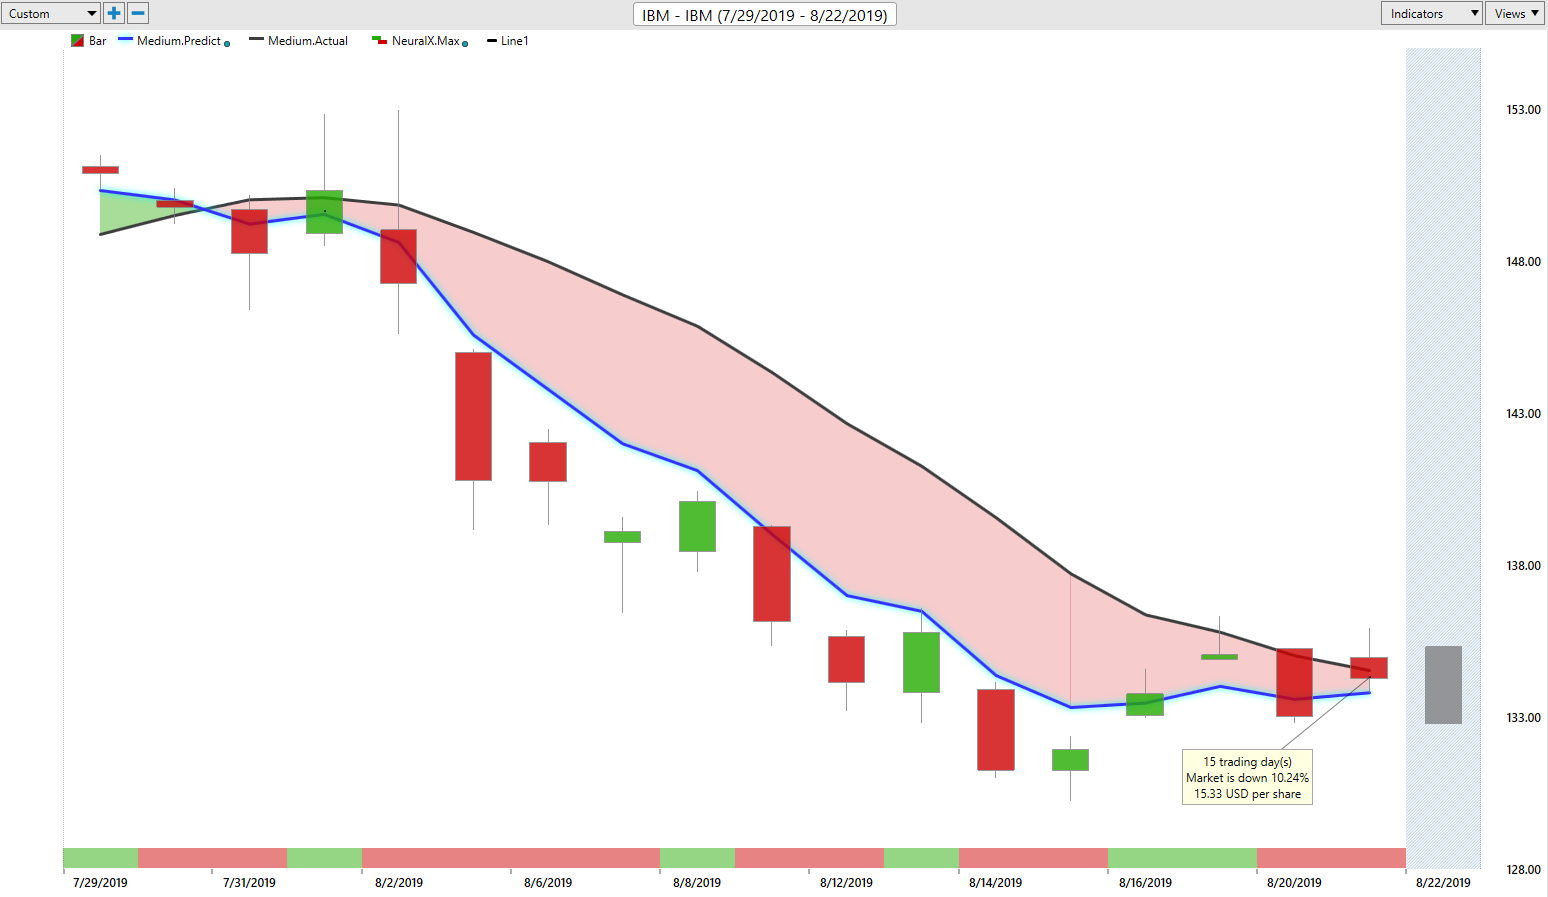
But starting with this blue and the black line, what we have here is with the black line, you have what’s called a simple moving average or what we refer to as the actual simple moving average. And that’s a very common technical indicator. And what it does is simply look at past closes of IBM, adds those all together, and divides by a particular number to give you really a barometer of where prices have been over a given period of time. But of course, as a trader we need to understand, well where are average price are going to start moving forward. And so to do that we really want to pay close attention to the value of this blue line and whether it’s actually below or above the black line there.
But for this blue line to be calculated on the chart, VantagePoint is performing what’s called Intermarket analysis. It’s utilizing the technology of artificial intelligence, specifically neural networks to look at how other related markets are affecting and influencing and driving shares of IBM. So that can be other related stocks. That could be ETF groups. That can be currencies. That can be interest rates. The major indices like the S&P 500, NASDAQ. And what it does is actually utilize that information to actually generate future prices. So prices in the future that haven’t occurred yet, and actually build that into the indicator, making them forward-looking and helping us understand, okay, well where are prices likely to move going forward? So when that blue line, that predicted moving average, crosses in this case below the black line, it’s signaling that average prices are going to start in this case, moving lower and you, therefore, want to go ahead and take a short position, buy put options, however, you want to express that trade.
Now additionally, there’s a couple of other indicators that are going to be very helpful here. Now at the bottom of the chart, you see that this line can go from red to green. And what’s really important to understand about this is it’s a very, very short term indicator and it’s really only looking ahead 48 hours at a time. So very short term. Letting you know about short term strength or weakness in the marketplace so that you can get a better entry, add to your position, really understand what to expect over a given time period. So we’ve got that predicted average, where prices are likely to trade around, that short-term strength or weakness. And really to round out the forecast you’re given a predicted high and predicted low for each and every trading day before it occurs.
So what we’re going to see here is this is the next prediction for predicted high and low on shares of IBM. But we can actually go back and see how accurate all of those predictions are against the price data. And you see that we get this crossover to the downside neural index signaling a lot of weakness. You see it comes up to a one here and you get a high coming through over that subsequent 48 hour period. But the trend very much to the downside here, and you’d want to go ahead and remain short. We can see with the help of those predicted highs and lows, how this works. Understanding that, okay, well the market’s going to trade up here, but you want to be shorting up at these predicted highs, and you see that’s going to get you a really nice entry, around $150 a share. A couple more opportunities as the trend progresses to go ahead and you know, add to that existing position, possibly make some short term trades with the profits you’ve accumulated there, but really nice opportunity to go ahead and set some short positions.
We saw all of this weakness come through at the beginning of August here and you want to go ahead and get short and understand, okay, well as long as that blue line remains in this case below the black line, you can hold onto those short positions and you see shares of IBM off about 10% in just the past 15 trading days. A hundred shares here. You made $1,600 to the downside in IBM.
Lennar(LEN)
Now we actually spoke a little bit about the Homebuilders were quite weak. They were one of the early movers as far as weakness. You see back in June, we start to get this crossover to the downside in shares of Lennar. But look how quickly things come back and it’s signaling, okay, well going into August, look for some of these other places like IBM, we’ve got some more examples here to go ahead and get short, but don’t remain short here with shares of Lennar. And when we go ahead and look at again, those predicted values, so those predicted highs and lows that are gonna help guide you in your trading. Well, what are you going to be doing here? Well, you’re going to be shorting over this period of time. You see actually shorting up on that gap up.
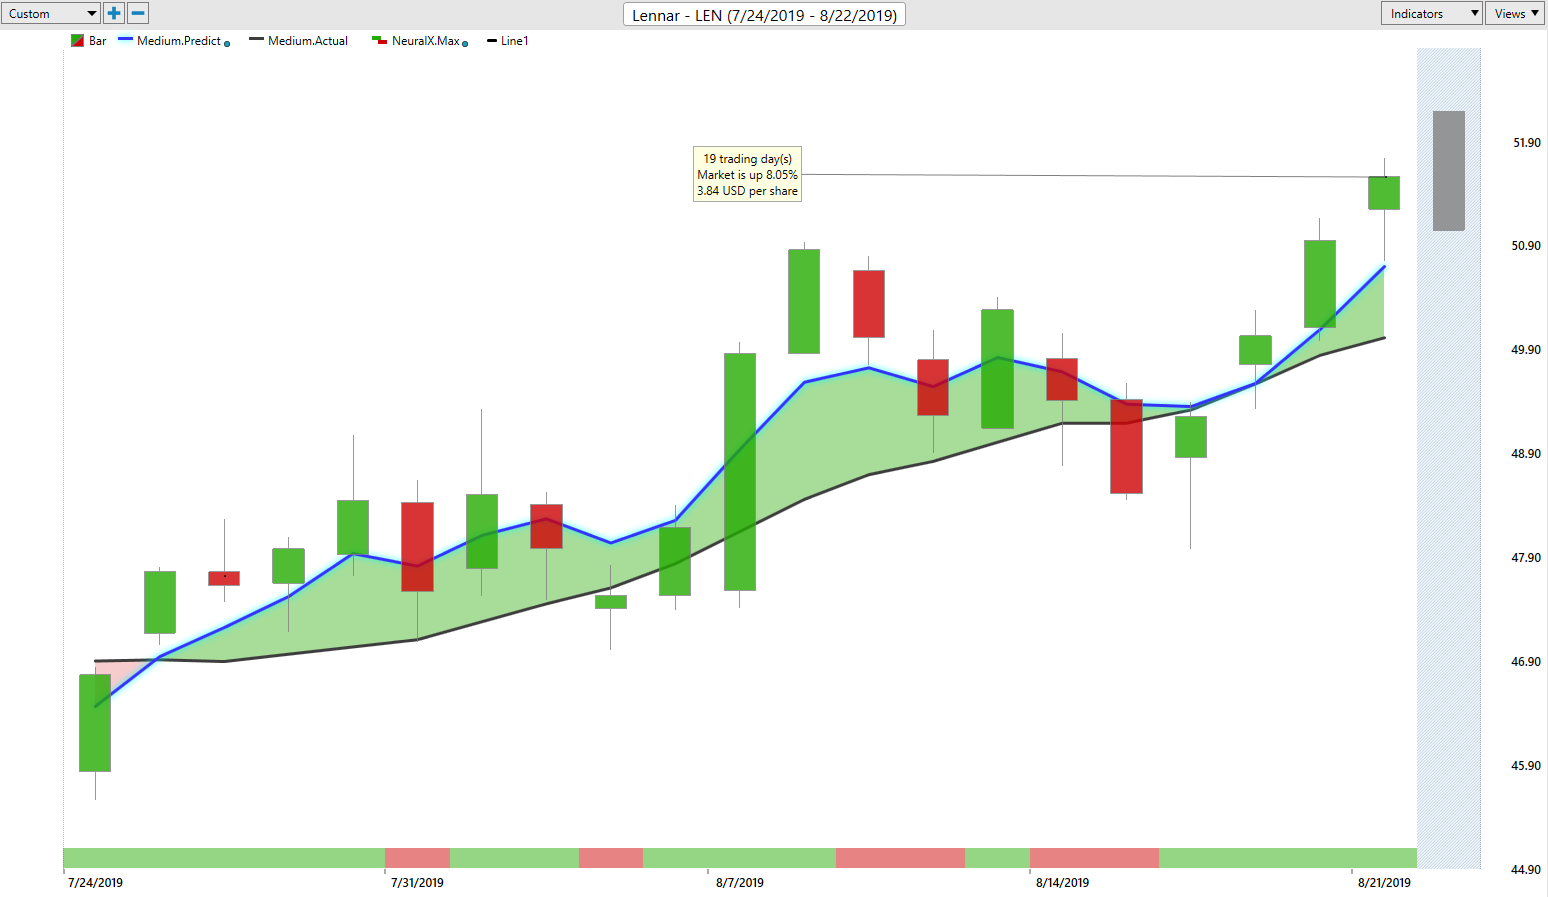
You get filled up at the open. Shorting the market here. But this is where everything reverses, and now going long at those predicted lows. So it’s very important to understand, where to get short. Where do we start expressing that trade? If you’re a trend trader, you see you get those crossover and it says, okay look to gear up to the short side, but very quickly things reversing and really have you at the very least covering positions here or even going long and making some money to the upside here. So you’ve had a really nice rally here, a little bit of volatility as well. But shares coming back over 8 to 9%, $4 per share on a $47 stock trading up above 50 already here. So you want to pick those spots where you can go ahead and get short, remain short as long as that blue line remains below the black line. But when things reverse, very clearly signaling, look, cover your positions, look to go ahead and get long along with the market. And you see things dramatically moving higher over a substantial period of time. Really the entirety of the month there.
Mosaic(MOS)
Shares of Mosaic here. So just another example of we’ve seen a lot of weakness come through at the beginning of August, and you want to go ahead and you know, hedge your portfolio, right? And make sure there are some areas where you’re actually making money on the short side of the market as well. And you see as this market moves lower, these predicted values from the predicted high and low are constantly going to update, but you also get the help with things like the neural index here, where you see the neural index pops up to one here. Quickly goes back to that red configuration and you’re seeing shares decline. Then you get another period where prices go sideways. But then when things get bearish, again, price is declining.
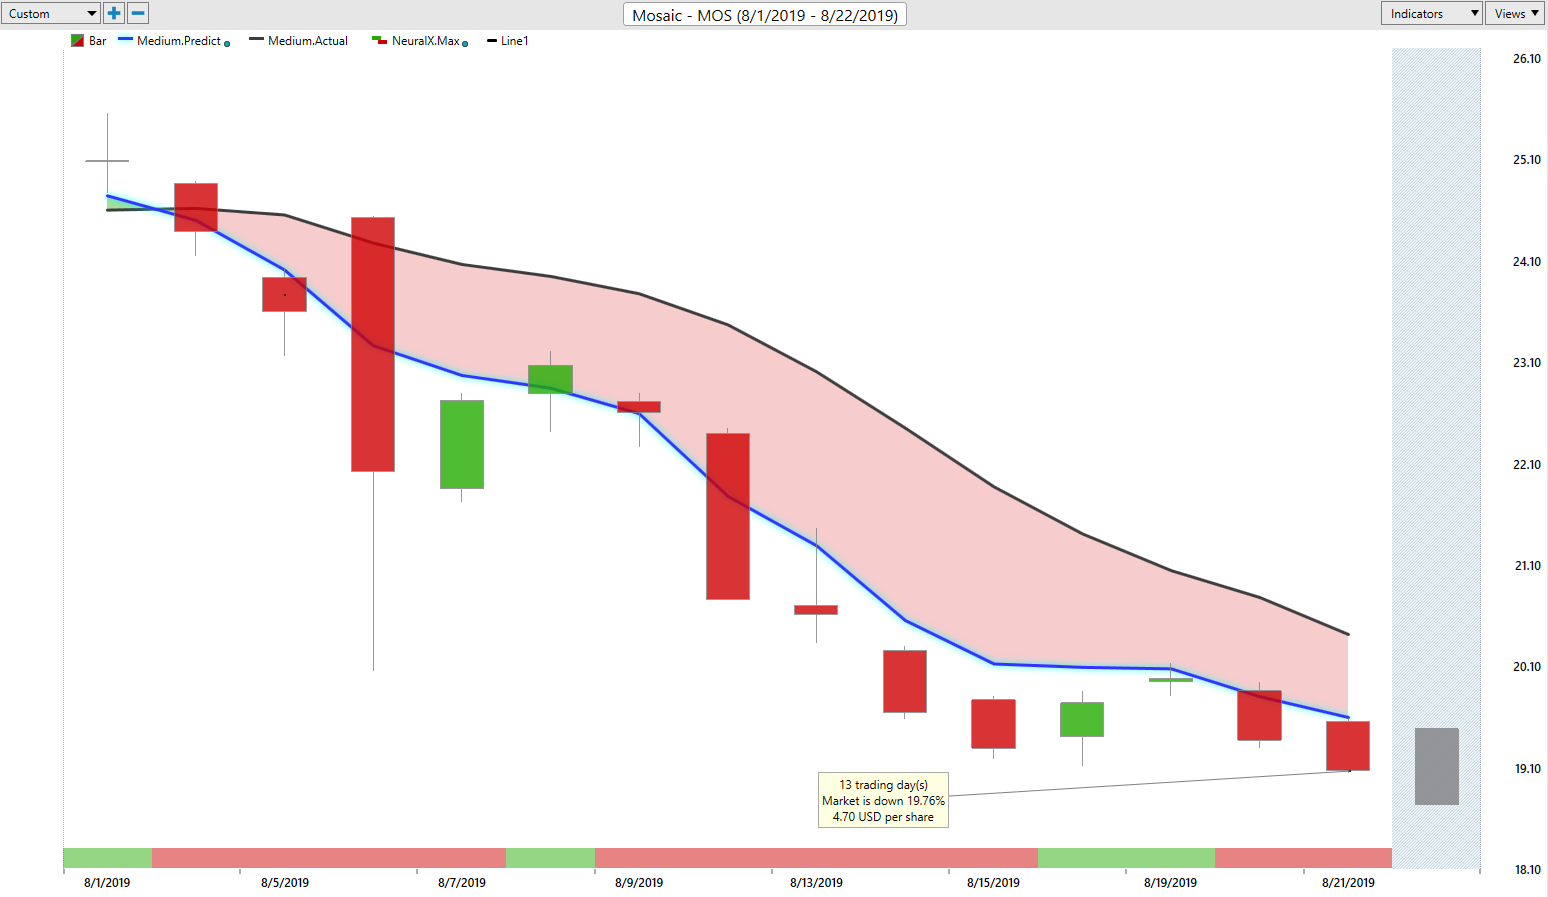
So depending on your timeframe and how you want to express your trades, whether you’re a day trader, swing trader or the trading options, however, you want to approach it, just to understand, okay, well I’m coming in, understand where I want to start expressing that position and adding into a position over time. You see Mosaic here, off 21% just in the past 12 trading days. So critically important to recognize that if these markets are in a downtrend, go ahead and step aside, get on the short side of the market, but don’t be trying to push things to the long side or hold on when very clearly you have short term weakness, the trend is now down. Go ahead and step out of the way for a while or even go ahead and get short and make 21% to the downside if you see shares moving from about $24 down to the 19s, 18s here.
Pfizer(PFE)
Moving forward to shares of Pfizer and Sarepta therapeutics. Here in shares of Pfizer, you see a long period where this blue line has remained below the black line and you get these sorts of periods where markets can just run sideways for a considerable amount of time, but this neural index is letting you know, hey, expect that strength over the next 48 hours. You see, you run sideways, you’re going to trade around this predicted moving average, but you never get that crossover to the upside. And as long as that blue line remains below the black line, you want to go ahead and if anything, be looking to short up at these predicted high levels. So many opportunities before the market starts to decline to go ahead and get short. And you see why it’s so important to wade through those periods.
As when it starts to move it’s gonna move very, very quickly, especially to the downside here. So really nice opportunity here in shares of Pfizer. Definitely don’t want to be holding some longer-term positions or any longer-term investments here. As the market’s getting ready to give back over 19%, $8 per share. Again, you know, a couple of hundred shares, you’re making a nice little chunk of change on the short side. And a really great entry is to remain short over the longer term as shares decline. So if those trends still remain to the downside, like things like IBM, again, hold those positions for the long haul, go in and do some trade management off of your predicted levels. But when things turn around like Lennar, you understand, okay, well reverse that position. Start moving to the upside.
Sarepta Therapeutics(SRPT)
Here in shares of Sarepta, same thing. So seeing that weakness throughout some of the pharmaceuticals, the bigger ones like Pfizer starting to move to the downside and you just see all this tremendous weakness from the neural index. And again, this is a highly accurate, but 48-hour indicator. So very, very short, but going to be well in excess of 80% accurate at those 48-hour windows that it’s projecting. So when you can form that directional bias. Understand, hey, I want to go ahead and remain short here. I’m going to come in with the benefit of those predicted high and low values to guide over the intraday levels, right? To know where those limit orders should be, where you can be adding your position. But one of the greatest things you can do here is to go ahead and get involved in a short position or any position really involved with the trend, and then understand how to use those profits to effectively add into the position as it continues. And you see the bottom just completely dropping out here in this market off $50 per share here. Just a huge, huge move as things really start to decline here.
So you don’t want to get caught in a period like this. And we’ve seen so many markets start moving to the downside. 30% move to the downside in just 12 trading days. So literally under three weeks, a time here, less than… We’re not even at the end of August. So just in three weeks of time, market-moving down at 30% or $44 per share. Again, simply 100 shares you’re making 4,400 bucks just in the past few weeks here. So what’s really great about this is understanding where you want to go ahead and initiate those positions. But like I mentioned, where you can add to them. So take some of those profits you accumulate over this period and use those again, to intraday, get short, maybe take some shorter-term day trades, but not lose sight of the bigger picture. And make sure that you’re getting involved in that significant decline there, about 30% to the downside. Obviously, Pfizer as well, moving down pretty significantly.
Great opportunities throughout the markets. We’re seeing a lot of volatility, right? As markets start their trends, the volatility really starts to expand and you want to know where to navigate that, where to hold your positions, and also areas where you say, “Okay, the trends now to the upside. Let me go ahead and step away from things.” So once again, this has been our hot stocks outlook for August 22nd, 2019. thank you all for watching. Best of luck and bye for now.