


Hot Stocks Outlook for the Week of
August 28th, 2020
The Hot Stocks Outlook uses VantagePoint’s market forecasts that are up to 87.4% accurate, demonstrating how traders can improve their timing and direction. In this week’s video, VantagePoint Software reviews forecasts for John Deere (DE), S&P 500 (SPY), FortuneBrands (FBHS), MasterCard (MA) and Target (TGT).
Register for a Free Live Training
This Week’s Hot Stocks Outlook
Hello again traders and welcome back to the Hot Stocks outlook for August 28, 2020. Hope you’re all having a excellent week out there in the financial markets and as always plenty to cover in this week’s Outlook. So we’re going to go ahead and a little bit differently look at actually the S&P 500 futures here, as well as a few stocks. We’ve got Fortune Brands, John Deere, Mastercard, and Target. But what I want to highlight here is here’s the forecast for the E-mini S&P 500 futures. And this is a really good way to really build your overall game plan for your trading into. Okay, well, should I be going long stock, short stock? What should I be looking for out there as far as using VantagePoint to trade potentially individual stock trades?
E-Mini S&P 500 Index (ESY)
And we see here with the S&P 500, what we have here is daily price action. So this is daily bars going back all the way really to the beginning of July. And you’ll see that there’s a black line and a blue line. And what I really want to do is use this to highlight how really all of these indicators work really together to produce that short term forecast. And when you have a good forecast of the next two to three trading days, you can really manage the trade and really make trade adjustment, essentially adapt to the different trading environments that may come about.
So when we look at the E-mini S&P 500, what we have here is a black and a blue line right up against that price data. And this is the overall prediction of trend. Now what that black line that you see there is, that is a regular simple moving average. So that’s a very common technical indicator, and it does a good job at letting you know where market prices have been, but all of the data that’s generated and used to generate the value of that indicator is really derived from the past. So you often get, you’ll take 10 close prices, add them all together, divide by 10. All of that info is from the past. And it’s really only looking at the one marketing question, in this case, the S&P 500.
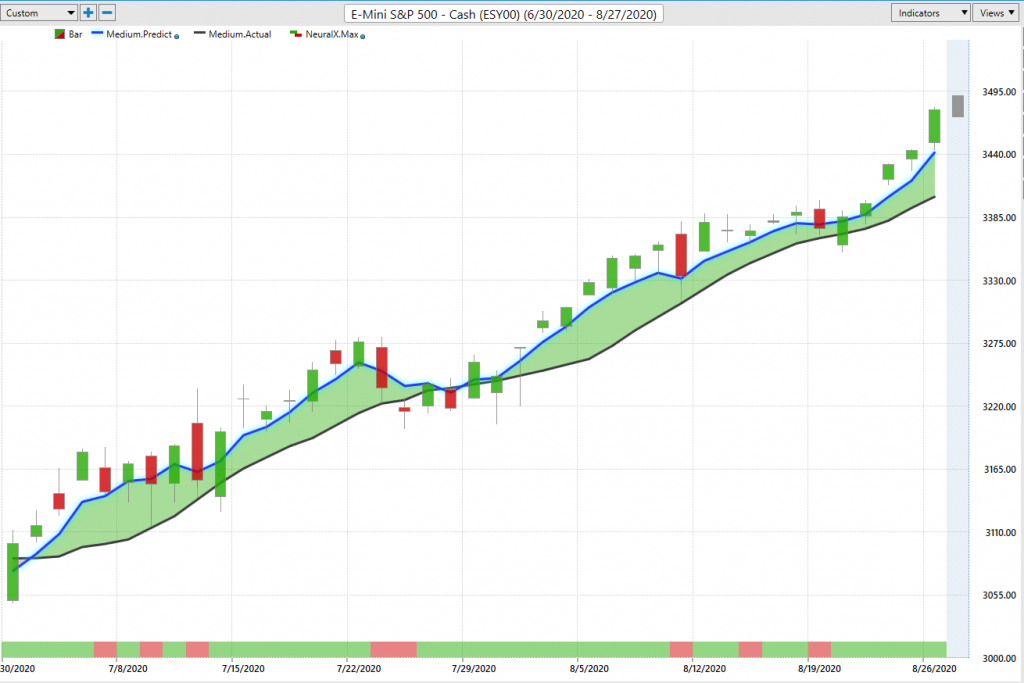
Now what we’re able to compare that value to, essentially that measure of where market prices have been, is this blue value that gets generated and updated each and every trading day. And what this is, is VantagePoint’s proprietary predicted moving average. And so to generate that indicator, what VantagePoint is doing is it’s not just looking at the E-mini S&P 500, it’s looking at things like all those different ETFs markets, things like the SPY, maybe a lot of inverse ETFs. It’s looking at things like the Nikkei futures, the DAX, all of these international global stock exchanges. It’s looking at things like global currencies. Things like the Euro, US dollar, looking at global interest rates.
And it’s able to understand specifically how a large number of markets, really a few dozen markets, are driving and influencing the future price of the S&P 500, essentially that aggregate of the broader market. And so what it’s actually doing is generate predictions that haven’t yet occurred. So you can think of that as true predictions off to the right of the chart, and it uses those values from the predictions to actually generate this line. So rather than having a tool that’s always getting dragged around by what’s occurred in the past, you have one that’s heavily weighted by these predictions that are actually forward-looking.
Now in the same way that VantagePoint is using that inner market data to understand and weight really the positive and negative, and leading and lagging relationships that are taking place in the inner markets that are affecting the S&P 500. It does a very similar thing at generating other indicators that are geared towards different timeframes. So down here, you see, they have this green or red line. And again, this updates every single trading day, and it’s forecasting ahead for the next 48 hours. So every single day, you’re getting a new updated forecast for the next 48 hours. Looking at two days ahead, and looking for short term strength or weakness in the market.
Now, you can see here that with the Neural Index on the S&P 500 futures, this is I believe 41 trading dates. And you’ve only had five days where this neural index is forecasting short term weakness over the next 48 hours. Now, again, what it’s predicting actually includes the high, the low and the close. So often this can warn you of really just short term volatility, where you might get some lower lows in an uptrend. And what we can do is really compare that and pair that with the overall trend from the predicted moving average.
So if the overall trend is up, well, we can understand that, “Okay, well, we may have some weakness or some lower lows over the next 48 hours from when we get these bearish Neural Index signals. But the overall trend is still up.” So you see how you really only have really about two days where this might not be correct, where the market just actually does trend up a little bit higher. Here, again, you see those lower lows coming through after that neural index.
But the blue lines, that prediction of where average prices are relative to that measure of where market price have been, extremely bullish and letting you know that this is actually a very strong uptrend. There’s a huge amount of separation happening here between that blue and the black line. And that’s really diverted you towards saying, “Look, the stock market is very bullish. There’s not really much sense to be getting short here.” Find some stocks to go ahead and take long positions, maybe just go ahead and buy SPY, or S&P 500 futures.
And here’s really the great part of this, is over this 12% rally we’ve had just in the past month and a half here, you also get this predicted high and low range. And again, this is on the S&P futures. This is a leveraged contract, but imagine if you understand that, look, the trend is up, well, where if I’m an intraday buyer, do I want to be coming in and actually adding to my position? Or if I’m looking to buy stocks, you can see the S&P 500 futures down at around these levels. Well, if you’re buying at this time on an individual stock, you’re likely to see the stock start performing well generally as well. If the S&P pulls back half a percent, generally the stocks will pull back a little bit when it’s ready to move up again. That’s where things are really going to perform well.
So you see, these multiple entries along this uptrend, and then that eventual really strong breakout we’ve gotten out recently in stocks move much higher here. So what has that directed you to do? It’ll look for stocks to go ahead and buy. And we see whether you’re looking at tech stocks or healthcare stocks.
Fortune Brands Home & Security (FBHS)
Here we’ve got Fortune Brands Home & Security, very similar situation where that blue line is well above the black line. You’re going to get these areas where the Neural Index goes bearish, and you can get some sideways price action, some lower lows over a period of time.
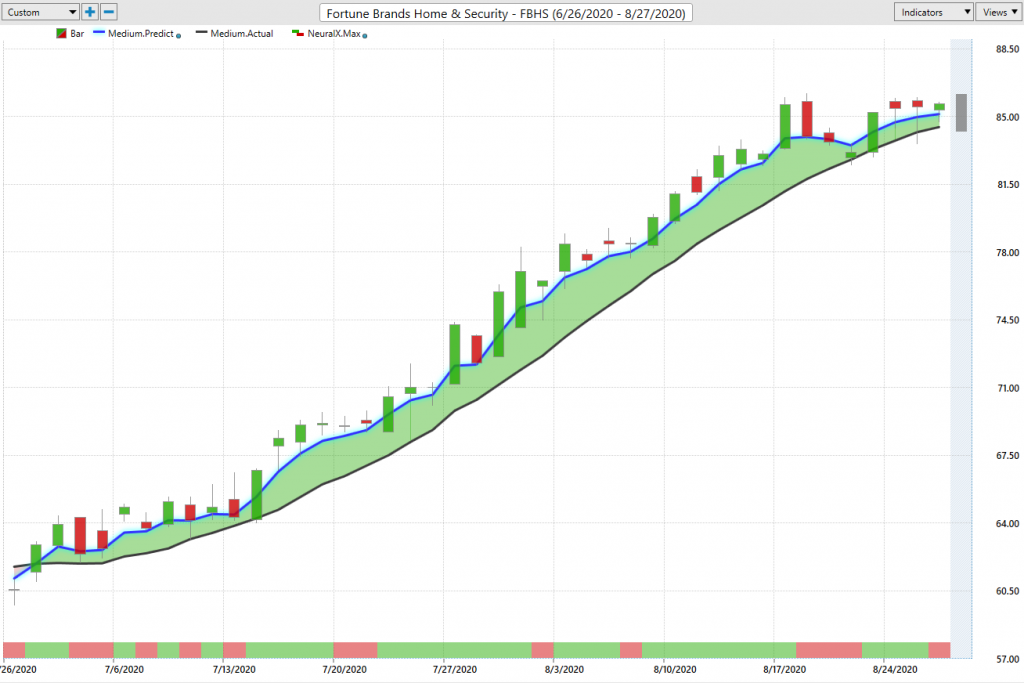
But as long as that blue line, again, is above the black line. You know the overall trend and therefore the direction of your trade, really your bias, as far as whether you should be long or short is to the upside. And again, here we have a 36% rally in just the past 41 trading days, but more importantly how are you potentially managing the trade over that 36% rally? Well, if you’re buying really at the beginning of the trade, you see multiple entries there, and release some opportunities to add to the position with those existing profits. And that’s really how you can build a really significant position with very limited risk. Meaning, if you’re able to lock in stops at this level and add to a trend that is still in that uptrend, you can really make a lot more than potentially that 36%, as far as your position size growing as the trade continues. But really nice opportunity here where 500 shares has you up about $11,500. And that’s just the last 41 trading days.
John Deere (DE)
And there’s a lot of different stocks you can be doing this. So when you understand, “Hey, the S&P 500 here is very bullish. Let’s go ahead and look for stocks to buy.” Well, what stocks are those going to be? Well, they’re going to be stocks in uptrend. So, where that blue line is above the black line. And then you can come in and say, “Okay, well, let me use that predicted high and low range if I’m coming in intraday and get a really nice entry on these positions.” Which is allowing you to minimize really the risk that one has to take. If you’re getting in near the short term low, or on a dip, you don’t have to run these huge stop-losses and have a lot of risk hanging out in the trade. You can really tighten that up and really minimize how much exposure you’re taking to the market still getting the same position here.
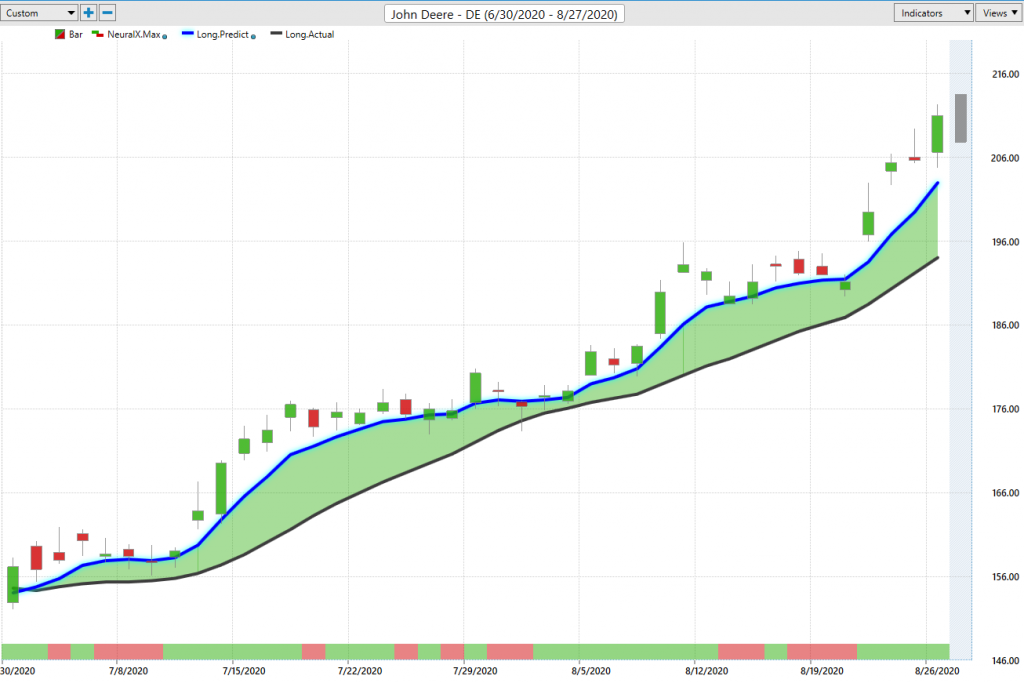
So we see shares of John Deere here up 34%, again, 500 shares here has you up about $27,000, again, even just a hundred chairs there has you up several thousand dollars.
Mastercard (MA)
Here are shares of Mastercard. And obviously a lot of people buying things on the internet and using credit payments and things like that. But regardless of all that, the stocks here is in an uptrend. So, again, we can look more closely at things like the Neural Index. You see, when it goes red here, you get sideways price action. But as long as that blue line still remains above the black line, and you see that when things go sideways and narrow here, Neural Index is still saying, “Look, there’s strength here over the subsequent 48 hour periods.” And then things really start to explode and move higher here. Again, a little bit of sideways action after the neural index gets bearish in this case, and then the overall trend starting to move higher as a short term and trend forecast, forecast things, moving to the upside.
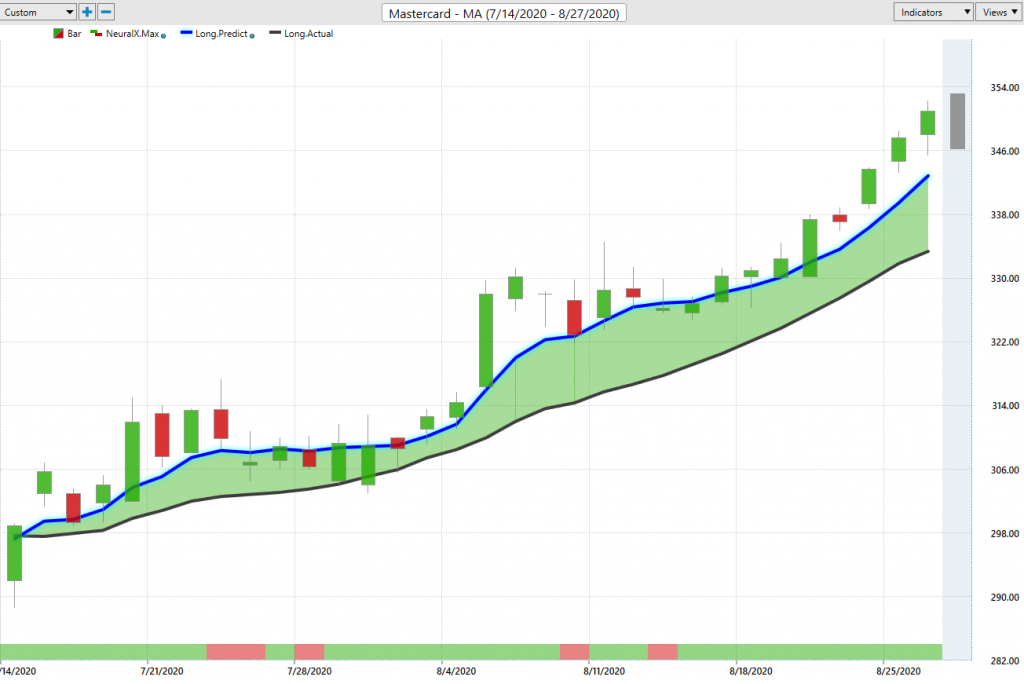
Once again, of course, the importance of those predicted high and low levels. So I really encourage people to think of this as the entirety of the VantagePoint tools here is really the combination of these three parts of the equation of overall trend direction, short term strength or weakness. Again, that’s very short term, only 48 hours every time this gets updated. And then also that predicted high and low. So you imagine forecasting for a hurricane or something like that. They’ve got this really cone of where this thing is likely to move. Very similar in that regard is you’ve got the direction, the main direction things are headed, short term strength or weakness. I mean, how much variation can you potentially have over a shorter term period of time. And then specific points of where it makes sense to interact inside of that range.
And we see here, again, with these predicted highs and lows do a really great job of guiding the trader forward. And trading on really short timeframes can be tricky because you get some of these days where the market just trades lower. There’s more sellers in the market. It closes lower. But oftentimes those are really the levels that you want to be buying in and not buy at that level and expect in the same day it’s going to move all the way up. But understand that look, on a daily basis, that’s the level to go ahead and get in. It may close down near or at that level, but that’s where you want to get involved in the overall trend that you’re looking at for that trade, that’s where things make sense.
So we’ve seen here in shares of Mastercard, things move up about 16% just in the past 30 trading days. So again, 500 shares here, you trade some option contracts. However you want to approach the instrument used to trade that. But up about $25,000 in just the past 30 trading days.
Target (TGT)
Lastly here, shares of Target. And this is where things can get really exciting. We saw this so much with Overstock.com, a market that’s in an uptrend, and it really starts to explode and accelerate to the upside. A very similar picture here is, if you’re looking for stocks in July to start buying, this is where VantagePoint is forecasting some new trends and new opportunities.
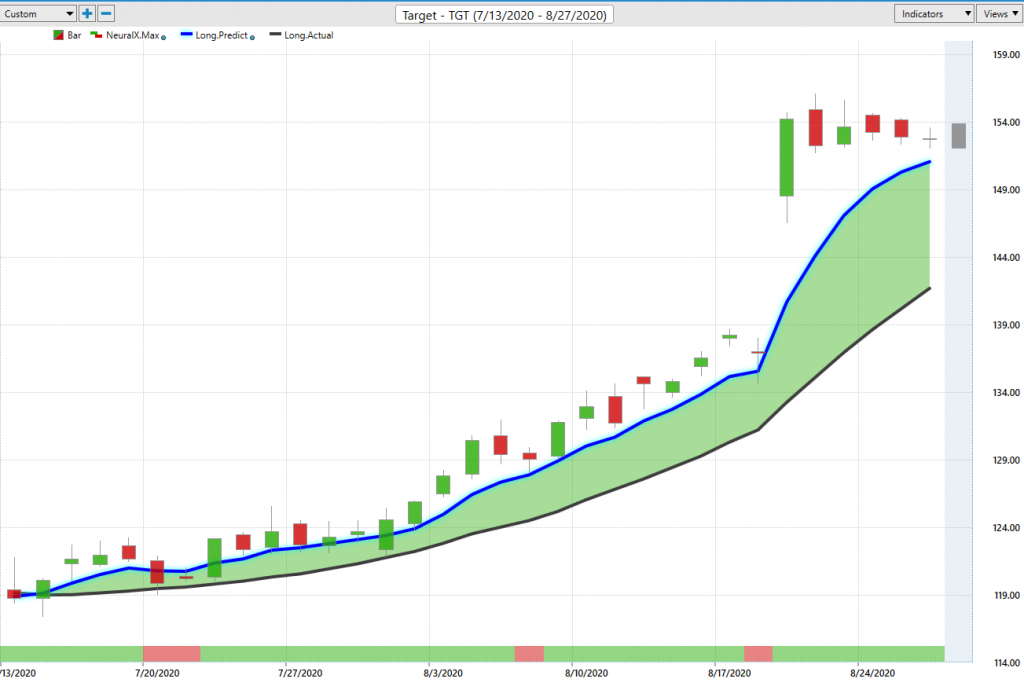
Again, you’ll get those periods where the Neural Index says, “Hey, there’s some lower lows down here over the next 48 hours.” But the overall trend very much to the upside, the entirety of the trade, very, very bullish from both the trend and Neural Index perspective, and then saying, “Okay, well, where do I actually want to go ahead and potentially have a limit order waiting to get picked up?” And days like this are really great where you see, where you get that gap down open, but you get filled at that opening price. So when you have limit orders waiting at these levels, you often get really excellent fills on these sorts of opportunities and a chance to, as long as that blue line is above the black line, chance to getting these really fabulous opportunities where things really explode to the upside.
So, I mean, we saw shares of Overstock go from $5 a share, $3, $4, $5 a share up to well over a hundred now. Here’s a situation where just in the past month here, 27% rally to the upside in shares of Target. So, a lot of interesting things happening in really all different areas of the market. I mean, we’ve got home security, we’ve got tractors here, Mastercard, Target. Just the overall market doing very, very well and very clearly. This S&P 500 saying, “Look, you want to be long stocks.” I mean, currencies, commodities, these things, or other areas of the market share, but stocks, individual stocks, the S&P 500, about as bullish as it gets here and getting that guidance all along the way to be scooping up more of a position.
So really fantastic stuff from the software here recently. But once again, this has been our Hot Stocks Outlook for August 28, 2020. Thank you all for watching best of luck out there and bye for now.


