


Register for a Free Live Training
The Hot Stocks Outlook uses VantagePoint’s market forecasts that are up to 87.4% accurate, demonstrating how traders can improve their timing and direction. In this week’s video, VantagePoint Software reviews forecasts for Keycorp ($KEY), Arista Networks ($ANET), SnapOn Tools($SNA), Cummins ($CMI), and Marathon Oil ($MRO)
Hello, again, traders and welcome back to the Hot Stocks Outlook for December 9, 2022. Hope you all are having a excellent week out there in the financial markets and, just like each week, we have a ton to cover here in today’s outlook.
Now we’re going to start out, we have shares of KeyCorp in the financial space, Arista Network, Snap-on, Cummins and, lastly, Marathon Oil. So a lot to go ahead and get through some really important shifts in the marketplace.
But if you haven’t already, make sure you go ahead and click on the link below in the description. You can get a live demonstration, really learn more of the specifics about how this technology is going to help you as a trader make better trading decisions day in and day out in the market, which is really what this is all about.
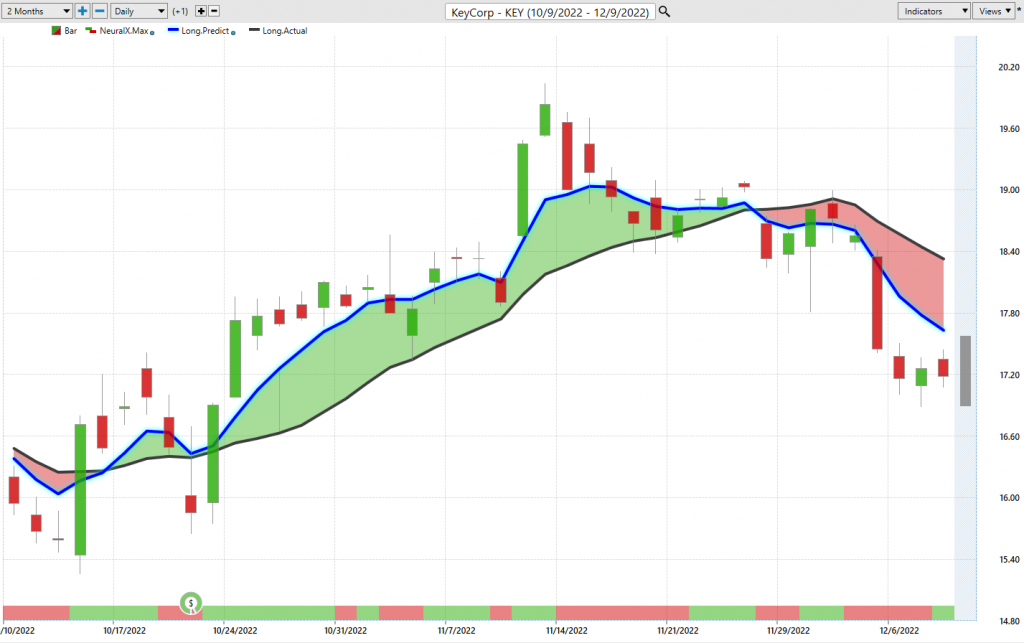
Starting out here with shares of KeyCorp, what we have here, just like with all these charts, is going to be daily price action so each one of those candles is representing a full and complete trading day. Right up against that price data, what you’re going to notice there is there’s a black line and a blue line so this is going back to really mid-November. We’ve got daily price action, a black value and a blue value right up against the chart. That black line that you’re seeing that is actually a simple moving average. In this case, it’s a very simple moving average, and that is just a 10-day simple moving average. It’ll add all those 10 closed prices together, divide by 10. What this does is really smooth out the existing price action and let us know as a trader where the market has been over a given period of time.
But obviously, a trader needs to be ahead of the next market move. So what we’re able to do is actually compare that lagging simple moving average, that very common sort of baseline of where the market has been, to this blue proprietary predicted moving average. For that value, essentially that number to get plotted against the chart each and every evening, this is where the technology of artificial neural networks come into play. What they’re doing is very sophisticated in that they’re performing what’s called intermarket analysis.
Now, last week we looked at J.P. Morgan and that was a financial stock in an uptrend. It had a shift this week, similar here to KeyCorp. But what we have to understand is that there’s other markets that are known to drive and influence the individual markets that you may be trading in. Now that may be things like the XLF, the financial SPDR, and that may affect a bunch of different stocks like J.P. Morgan and KeyCorp, but there’s subtle relationships happening under the surface here.
So this can be things in between individual stocks that specifically are giving us clues into the future price action of KeyCorp, but it’s also going to be things like the dollar index or the S&P500 or the Nasdaq. So it’s able to take in all of this really global information and understand the specifics of how it’s affecting that target market that you might be of trading or observing.
So what it’s able to do is then utilize all of that global information and generate price predictions, and it’s those price predictions generated via the technology that are used to construct these indicators, rather than just looking at past prices and really just getting a reformatting of what’s already occurred. So whenever that blue line crosses below the black line, it’s suggesting average prices are going to start moving lower. Essentially, it’s a forecast of where average price is likely to move in the future and so again, whenever we see that blue line cross below the black line, we’d expect some weakness.
Now neural networks can be tuned to solve different problems. So in the same way we’re using that inner market approach, we have this other indicator at the bottom of the chart, and this is the predicted neural index. You see it has this bar that goes from green to red back to green, and this is tuned to solve a different problem for the trader. What it’s doing is anticipating short-term strength or weakness over the next 48 hours or you can think of that as two candles. So we can really combine not only that predicted moving average, but our neural index, but also with this predicted range that you see at the very right-hand side of the chart. What happens is each and every evening the software is updated with all of this information, the overall prediction of trend, short-term strength or weakness, but you’re also provided a intraday predicted high and low for the next trading day, which has not yet occurred.
So what we’re doing each week when we look at these forecasts is go back and say, okay, well, what did those forecasts look like against the actual market data? We can see that here with KeyCorp, we have a very clear forecast to the downside. You will get these periods where the neural index will get bullish, and that’s where you see subsequent bullish price action over that 48-hour period. But when you can also come in and use things like the predicted highs and lows. So understanding that we may not get up to that level every day, but it’s giving you this roadmap that says if you want to short the market, look up here, up at these price levels, you see we eventually get filled and then the immediate downtrend resumes. You see, even on a day like this where there’s going to be some subsequent bullish price action, but as far as where the market closes, that’s the high of the day.
Then the updated forecast says, hey, we’re going to go a little bit higher. Hey, we might go a little bit higher, but the overall trend is down. So traders can use these tools to set limit orders, potentially also profit targets if you know short-term trading, and this can help traders make much better trading decisions in the marketplace. Here we see a couple of entries just from the predicted highs and lows, but clearly this market in a downtrend and suggesting you’d only want to short, take profits on shorts, maybe buy some, put options for protection. But here, the market down 8.4% in the last 13 trading days.
Now this is very important because we looked at J.P. Morgan, we had a nice big uptrend there, but early in this week there were some very important shifts in the market. So this is really interesting because there’s a lot of stocks that look very vulnerable, but the dollar doesn’t look very strong. So it’s a very mixed sort of picture out there, and you really want a roadmap that’ll help you manage and navigate this and be in the correct markets that are actually in strong uptrends or downtrends if you want to go ahead and get short.
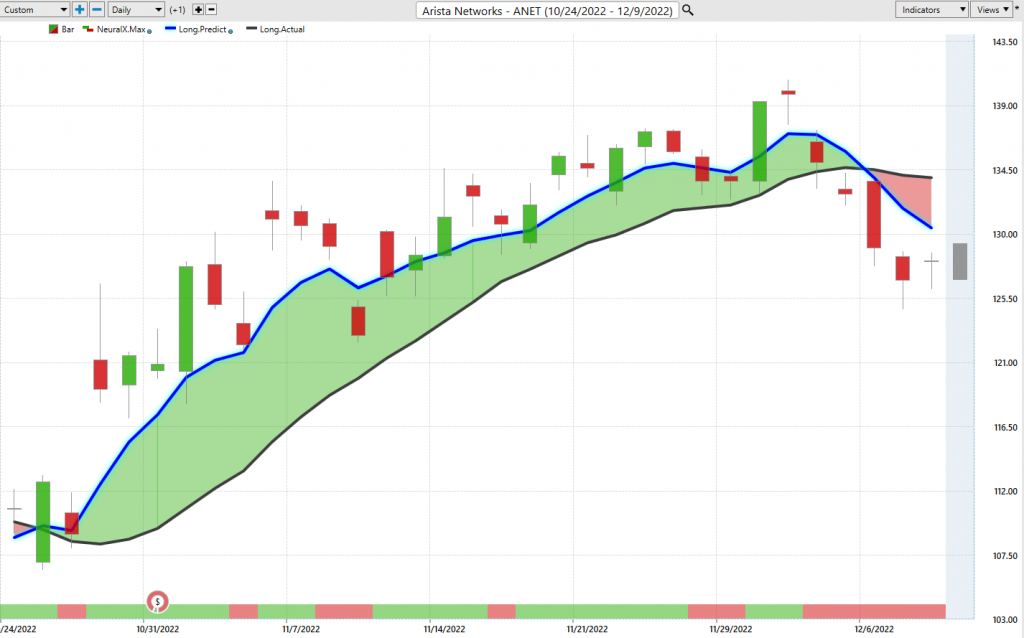
Now, here’s Arista Networks. Company’s been doing really well, stock’s been doing really well, but this is what, again, I want to highlight is that we’ve got these tools within VantagePoint that actually scan for where these predictive indicators are actually generating crossovers. So as we work forward through time, we actually see these important shifts in the marketplace. Here in Arista Networks, we can do the same thing as, okay, well, on the way up, when we look at those predicted highs and lows, these act as excellent levels to take a position. See, we get this gap down here, some volatility, and we look at this each week where sometimes we get some volatility. The software does an excellent job of really reestablishing that roadmap of, okay, what is going on here so the trader can keep expressing that position? We had this really nice rally, clearly everything in a very strong uptrend where you’d only want to be going long, but this is very important here.
We’ll go ahead and look at Snap-on, and we can look at Cummings and we’ve had this shift here and again it’s very widespread. It’s in a lot of different markets and you want to pay attention to it or hedge that portfolio and identify some areas where you can actually take some short exposure here. But here in Arista, you get that crossover to the downside. We can again look at the predicted highs and lows and again giving that roadmap that says, look, if you want to go ahead and really not take a position here, there’s probably better places to short. But definitely on the long side of things, there’s been some weakness here and it certainly makes sense to get out of the way, look for lower prices, and certainly look for markets that are still in uptrends if you want to go ahead and get a long. Or in this case, just wait until that blue line gets above the black line, and then maybe we’ll be rolling again, but we’re not quite there yet.
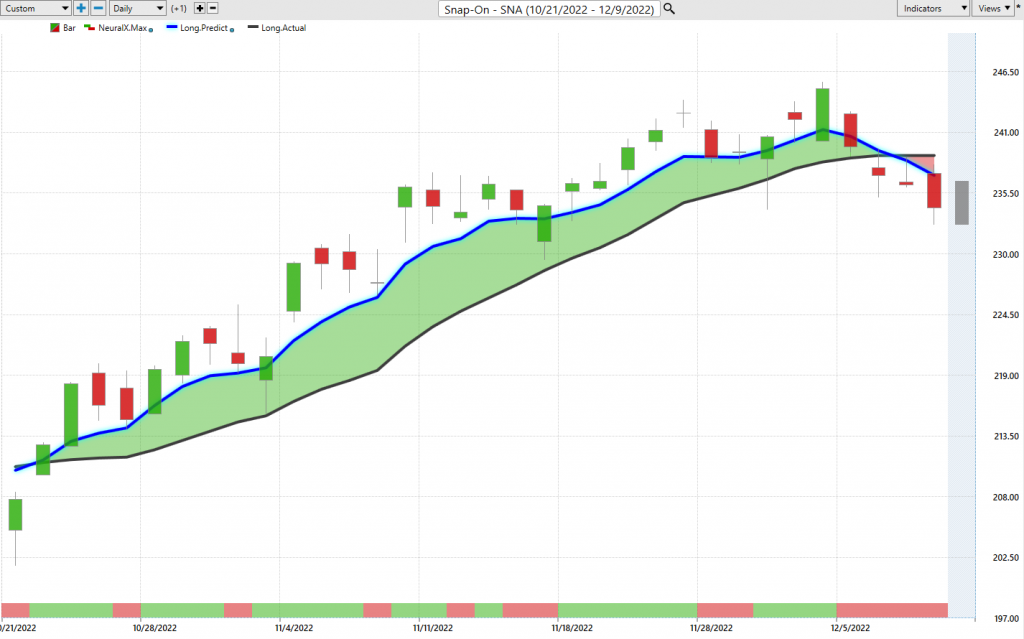
Now here’s Snap-on and again you see another example of really nice uptrends. So last week we were just looking at all the bullish opportunities because everything was in a very strong uptrend. Then we get towards the very beginning of this week, and you really see a very important shift in many stocks that had been doing well. Here in Snap-on, you see that blue line crossing above the black line, and that leads to a really great rally over the course of the last couple of months. But again, I just want to highlight that when you have tools like this and you’re utilizing these predictive indicators and these predictive crossovers, well, you get these early signals that, okay, well, something’s going on here, not only in Snap-on, but Arista Networks and you already know KeyCorp is very weak.
We already have these clues that say, look, there’s some very important shifts happening out there. It’s not just confined to one sector. And here you see Snap-on, you get that crossover to the downside, but then these shorter term tools. So if you’re trying to establish a short position in the market, it doesn’t get more clearer than crossover to the downside, neural index bearish, well, where would you want to look? So if you’re looking for opportunities to go ahead and get long, this is clearly not it. Not only that, but a great opportunity to hedge, short, definitely get out of longs if there’s any still long there because this market is in a downtrend. So again, we can just go back to the overall forecast, and we have a lot of markets looking like this.
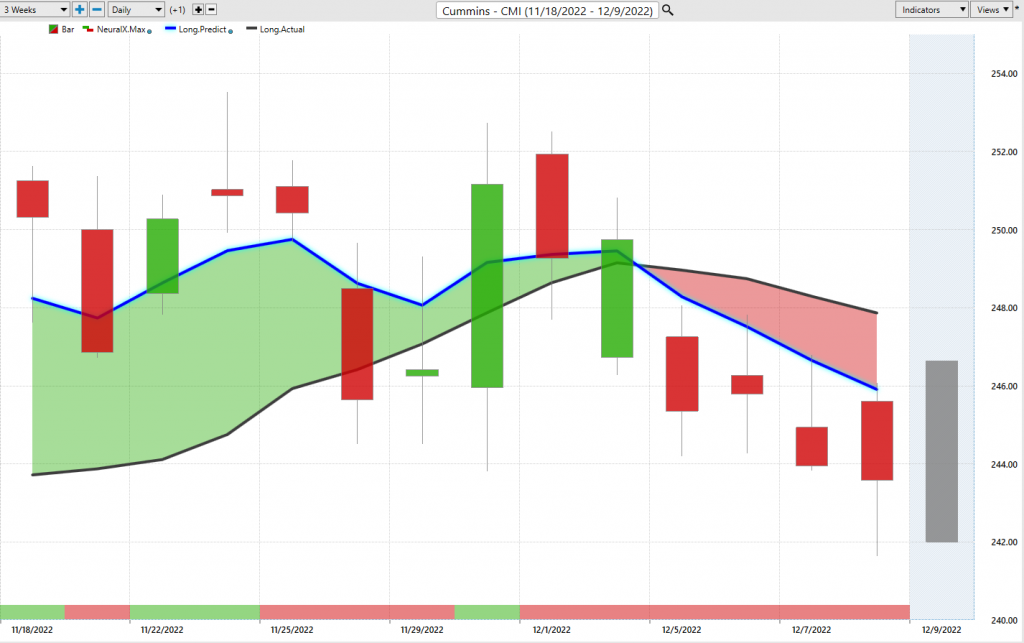
Here’s Cummins, and I just wanted to bring this in to get a little bit more of a close-up here of what we’ve seen in many shears. Here you see this blue line crossing below the black line, and when we zoom in on this, it’s very clear. The blue line below the black line, neural index bearish like many of these other markets. This is what alerts you very early on this week that, hey, there’s some potential weakness out there. We’ve had a bounce midweek, maybe a good opportunity to take some profits and certainly stay away from markets where you see these very aggressive downtrends in play. Here in Cummins we can again take a look at those predicted highs and lows. Again, you see this excellent job here as saying, okay, well, where do you expect on the high end this market to trade?
Also, we see this quite a bit where we had these previous predicted lows and you see we get this blip down, you close right in the middle of the range, but again, we’ve still pretty much running sideways.
But if you want to be trading that and actually making money, well, you’re going to need to get some really good entries. You already potentially made some money on the short side as this market has declined from about 247 down to 242 or so, and just a couple of trading days there.
Lastly here, here’s Marathon Oil. I just wanted to bring this through because if you’ve been watching the Hot Stocks Outlooks for a while, I mean if you go back a couple of months ago, it was all about oil, where there’s all these energy stocks, basic material stocks doing really well, while the rest of the market like Apple really not doing well. Well, the energy has shifted. Crude oil shifted lower, all these energy stock shifted lower and we haven’t brought an energy stock in here for quite a long time because, well, that area of the market has really not been an area of focus.
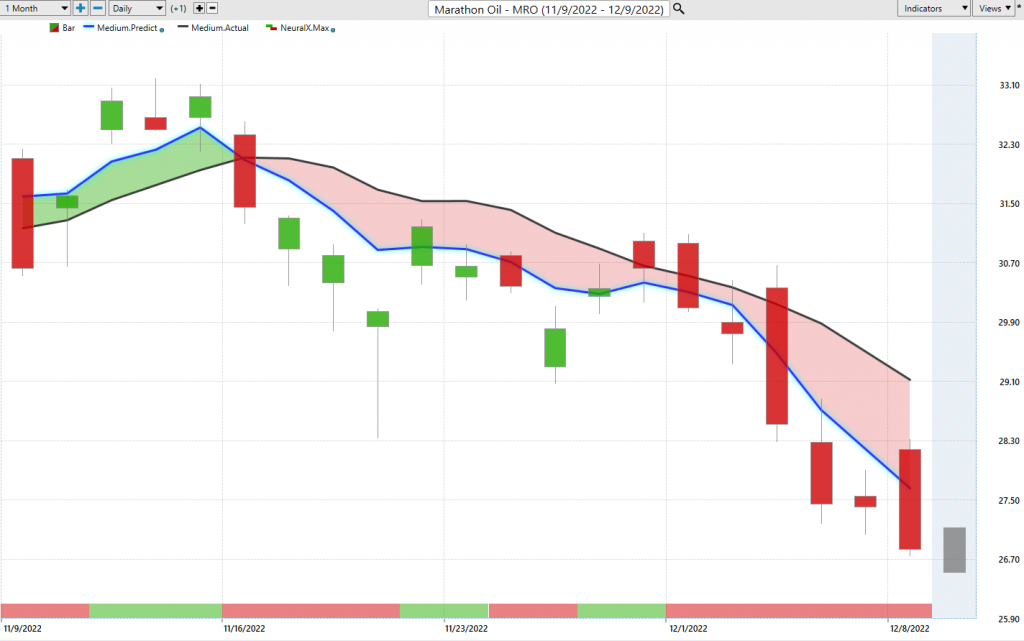
Here with Marathon Oil, you see on the stock side, you get this blue line crossing below the black line, neural index bearish. Again, you’ll see you get these periods where the neural index gets bullish. But remember, that’s just a 48-hour indicator, so it’s only ever looking ahead 48 hours at a time. So you’ll see you get these blips, you get some higher highs over the next 48 hours, but then that forecast shift to the downside and that momentum really picks up. We see as oil weakens, these energy stocks weaken and what was a really fantastic place to be positioned is now obviously, not that.
So again, as we see these important shifts in the market, like we’re seeing in many new places in the market, it can alert the trader that says, okay, well now the behavior needs to change. I can look towards these predicted highs to take a position, and then let that software guide me. Let those updated forecasts let me know, okay, well, are things on track? Are they shifting? How should I go ahead and adjust this position or take profits as this overall trend continues? So, again here at Marathon Oil, really big move here, really across the board, we’ve seen some kind of insane moves in oil. We had like a 2 or 3% rally to start the week, and then it just got crushed. Here we see about a 16% decline just over the past 16 trading days as things really can’t get going in the commodity or in the sector of the stock.
So we’ll go ahead and leave it there. A little bit of an interesting week here. We make these at the end of every Thursday. We get that shift early on in the week, and this is what it’s all about, is recognizing these things, adjusting the portfolio, and making those better trading decisions with the help of predictive technology so that you’re a step ahead of those other traders in the marketplace.
Once again, this has been the Hot Stocks Outlook for December 9, 2022. Thank you all for watching. Best of luck and bye for now.


