Hot Stocks Outlook for the Week of
February 12th, 2021
The Hot Stocks Outlook uses VantagePoint’s market forecasts that are up to 87.4% accurate, demonstrating how traders can improve their timing and direction. In this week’s video, VantagePoint Software reviews forecasts for DR Horton(DHI), Public Storage(PSA), ZioPharm Oncology(ZIOP), Ligand Pharmaceuticals(LGND), Overstock(OSTK) and Dick’s Sporting Goods (DKS)
Register for a Free Live Training
This Week’s Hot Stocks Outlook
Hello again traders and welcome back to the Hot Stocks Outlook for February 12th, 2021. Hope you’re all having a great week out in the financial markets and as always planning to cover in today’s outlook. So we’re going to start out here. We got shares of DR Horton, Public Storage, XEO Pharm, Ligand Pharmaceuticals, Overstock, and also Dick’s Sporting Goods. So a lot of individual markets to cover.
DR Horton(DHI)
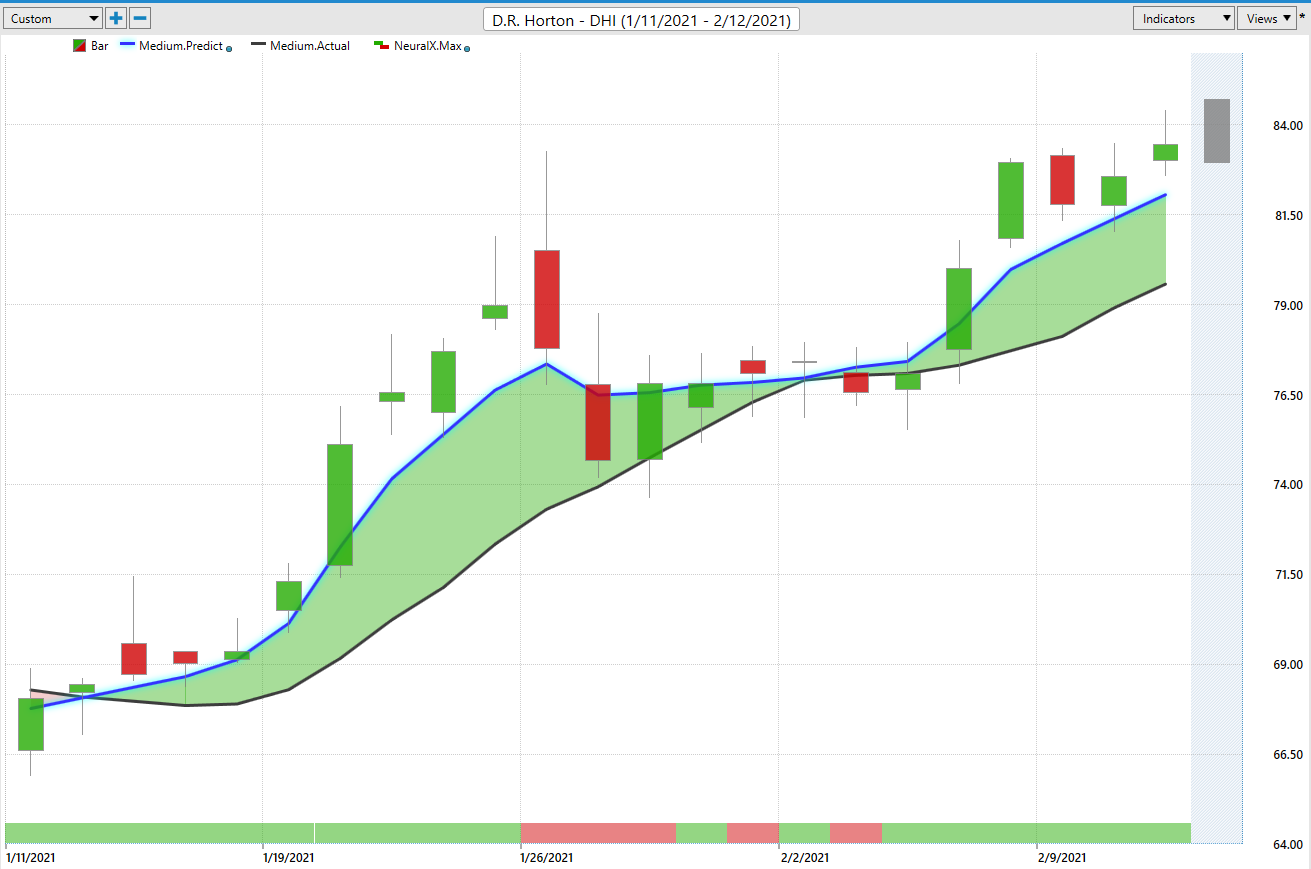
But starting here with DR Horton and something we’ve seen really all throughout the home building stocks, but what we have here is daily price action. So all of these candles represents a complete trading day and you’ll see right up against that price data there is a black line and also a blue line there. Now that black line that you see there, that is a regular simple moving average. So it’s very common technical indicator. What it does is it looks back and plots the previous price action and adds all those closed prices together and divides in this case by 10 and that’s a good measure of where market prices have been already over a given period of time. But obviously traders need to understand, okay, where is the market headed in the future?
DH Horton (DHI)
So what we’re able to do is actually compare that black line or that value on the chart to this blue value. And for that value to actually be generated, VantagePoint is using what’s called intermarket analysis and specifically the technology of artificial neural networks. And what that means is what it’s doing is looking at relationships between DR Horton and markets that are known to drive and influence future price moving forward. So that’s going to be things like individual stocks. It’s going to be things like ETF groups. It’s going to be things like the S&P 500. Global currencies, global interest rates, commodity markets and it’s able to look at those relationships, whether they be leading or lagging, positive or inverse correlations, and it uses that to actually generate future price predictions.
So actual predictions of future average prices, and it takes that information and actually uses it to construct this blue line. So it becomes a predicted moving average that rather than just getting dragged around by the most recent close is actually utilizing predictive data to generate that value. So whenever we see an instance where that blue line crosses above the black line, it suggests average prices are going to start moving higher.
Now we really have a set of indicators that work independently. If you look at the bottom of the chart here, you’ll see that there’s this bar that goes from green to red, and this gets updated each and every trading day. And what it’s able to do is, again, look at that prediction of the next 48 hours. So it’s looking ahead, but only forecasting very short term strength or weakness. This is actually tuned again to just be a 48 hour outlook as far as overall strength or weakness in the marketplace. So that’s going to help you with trade management and understand, okay, well, is there likely to be some weakness in the next couple of trading days, is there likely to be strength in the trend to continue?
And lastly, to round out the entirety of these forecasts, we move within not only that 48 hour outlook, but within intraday, where we have a predicted high and predicted low for the very next trading day. So what that allows traders to do is really be prepared for where they should set limit orders, profit targets, really depending on your overall trading strategy. So going into the market, you understand that, okay, well, I’ve got the overall trend direction and whether I want to be long or short, you’ve got short term strength or weakness from the forecast at the bottom, from that predicted neural index. And we can look and see how accurate all of those predicted high and low predictions actually are.
And you see that here, we have the… At the very right, you see this shadow candle and what’s going to happen is the trading day is going to happen and we’re going to fill in with whatever the actual market data is for today, but we can see how accurate all of those predictions have been going into the past. This is really where things get interesting is when you identify a market that you want to trade, what’s great about VantagePoint is you have an adaptive tool that’s able to every night take in that additional information and say, okay, well, where have things shifted around? How are those intermarkets affecting this target market that you’re trying to trade and then update that forecast to help you manage that opportunity and get the most out of that.
So you see here early in the trade, you get a nice movement down towards these predicted lows. Of course you want to be a buyer at or near those predicted lows. The overall trend continues higher, but you see here how the neural index goes bearish. And again, it’s alerting you to that short-term weakness so you understand that look, we’ve had a good move in the trend, a lot of volatility coming into here, but the overall trend, as long as that blue line remains above the black line, is still up. And you see if you get that understanding and say, okay, well, we’re going to have some sideways price action. Use these predicted lows to go ahead and decide where you want to go ahead and get back into that market potentially and participate in the overall move.
So we’ve got a really nice trend here. A lot of markets actually doing extremely well over the past several weeks, but here we have DR Horton up about 20% just in the past 19 trading days. And more recently, again, these predicted lows coming in here, some more recently hitting the predicted low predicted high here. So really regardless of your trading style and timeframe, you can come in and benefit from these tools.
Public Storage(PSA)
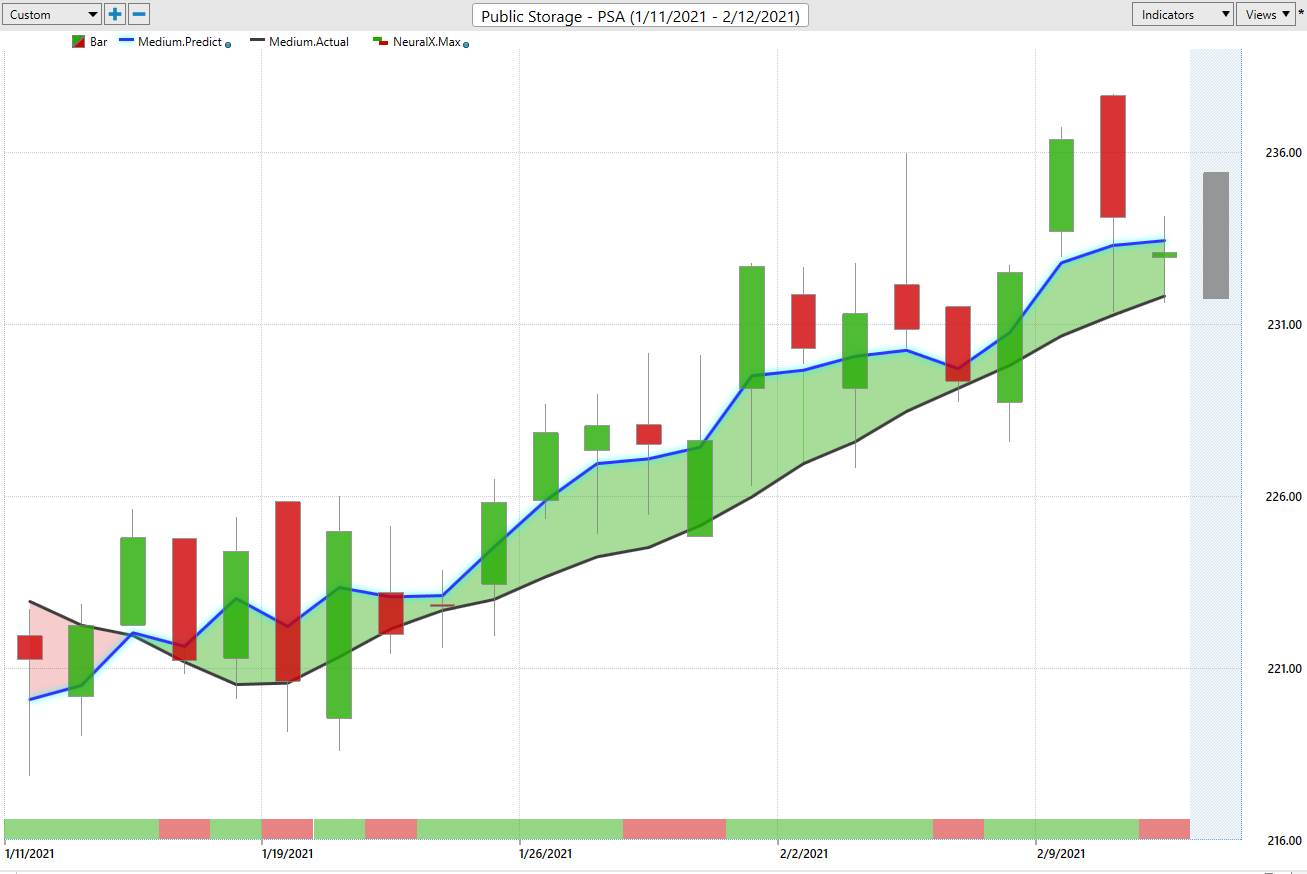
Now, Public Storage here, not a huge move, as far as the market moving from up 222 to about 237 or so, but I just want to highlight that how these software really updates. So you see, you have a big range here, as far as the overall volatility and just the average ranges and then things get a little bit more compact here. And that’s where VantagePoint has a huge advantage is in its ability to adjust to what’s going on in the market.
Public Storage (PSA)
So understand that okay, well, you see, even before these trading days here, you have these predicted ranges getting much wider and letting you know, look, be prepared for things to shake around a little bit, but as the trend continues, you see those things kind of tighten in. Telling you again, be prepared for some volatility, but of course, be ready to buy at those predicted lows and offering one, two, three, four, five, six, seven about eight entries at really good intraday prices as this market has crept up over the past few weeks here.
So again, not a huge move here. Market’s up about 6%, but understanding that, okay, well, you want to be long and you’ve got about six or seven days where you can buy at those predicted lows, have the market move higher and take some profit as the overall trend moves higher here.
ZioPharm Oncology(ZIOP)
We also have Ligand… Or ZIOPharm Oncology and Ligand Pharmaceuticals. So two healthcare stocks here, but the exact same approach of saying, okay, well, if the market’s in an uptrend, you’re going to have these periods where the neural index you see goes bearish, and you get some of that sideways price action. But overall, very clearly that blue line saying, look, the overall trend is up, look to buy at or near these predicted lows. You see the market will come down and, the here you get a gap down pretty much straight to that predicted low market immediately moving higher. But multiple entries along the way here. We’ve got about, I don’t know, eight or nine entries as this market moves from about $3 up to a little under six.
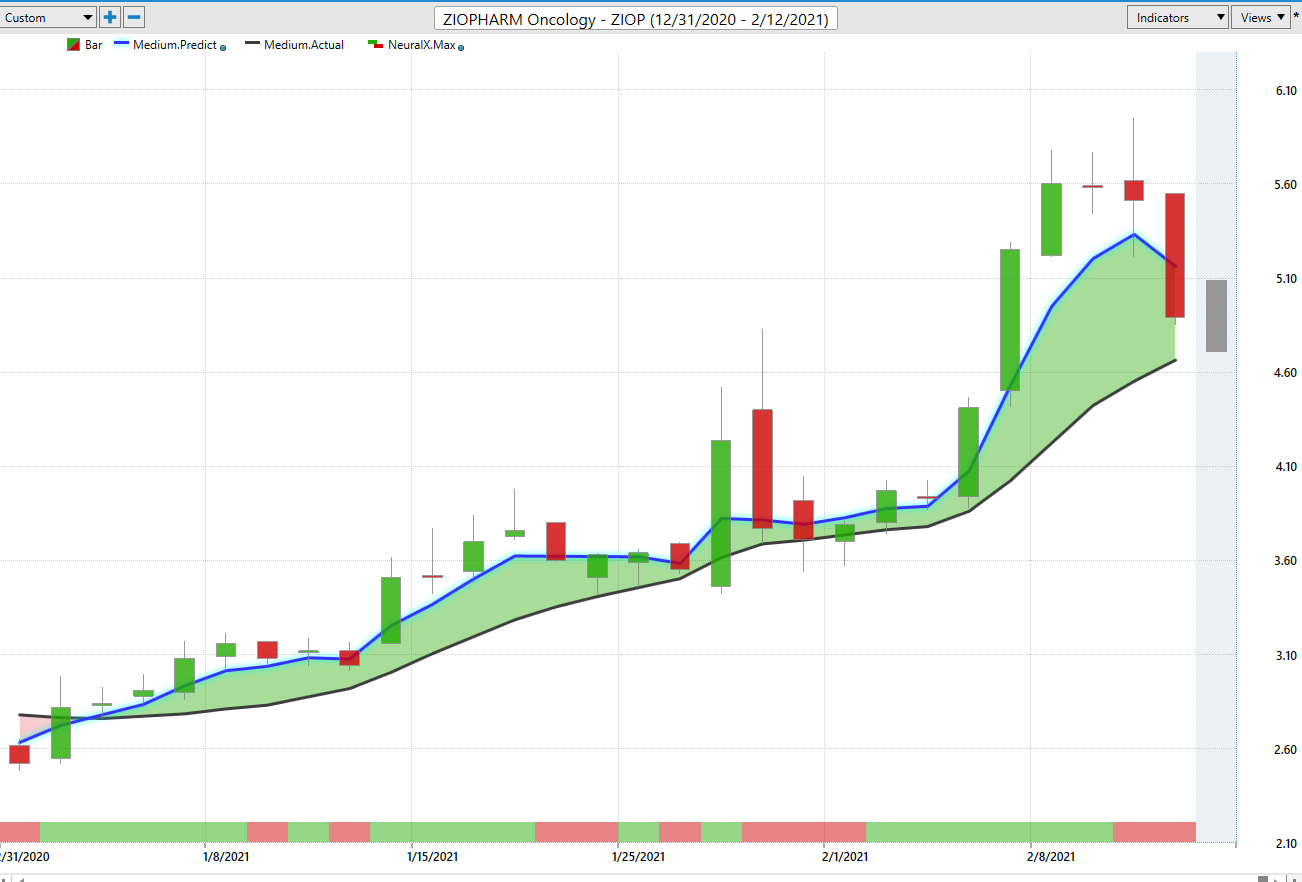
ZioPharm Oncology (ZIOP)
And so, especially when you’re in a market like this, where you’ve got a very low price level, there’s a lot of… As far as the daily percentage moves are quite large, you want to be very precise with that entry price. So you don’t have to run a huge stop loss and risk a lot to take advantage of that opportunity. Here, unlike Public Storage is up 6%, about the same time period you got a 92% rally in just the past 25 trading days. But again, over that 92% rally, where are all these entries to get long? Well, there’s plenty of them coming in at the lower part of these daily ranges here. So again about six. Recently, again, the situation buy at the predicted low, target predicted high, but take advantage of that 92% rally in just the past 25 trading days.
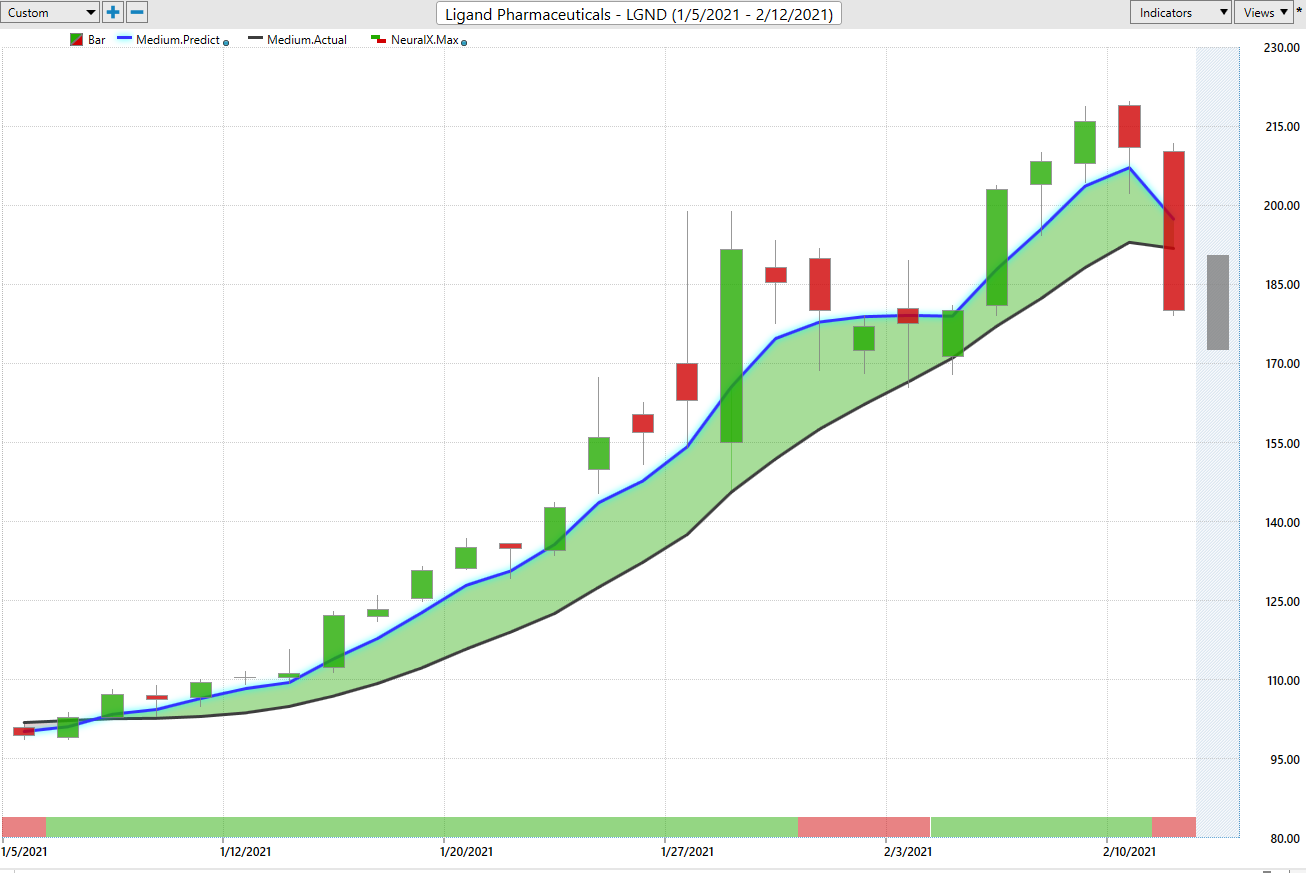
A thousand shares there is going to have about $2,600 and that’s not even a $3,000 position in total. So really great opportunities in many of these areas of the market where we’re seeing some really enormous percentage moves. Here’s a more expensive stock, but the approach is exactly the same. You get this crossover from the blue line and the black line all the way back here at the beginning of January, very clearly a lot of strength in this market up until you get about here, where it says, okay, well now expect some weakness. You get that weakness coming in, but that blue line’s still well above the black lines and the overall trend is up. But in that 48 hour outlook window expect some weakness and of course, come in with those daily levels so that, you know, okay, I want to be long. Should I expect strength or some possible weakness, but from really from this point on, it’s telling you, hey, expect some weakness here over these subsequent trading days.
Ligand Pharmaceuticals(LGND)
But as long as that trend is up, and you’ve got a game plan there, be willing to go ahead and accept those better prices as far as those intraday lows that are coming in and then participate on this next up move as the market pushes past 200 here. So overall you’ve got a really tremendous rally, really nice entry here early on at the start of that move, but market’s up 104%. So it doesn’t have to be those two and $3 stocks that can move 104%. Here you have a stock going from about a hundred to over 200 in just the past 23 trading days. There are about 500 shares, maybe some option contracts, you’re about $55,000 on a move there.
Ligand Pharmaceuticals (LGND)
Overstock(OSTK)
Here’s Overstock.com. Again, another one of these markets, you move from 50 to a hundred. So you see shares literally doubling in just a couple months time, about a month and a half on the calendar. But very clearly here at January, you’re getting that crossover to the upside. Neural index here warning you of some subsequent lower lows that will come through over these trading days whenever that neural index gets bearish. But clearly that predicted moving average is well above the actual moving average and the trend is very clearly to the upside. So of course you want to come in and say, okay, well on each one of these trading days, where would I be looking to get involved in the market?
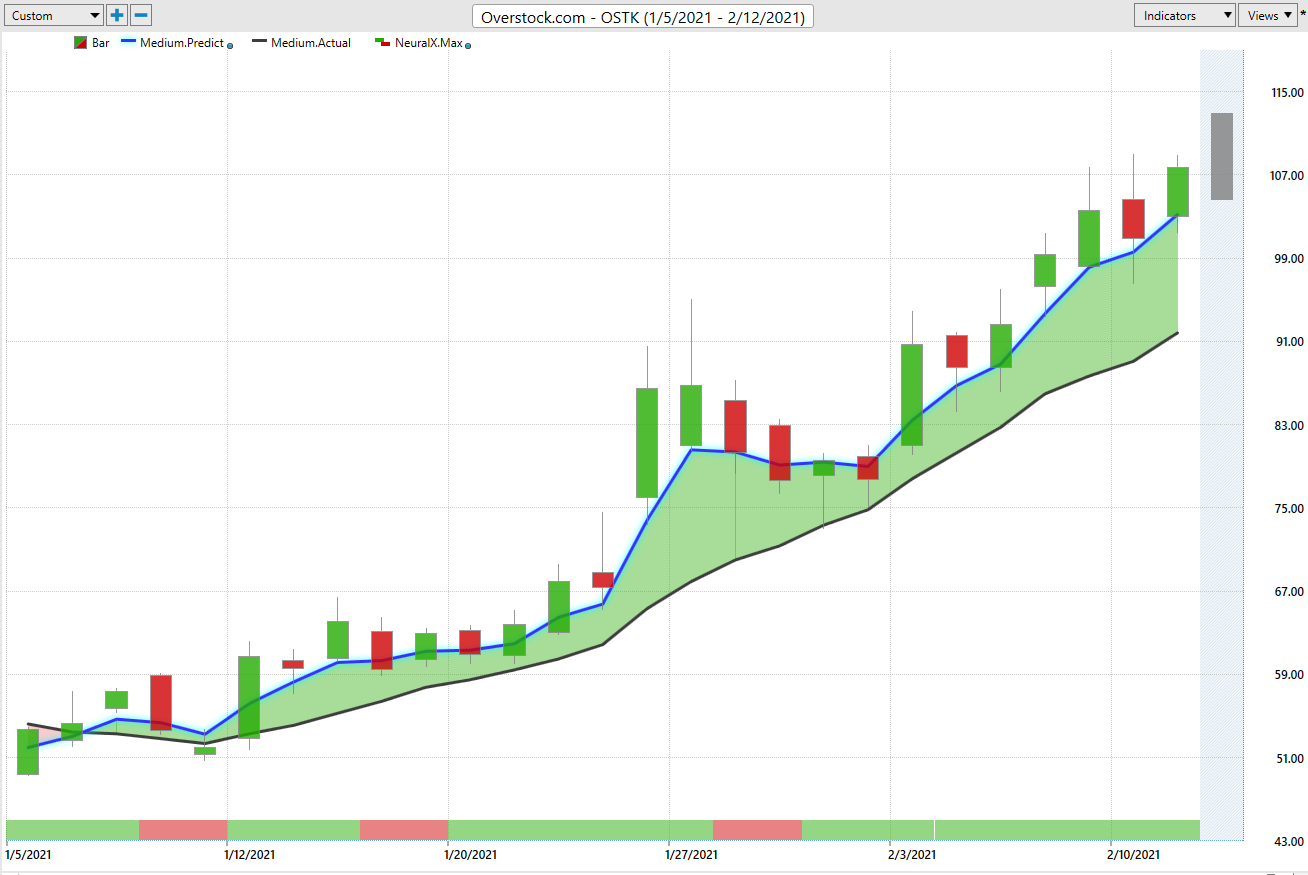
Overstock (OSTK)
And this is what’s great is before the trading day occurs, so 6:00 PM the night before, you have all of these levels. So when you’re looking at, okay, well, where do I want to place a limit order going into the trading day? Well, you can go ahead and set that limit order, get involved in the market and you’re pretty much done for the day. So just really tremendous opportunities and really get a lot of places throughout the market here. And of course the VantagePoint Forecast, regardless of we’re getting a lot of volatility and large percentage moves are going to, like with Public Storage there, adapt to what’s going on in the market and make sure that you’re prepared saying, okay, well, where should I get involved? Where can I adjust this position or manage it over time? And here you see another 82% rally in just the past 23 trading days. Again, 500 shares there has you up about 22, almost $23,000.
Dick’s Sporting Goods (DKS)
Here’s Dick’s Sporting Goods, a market we’ve covered really repeatedly over the past month and you see, has remained in that uptrend. So outside of these few periods where the market runs sideways and the neural index is bearish for a couple of days, the overall trend is still to the upside. So you want to understand and say, okay, well, you’ve got those daily predicted low levels to come in. You see here really is telling you to really be careful of potentially a big dip. We don’t get too much of a big dip there, but if you’re ready to buy at the predicted lows, getting a really nice entry again at the lower part of that overall range and not getting caught up as far as stop-losses being in the wrong place at the wrong time.
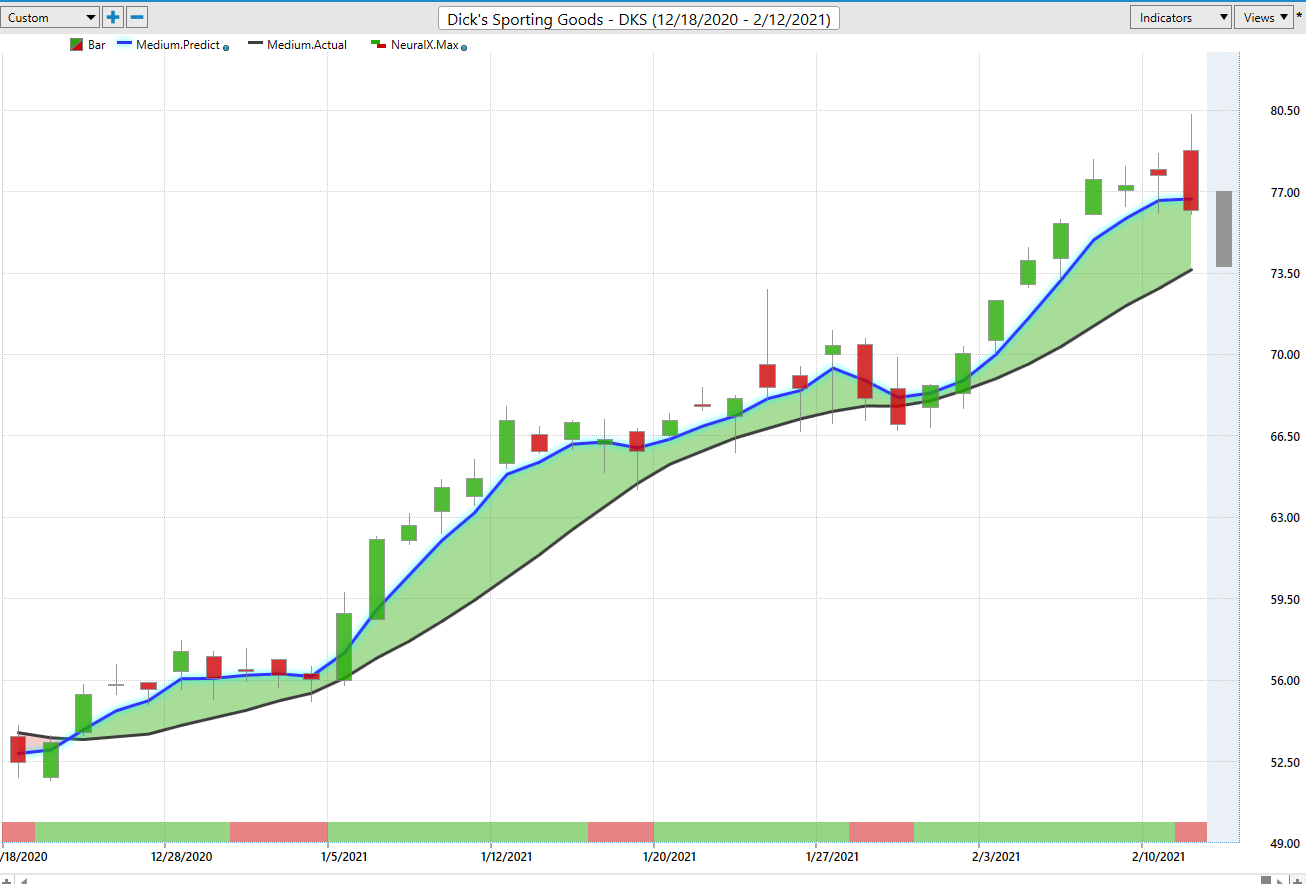
Dick’s Sporting Goods (DKS)
So here with Dick’s Sporting Goods, going to current day here, we’ve got a move of 43% in the past 34 trading days. Again, there that was actually back in mid December that market starting to move higher. So there’s some really great tools here as far as scanning for new opportunities found within the IntelliScan. So what the software is able to do is literally allow you to scan hundreds of markets and find these areas where fresh crossovers are being created so that you can recognize that hey, there’s a new trend starting. Let’s focus in on stock X, Y, Z, whatever the stock might be, and then move forward with that opportunity benefiting from these forward-looking forecasts to help you manage those trading opportunities. So, once again, this has been our Hot Stocks Outlook for February 12th, 2021. Thank you all for watching best of luck out there and bye for now.