


Hot Stocks Outlook for the Week of
February 26th, 2021
The Hot Stocks Outlook uses VantagePoint’s market forecasts that are up to 87.4% accurate, demonstrating how traders can improve their timing and direction. In this week’s video, VantagePoint Software reviews forecasts for Cincinnati Financial (CINF), Goodyear Tire (GT), Johnson Controls (JCI), PBF Energy (PBF) and OraSure Technologies (OSUR)
Register for a Free Live Training
Cincinnati Financial (CINF)
Now, starting out with Cincinnati Financial… and this is really how all the forecasts work within VantagePoint. It’s really this combination of what we call these predictive indicators. And what we have here with Cincinnati Financial is daily price action. So each one of these bars represents a complete trading day and you see right up against that price data, you have a black and a blue line. Now, the black line that you see there, that is a regular simple moving average. So a very common technical indicator that looks back over the previous price data. It’ll add, in this case, 10 close prices together, add those altogether, and then divide by 10. And that acts as a good measure of where market prices have already been. It works to smooth out that data in the overall price action.
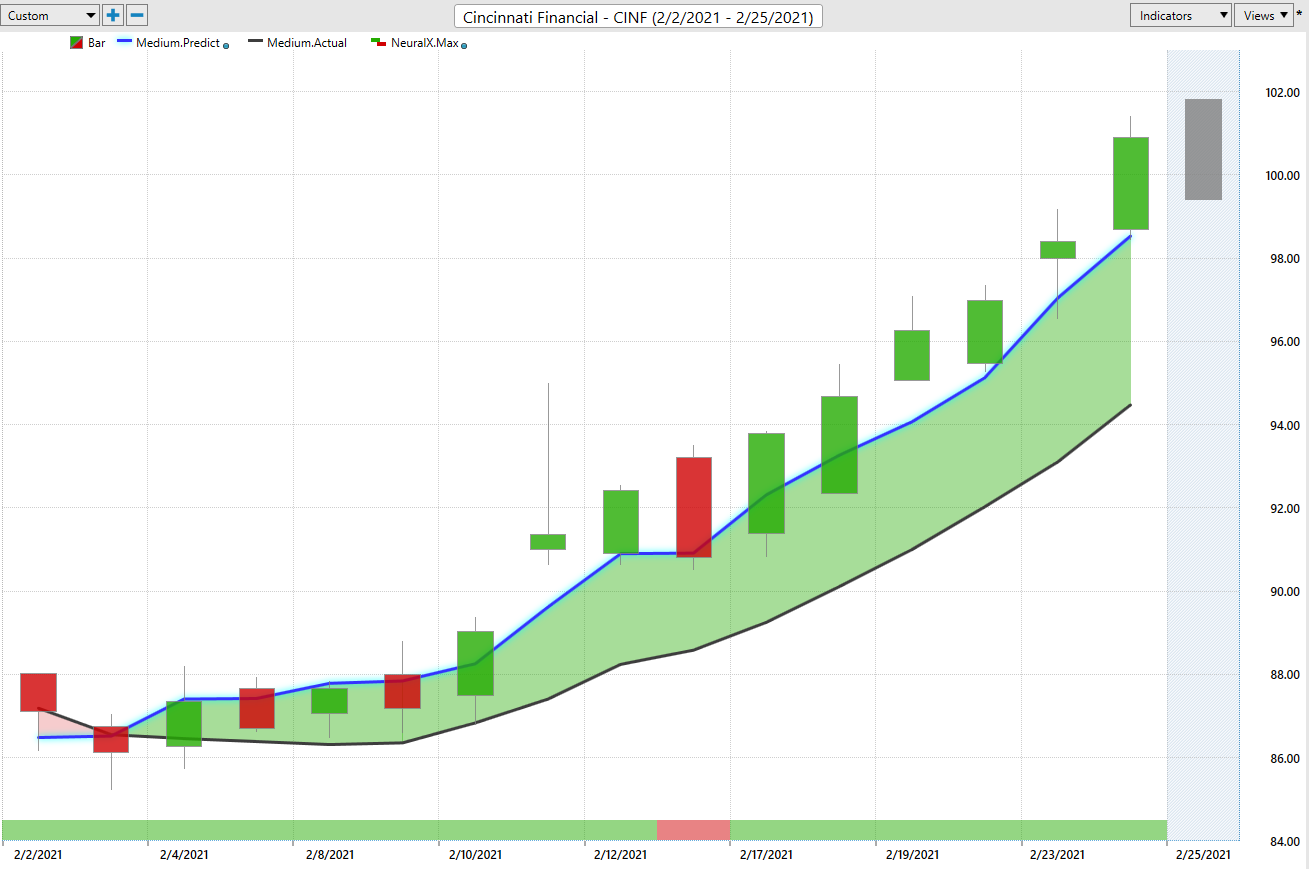
But obviously, traders need to be ahead of a market move and understand where are prices likely to go moving forward into the future. And so what we’re able to compare that black value to or that regular simple moving average is this blue line that you see up against the chart. And that is actually VantagePoint’s proprietary predicted moving average. And to calculate that, VantagePoint is performing what’s called intermarket analysis, and it’s specifically utilizing a type of artificial intelligence, artificial neural networks to do that.
So that means rather than just looking at the past price of Cincinnati Financial, like a simple moving average would do, VantagePoint is looking at intermarket relationships. So that can be things from broader ETF groups, like the Financial ETF. That can be things from individual stocks and other financial stocks. It can be from other nonfinancial stocks. It can be things like global currencies and global interest rates, even global futures in commodity markets. And so it takes that global look at how the international markets and domestic markets are shifting, driving, and influencing this target market, specifically Cincinnati Financial, and then, it uses that to generate an actual price prediction. So actual prediction in the future that hasn’t yet occurred. And it utilizes that predictive data and builds it to construct these indicators.
So rather than having a lagging average, that really just gets dragged around by the most recent close price, you have a forward-looking predictive tool. So whenever that blue line crosses above the black line it’s forecasting prices to start moving higher, average prices to start going up. Now, in addition to that predicted moving average, you look at the bottom of the chart here and you’ll see that there’s this green… You see it goes from red back to green, and this gets updated every single trading day. And this is again, tuned with that technology of artificial neural networks, but it’s tuned to just look ahead 48 hours at a time. So it’s a very short term signal of strength or weakness in the marketplace.
And at the very top hand right, you’ll see that there is a shadow candle here and that’s a predicted and a predicted low. So when you combine all this to really round out the VantagePoint forecast, you’ve got intraday levels of predicted high, predicted low, you’ve got short-term strength or weakness with your neural index, and you’ve also got the overall trend and overall direction of average prices moving forward. And so whenever that blue line crosses above the black line, we’re suggesting, “Look, average prices are likely to start moving higher. That doesn’t mean they’re going to go straight up, but what it means is you’d likely want to look for long positions in the market.”
Here, you see about a 15% rally so far, up 15.5% just the past 14 trading days. And we’ve seen a lot of markets making moves like this, and even more impressive than this all over the place. So here you have about 500 share position, you’re up about $6,800 if you get in at that predicted moving average crossover, but we actually have to look back and see, “Okay, well, how might you have managed that position with the help of things like the daily predicted highs and lows.”
And so, what we can do is actually look back here and we can see how accurate all of those past price predictions were against the actual market data. And you see here, it offers you some very good guidance to say, “Okay, well, if this is a market where I want to be long, where do I want to be looking to come in and accept prices?” And when you see the market down at, or near these predicted lows to the very good opportunity you’ve done the rest of your homework, understand what kind of trade are you looking to get into, to go ahead and take that position, in this case to the upside.
You see about four, maybe potentially multiple entries here. If you’re buying anywhere towards these predicted lows and then benefiting as that trend really starts to move to the upside and you start breaking past those predicted highs. But over that 15% move, you’re about four entries, even after you’ve maybe accumulated some profit to come in there and get more aggressive with the trade.
Goodyear Tire (GT)
Now, moving forward here as Goodyear Tire and Rubber, and they had a lot of good news as far as an acquisition of Cooper Tire recently, but you see that was very recent. On this candle here, going all the way back towards the beginning of February, it says, “Look, prices are going to start moving higher. This is a place where you want to look to get long.” You see that blue line maintains that distance above the black line signaling the overall trend has remained up, but you see right here, this neural index, it gets to bearish and lets you know, “Expect some weakness over the next couple of trading days.”
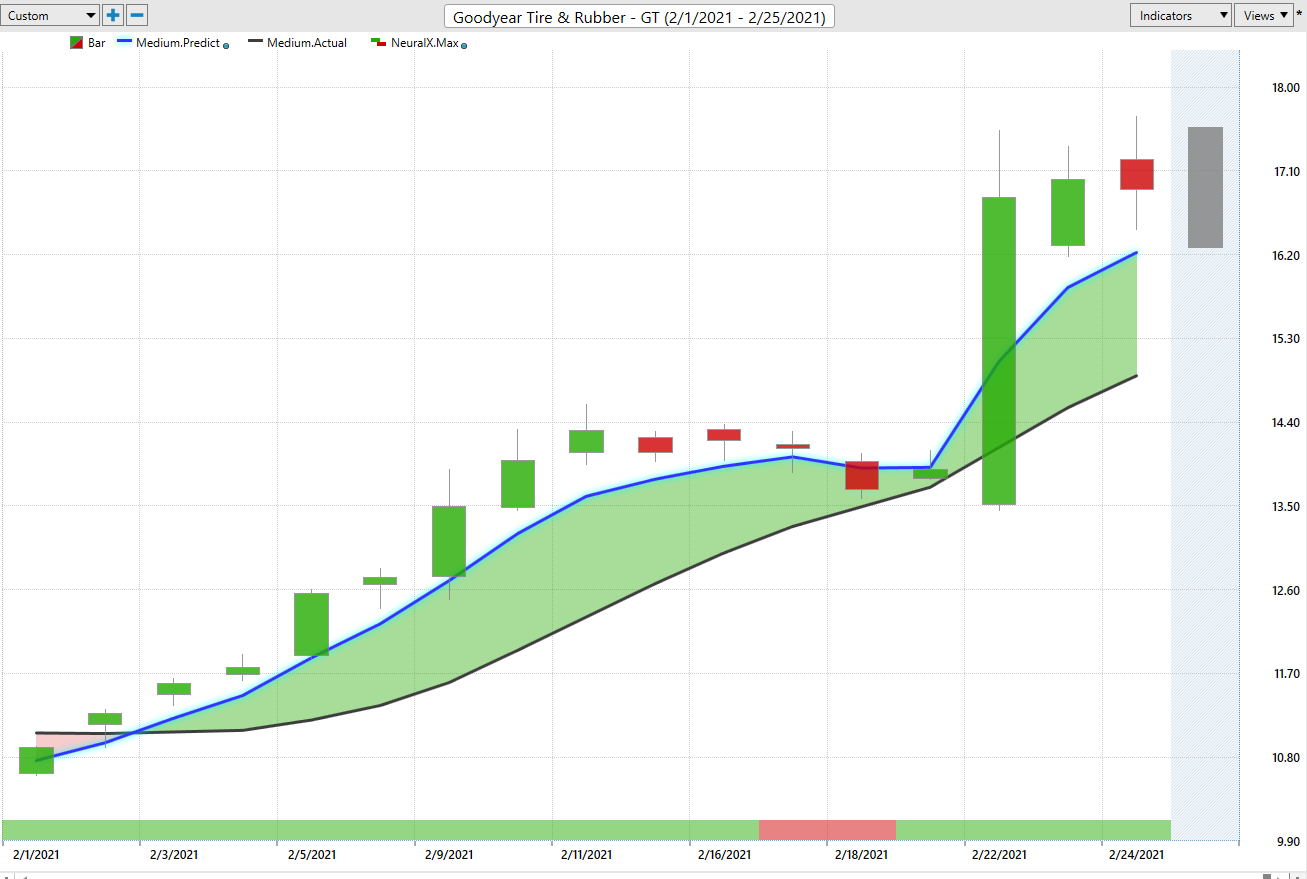
And why that’s important is because when you’re long in the market and volatility is coming in, you want to understand, “When should I expect this market to trade possibly below things like the predicted moving average?” If it’s an average, we can trade above and below it, but when that neural index goes bearish, you’re likely to see some weakness in prices over that time period. And again, we can look at those predicted highs and lows and say, “Okay, well, if you’re looking to go ahead and get long Goodyear, obviously the market starts back here. You can go ahead and get involved in the market, but here you get a nice dip towards that predicted low, really nice entry in the market.”
Here again, hitting that predicted low. And after this trading day, letting you know that look, “Expect some softening of prices here.” You see, you have a predicted low here where you don’t quite hit it that trading day, but then the next day gap down before that big move to the upside takes off. So really nice opportunity here as far as shares of Goodyear tire and benefiting from some of those fundamentals coming into the market, but you see that that was really one day, almost three weeks after VantagePoint forecast said, “It’s time to go ahead and get long.” This market shares up about 47% in the last 15 trading days. Again, 500 shares there has you have about $2,700 on a position.
Johnson Controls (JCI)
Here’s Johnson Controls, and you see sort of the theme with a lot of these markets and you see that a lot of markets turn up they’re down at the same time. And it’s very important to recognize when that strength is coming into different areas of the marketplace. But here in Johnson Controls, we see again in early February, getting this crossover to the upside, not much in the way of the neural index getting weak here, you see it gets weak here, and you get a little bit of a gap down the next trading day, but overall, shares moving pretty solidly to the upside. We can again, look at those predicted highs and lows and understand that when you’re coming in during this period, you want to understand where should I be looking to take a position?
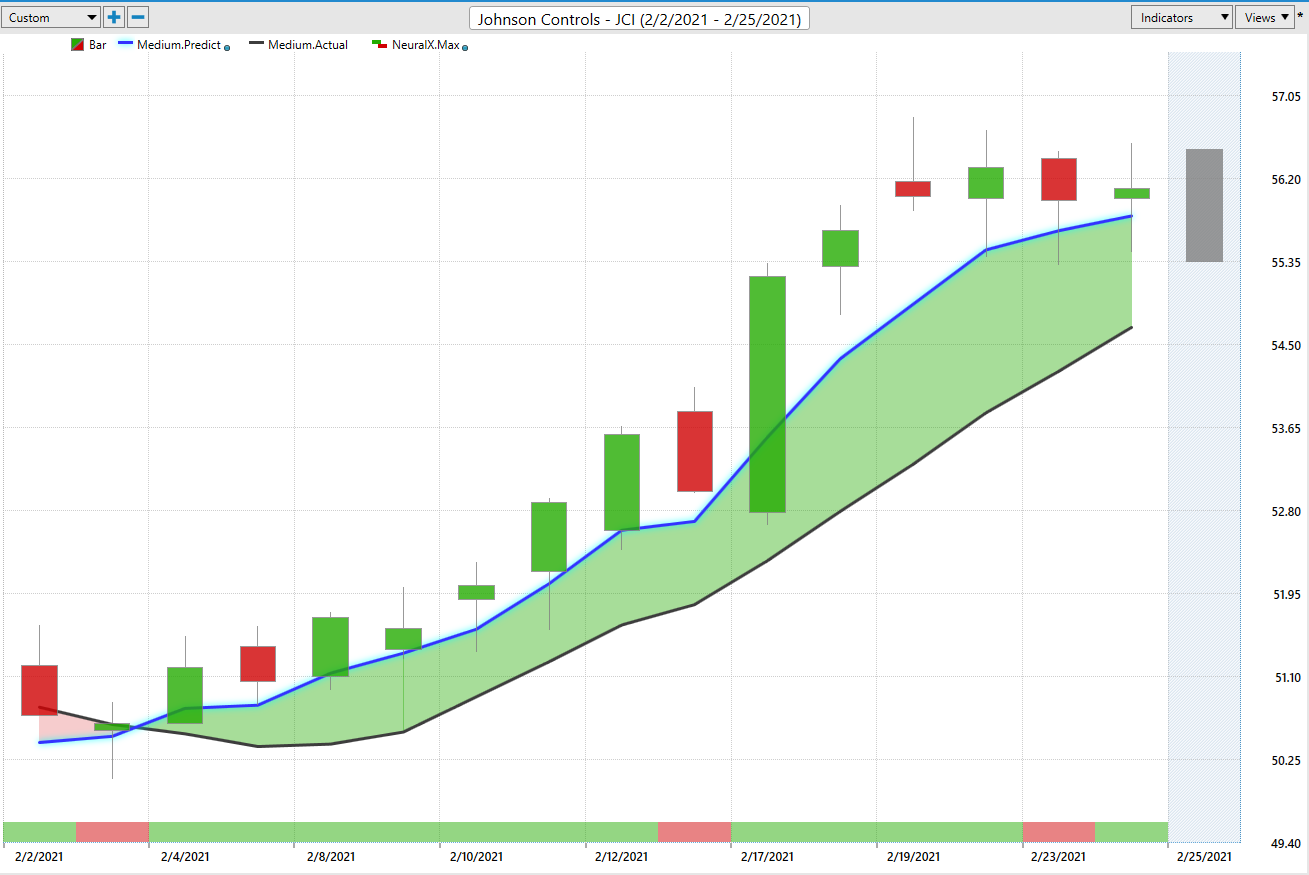
And you see how you break outside the predicted high here as that uptrend really starts to accelerate, that’s where a VantagePoint does a really great job at saying, “Look, where did this market close? Where did those inter markets closed that affect the future price of Johnson and really adapt to that condition and say, ‘Okay, well, where are things going moving forward?’ Let’s get back on track as far as those predicted highs and lows so that you can again, participate in that market.”
And you see, you get real close to these predicted lows when you’re real great job here, a little bit of volatility here coming in. But again, just hitting the predicted low, bouncing up here, hitting the predicted high understanding where you want to come in and participate in any market you like. And understand that you’re getting a forecast, it’s not just looking at the past price action and getting dragged around, but it’s understanding which independent markets, which inter-markets are affecting Johnson Controls specifically. And that’s important because that’s the market that you’re going to be trading in. And there’s going to be a unique set of inter markets that affect future price.
PBF Energy (PBF)
Here, PBF Energies, a much longer term opportunity now. The energy’s turned really back in November to the upside, and there was some really great crossovers to the upside from VantagePoint and things sort of settled down a little bit, but here we see in PBF Energies, a lot of those things starting to move higher. Again, as oil has just trucked on higher and higher and higher, day after day. And you see here that you get these periods of volatility and the neural index goes bearish. You get some weakness over some of these subsequent price trading days here, but the overall trend is to the upside. And that’s where it’s very important to make sure that you maintain your position when that trend is still to the upside and not get shaken out of a position by some strength or weakness in the marketplace over the short term.
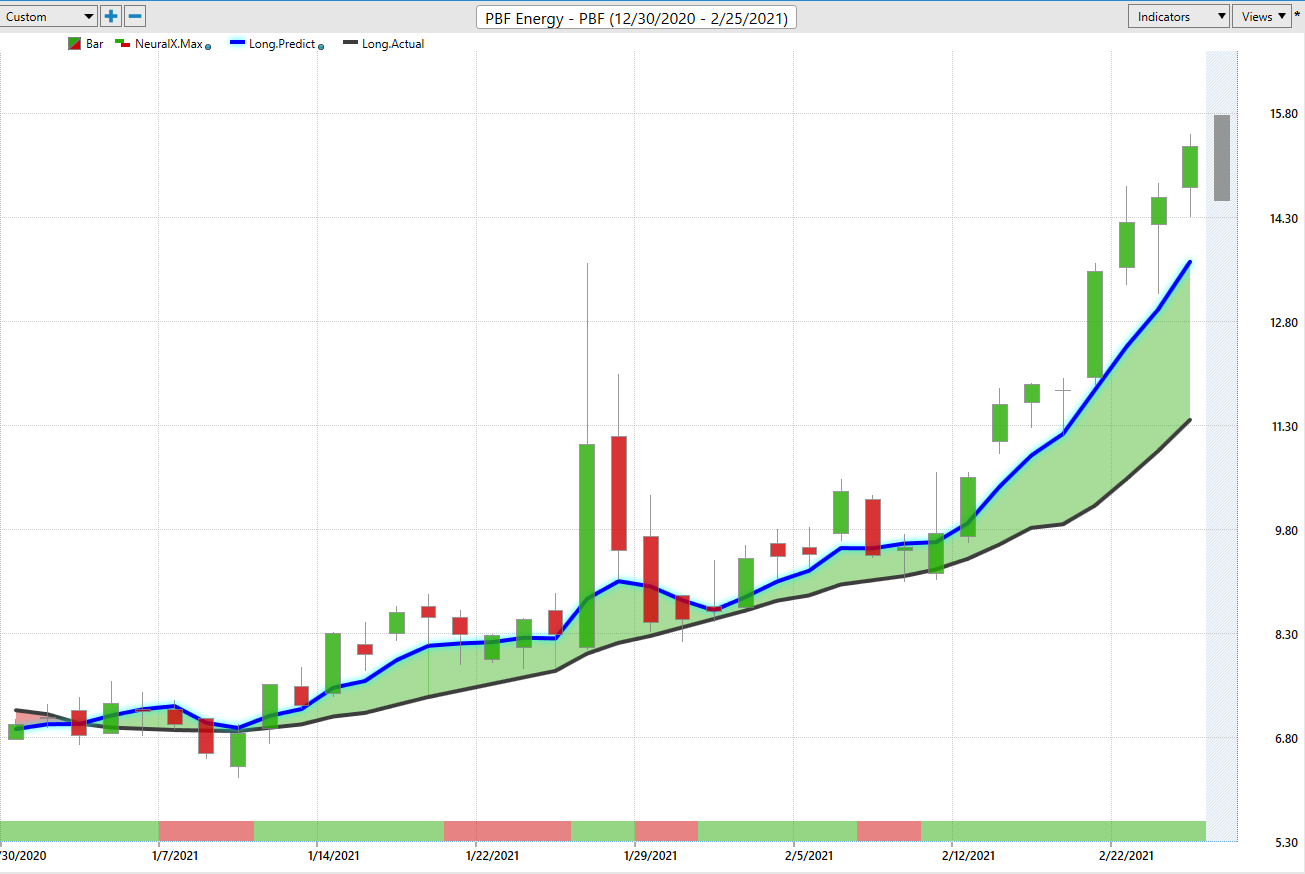
So overall, this is an extremely accurate indicator upwards of 86, 87% accurate in many markets at doing that 48 hour, that short-term forecast. But when you combine that with your predicted moving averages, when you combine it with the predicted highs and lows, it really round out the entirety of that forecast and it makes sure that you’re prepared for what’s likely to occur, even in the very short term, as far as the trading day goes.
So again, we can come back here and see, “Okay, well, let’s look at those predicted lows and where might you be looking to take positions in this market?” And you see that things take a long time sometimes to get going, but that’s where having a very accurate level of the predicted range can help you. You can get involved in the market, take a little profit, buy back at lower prices, but understand that if you accumulate a position back here, that you may want to accumulate more back here, take some profit at predicted highs and that can really make a big difference as far as how much money you’re able to pull out of a market here.
So this has been a huge opportunity here with shares pretty much doubling from about $7 to 15 in this case, but very clearly, that blue line maintaining that direction over the black line and saying, “Look, the overall trend is up. We’re going to have a little volatility in prices move up and down, of course, but over these 35 trading days, you only want to get long, take profit on long positions.” And you see there even just 500 shares on a very cheap, cheap stock, has you up about $4,000 to the upside.
OraSure Technologies (OSUR)
Lastly here, let’s take a look at OraSure Technologies. And so here, we have markets moving up very considerably over a long period of time. Most of these markets, you see a forecasted in uptrend, but that doesn’t mean that all markets are moving up. And of course you want to understand when that potential shift happens in the market, you should actually go ahead and take profit or actually short some of these opportunities. But here in OraSure, a really good example of how we can identify those things changing.
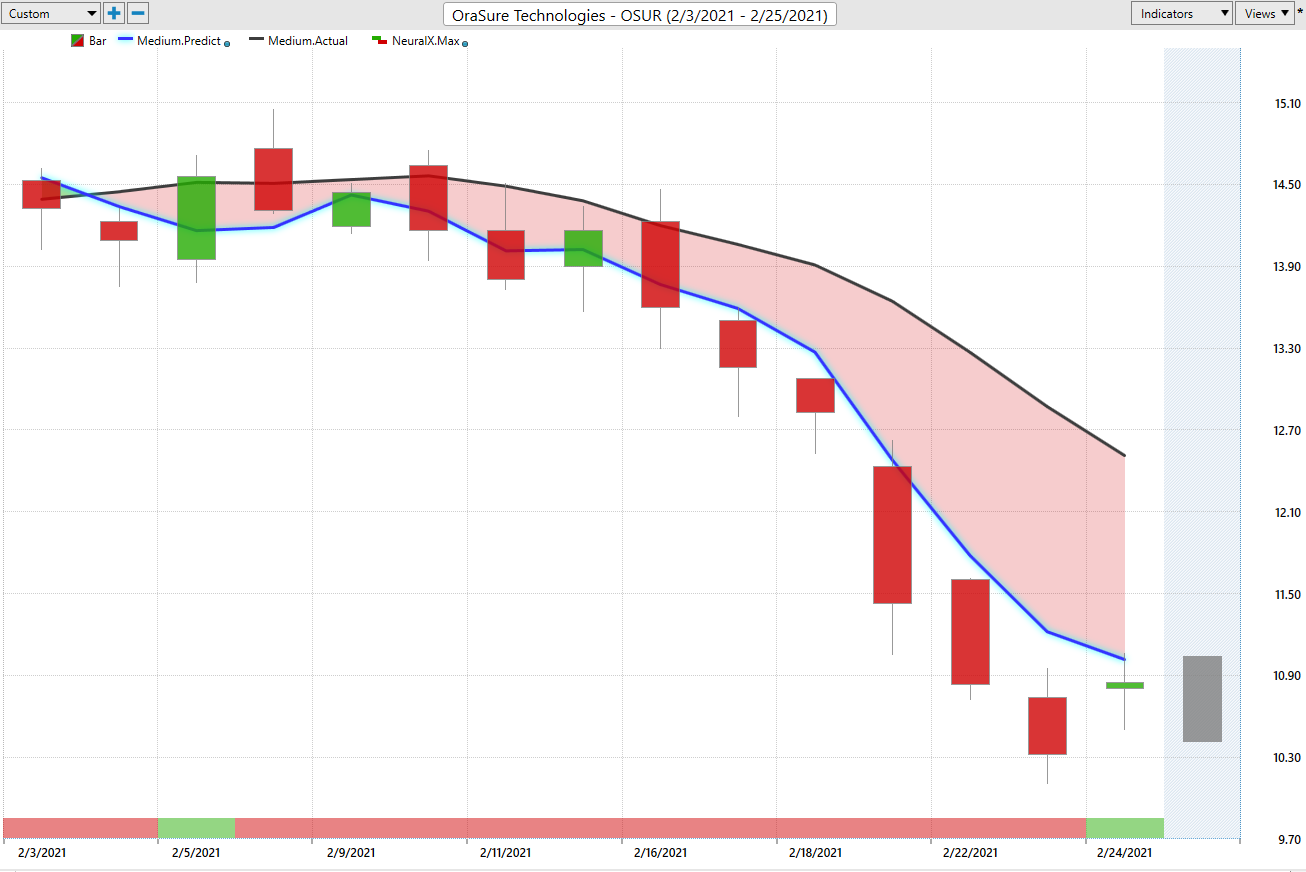
And we have a feature here called the Intelliscan, which really allows us to scan for new opportunities and find out when these markets are shifting so it can be ahead of many of those moves. But here in OraSure, what we have here is this crossover to the upside, back in January. And it really nice opportunity to ride that market up over the few weeks that things started moving higher, but you see how things shift here. So it starts really early, your neural index’s bearish, letting you know, “Expect some weakness over the next couple of trading days, but then once you get that crossover to the downside, you understand, look, you have to change that overall strategy. Either take some profit or even look to go ahead and short the market.”
And we can go ahead and Mark that day where things shifted as far as the overall trend direction and look at these predicted highs and lows. And so on the way up, we understand, okay, we can get long, we can target these predicted highs. We can buy back down at these predicted lows, very clear what the overall strategy should be. But after this trading day here, we understand that we should expect some cheaper prices, so expect to pull back in the market. And then very clearly from this point on, definitely getting out of the long positions and actually using this opportunity to sell the market or potentially, short the market. And you see a really nice move to the downside thus far.
And this is very important because when markets make really strong rallies higher, they can also snap back and reverse very quickly and the thing you want to do is give back a lot of profit because you didn’t understand when to get out of the market. So here we see a shares down over 25%. So pretty much what they made to the upside pretty much wiped out and just 12 trading days. And again, 500 shares there. If you’re long, you’re going to lose $1,800 if you don’t understand to take those profits and potentially reverse that position to the downside.
So once again, just really nice opportunities spread out all throughout the market. There’s been tremendous rallies going on in many stocks, huge percentage gains, but of course you want that guidance to understand where can you get that portfolio long? Where can you potentially short? And then, really regardless of what happens in the markets, you’ve got something that’s really working out for you.
So once again, this has been our Hot Stocks outlook for February 26, 2021. Thank you all for watching. Best of luck out there and bye for now.