Hot Stocks Outlook for the Week of January 10, 2020
The Hot Stocks Outlook uses VantagePoint’s market forecasts that are up to 87.4% accurate, demonstrating how traders can improve their timing and direction. In this week’s video, VantagePoint Software reviews forecasts for Beacon Roofing Supply (BECN), VeriSign (VRSN), Huntington Bancshares (HBAN), Incyte (INCY), and Shopify (SHOP).
Register for a Free Live Training!
This Week’s Hot Stocks Outlook
Hello again, traders and welcome back to the Hot Stocks Outlook for January 10th, 2020. I hope you all are having an excellent week in the financial markets, and plenty of opportunities to cover in this week’s outlook. We’re going to go ahead and start here with Beacon Roofing Supply. We’ve got Verisign, Huntington Bank shares here, Insight, and lastly Shopify, which is one of these stocks that we’ve looked at for several weeks moving forward here.
Beacon Roofing Supply (BECN)
But starting here with Beacon Roofing Supply and what we have here really works the same regardless of the markets that you’re trading. When you look at this chart, you see that we have daily candles. Each one of these candles represents a full and complete trading day. And right up against that price day, do you see that there’s a black line and there’s a blue line. Now at the bottom of the screen, you’ll also see this bar that can go from a red to a green configuration. And all the way towards the right, you have a predicted high and low candle that’s generated before each and every trading day.
In this case, Beacon Roofing Supply. Now that can be things like ETFs, that can be individual stocks, but also very important relationships in the S&P 500, the NASDAQ, the Russell 2000, things like the dollar index, currencies, futures markets, and it’s understanding how these markets can influence the future price moving forward and then it builds that information into these indicators, thus turning them from lagging indicators like this black line. It really just tells you where prices have been, into this predicted moving average. It’s letting you know, okay, average prices once that blue line crosses above the black line, expected to start moving higher.
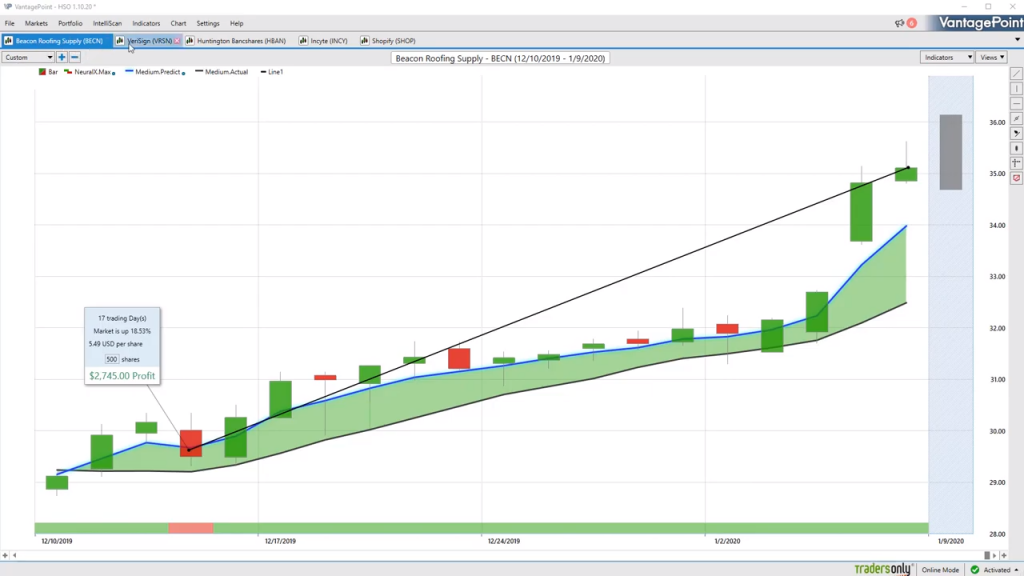
Now in addition to that black and blue line, you also have this indicator at the bottom. Now what’s interesting about this is this is a highly accurate indicator, but it’s only looking ahead 48 hours at a time. Very short term strength or weakness in the market, but very important to understand, okay, is there likely to be a little bit of weakness here? Is there persistent strength? And you can see how this works. And when we look at more of these charts, how I like to look at this is when that neural index goes to a bearish mode there, it’s telling you, look, you’re likely to trade on the lower part of the predicted moving average. If we have a gauge of average prices and where they should be, well we can trade above and below that average at times.
Now really to round out everything, you have that predicted high and low level, so actually an intraday level before each and every market day and we can see exactly how those levels perform going forward. You see here that if you’re trying to buy shares of Beacon here, you have a day right here where you go ahead and get picked up if you have a limit order there. Another opportunity here, here, here, and this trend continues. Now you’ll notice again where that neural index goes bearish, you get a little bit of a weakness there. You’re trading below that predicted moving average, but the blue line is still very much above the black line. And let you know, look, the trend is still in place. You want to go ahead and stick around here and you see over the course of this move so far, a really nice opportunity to the upside shares. Up over 18%, 500 shares have you have up to $2,700 in profit.
VeriSign (VRSN)
Now again, regardless of the market, you’re trading, we go to Verisign here and it’s really the same thing. You’ve got that predicted moving average letting you know when a new opportunity is beginning, but you will have those periods of, along a particular opportunity where prices drift down a little bit. See, so you see that the neural index gets bearish. You trade on the lower side of that predicted moving average, but the trend is still very much to the upside. As long as that predicted moving average is above the actual moving average, the overall trend is still higher. And of course, again, you can use the help of those predicted highs and lows along the course of trade to understand, okay, well where can I add to my position? Where should I look to take a profit? Make sure that you’re staying on the right side of that particular market.
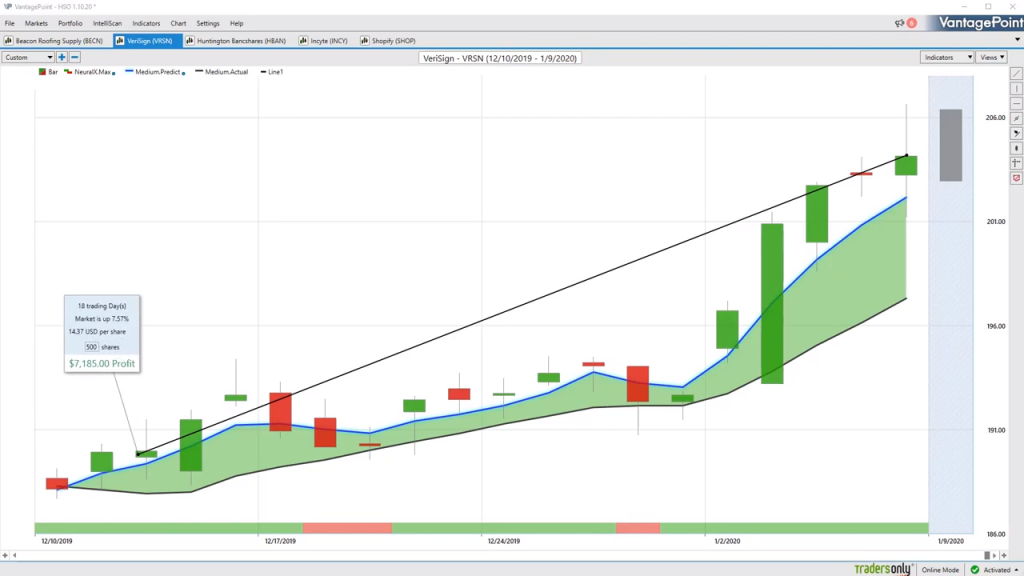
Again here, shares a Verisign really nice rallies recently here in many of these shares. We’ve had a lot of broad-based sectors doing really well really since last October when the market started turning higher. But here’s some more opportunities up 7.5%. Again, a higher price stock but up considerably on a few 100 shares there.
Huntington Bancshares (HBAN)
Now Huntington Bank shares here saw a little bit of weakness in financials over the past couple of weeks here, more the smaller and midsize financial companies. But here we have Huntington Bank shares crossover to the downside here and this is very important to understand not only areas where you can hedge your portfolio and get short, but also go ahead and just, play the market to the short side and understand where that weakness is coming in. Now we have a lot of mixed markets out there. Some things moving up and some things going lower and that’s where it can be very beneficial to actually go ahead and take some short positions here. We see this blue line crossing below the black line, making it very clear you do not want to belong through December and through the beginning of the new year here. But also look at the accuracy of the shorter term forecast and understanding that look, you’re likely to trade sideways here. You’re likely to move to the bullish side of that predicted moving average. And understand that.
You see another situation here where the neural index most recently gets green. Hey, well you’re likely to trade up here. Go ahead and improve that overall position rather than just sitting there and waiting for prices to keep moving lower. There’s likely a better chance you can get those better prices. And again, you see those predicted highs and lows. On a day like this, he actually gets filled at the open. When you get those gaps higher, if you have a limit order waiting to get a really nice fill, the market immediately starts moving lower. But again, look how accurate these predicted levels are at letting you know if you’re a short term trader, hey, where should I look to take profit? Where should I add to my position?
But understanding, look, you only want to be short here. The trend is very much to the downside and make sure that you act accordingly and again, really nice opportunity here just over the past couple weeks here, shares off about over 5%. again, 400 bucks just on 500 shares of really cheap stock here, so not a huge risk you got to take there.
Incyte (INCY)
Here shares of Incyte, very similar situation here. Crossover to the downside. Again, neural index gets a little bullish here at times and you see that you trade to the north side of that predicted moving average, but very clearly this market is in a downtrend and these are really the things you really want to avoid, these big gaps and moves on the market. You see just how much weakness is forecasted from both the short term and long term indicators saying, look, don’t belong here. If you’re going to be doing anything, make sure you’re on the short side of that particular market. You also see how these predicted levels really do a great job of adapting moving forward.
And so you see you get these areas where go break lower, but of course, you’re in a downtrend so you expect to eventually break lower and of course, breaking much lower at this point here. But again, really nice opportunity to take a short position and actually make money on the downside here as we’ve had markets really run sideways a little bit here. Some things moving up, some things moving lower, but here, 17% decline here in just the past 16 trading days. When you understand those areas to clearly avoid, it makes it a lot easier to understand, okay, well where should I focus my attention? What sectors? What individual stocks should get my focus?
Shopify (SHOP)
Lastly here, Shopify. We had all these markets all the way back from October, the healthcare and biotech shares that just went straight up for three or four months now. Here’s a Shopify, another one of these opportunities that we’ve been charting along really a few times over the past several months. But really, really wanted to do is just highlight the accuracy of those predicted highs and lows moving forward. Even if you recognize that, hey, there’s a really strong trend here, well how can you go ahead and actually trade that opportunity really regardless of your overall trading style? Well, you understand, well, if I’m short term, what do I want to be doing? Well, I want to be looking at these predicted low levels as far as intraday levels to get in. And if I’m looking to take profit, of course targeting those predicted high levels that come through.
But of course, overall the trend’s still very much to the upside. You want to go ahead and stay in those trends as long as possible. And again, you see really the effectiveness of this neural index, letting you know that hey, there’s some weakness. You’ll trade, over the next trading days, you’ll trade below that predicted moving average, but you’re not anywhere close to that blue line crossing below the black line and letting you know that average prices are now expected to go lower. Again, really nice opportunity. Again, a lot of strengths still forecasted here as far as trend and those short term indicators. And of course, the help from that predicted range guiding you day by day moving forward.
Once again, guys, this has been our Hot Stocks Outlook now for January 10th, 2020. Thank you all for watching. Best of luck in the markets and bye for now.